
Seeing how we’ve started looking at data from last year, I thought it would be interesting to look at global home prices as of Q4 2015. Here’s a chart from Knight Frank, which they refer to as their Global House Price Index:
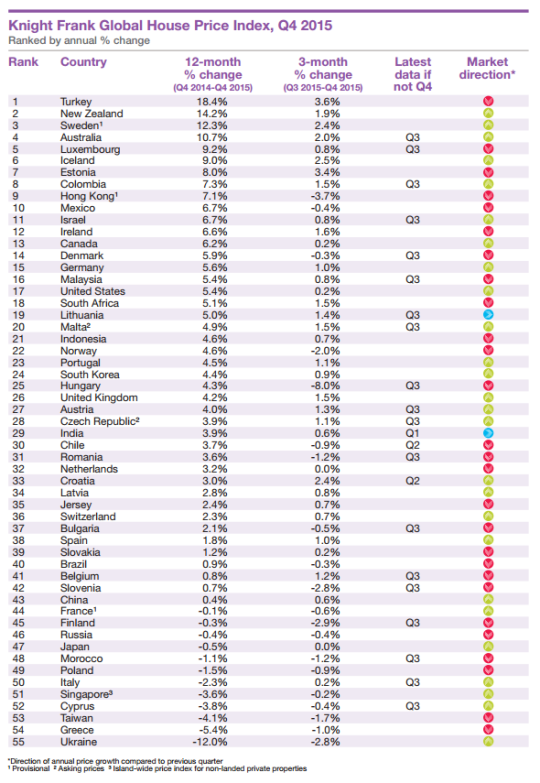
At the top of the list is Turkey, with an 18.4% increase from Q4 2014 to Q4 2015. (Supposedly this is because it has recently become easier for foreigners to buy property in the country.) Canada is 13th with a 6.2% increase (during this same time period) and the United States is 17th at 5.4%.
This is obviously a high level analysis. There are lots of regional and local variations within each country. For instance in Canada right now, Calgary is a very different place than, say, Vancouver or Toronto.
Nonetheless, it’s still valuable to see the relative performance of each country and see what their (Knight Frank’s) prediction is for 2016:
“Our outlook for 2016 is muted. We expect the index’s overall rate of growth to be weaker in 2016 than 2015. The global economy is experiencing a potentially dangerous cocktail of low oil prices, a strong [US] dollar and a continued slowdown in China.”
It’s also interesting to see how the countries rank in terms of affordability:
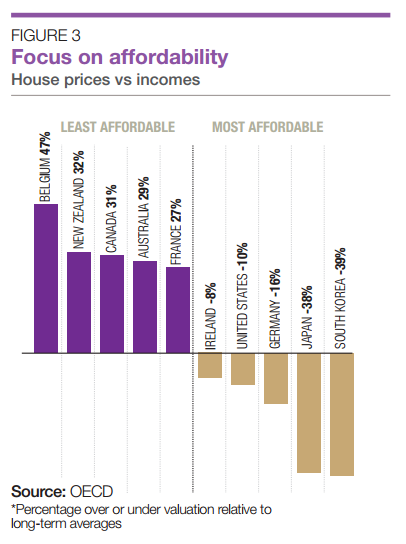
Once again, Canada ranks as being one of the least affordable countries in terms of home prices.
Leave a Reply