Daily insights for city builders, delivered every morning at 6 AM ET. I’m Brandon Donnelly — a Toronto-based real estate developer and founder of Globizen. I’ve been writing here since 2013.
“Cities have become the basic platforms for global innovation and economic growth, supplanting the corporation as the fundamental organizing unit of the contemporary economy.” -Richard Florida
Richard Florida and Patrick Adler of the Martin Prosperity Institute here in Toronto have been doing some research on what they are calling “urban tech.” They define it as encompassing the following industry sectors: co-living and co-working; mobility; delivery; smart cities; construction tech; and real estate tech.
Here are the largest urban tech startups based on the amount of VC investment they have received:
Below is how the space breaks down by sector. Mobility / ride hailing is the behemoth, receiving 61% of all VC investment. Food delivery is next. And “proptech” is at the bottom.
Finally, here are the top “urban tech” cities. Beijing is right up there with San Francisco.
San Francisco recently became the first city in the US to ban the use of facial recognition software by city agencies. (There’s a second vote next week, but it is considered just a formality.) A similar ban is also making its way through the system in Boston.
I thought the following quote by Aaron Peskin in the New York Times was an interesting one, because it speaks to some of the growing tensions between tech, policy, and city building:
“I think part of San Francisco being the real and perceived headquarters for all things tech also comes with a responsibility for its local legislators,” Mr. Peskin said. “We have an outsize responsibility to regulate the excesses of technology precisely because they are headquartered here.”
I can appreciate both sides of this argument.
For those concerned about crime and safety, facial recognition promises more effective policing. That’s why this technology is already used at many airports, including SFO. (Because it’s under federal jurisdiction, it won’t be impacted by this ban.)
At the same time, there are legitimate concerns related to the large-scale collection of personally identifiable data. And it is this same concern that is fueling the debates here in Toronto around what Sidewalk Labs is up to along the waterfront.
I am not an expert on this particular topic (or many topics for that matter). But if you’re a regular reader of this blog, you will know that I believe in innovation and I believe in progress.
However, I also believe that it is important and healthy for us to be having these debates. Because what I do know is that I wouldn’t want Toronto to become Shenzhen. I wouldn’t want to jaywalk across the street and have facial recognition software automatically send a ticket to my phone and post my photo to a “wall of shame.”
Architect Jeanne Gang (of Studio Gang) has just been named to the TIME 100, which is Time magazine’s annual list of the world’s most influential people. Jeanne is the only architect to be included in the 2019 list.
Jeanne was named to the “Titans” category, which typically honors those who are at the top of their respective field. She sits alongside Mark Zuckerberg, Tiger Woods, and LeBron James in this year’s TIME 100.
Past honorees within the architecture profession include Elizabeth Diller, David Adjaye, and Bjarke Ingels. All, stars.
The list is in its 16th year. But it’ll be the first year where there will also be a day-long conference. (Lynne and Marc Benioff, of Salesforce, acquired the magazine in 2018 for $190 million in cash and are making some changes.)
Congratulations Jeanne.
Full disclosure: Studio Gang is the design architect for our One Delisle project in midtown Toronto.
According to the National Association of City Transportation Officials (NACTO), scooter trips in the US surpassed station-based bike share trips for the first time in 2018. Here is a chart taken from Streetsblog:
Dockless electric scooters have created a public nuisance in many of our cities, but what is clear is that the demand is there. Which perhaps isn’t all that surprising given that they require less effort than traditional cycling.
The other interesting takeaway from NACTO’s analysis, which is likely also not that surprising, is that bike share trips are heavily concentrated in a select few cities.
In 2018, there were about 36.5 million bike share trips across the US. And about 84% of them took place in just 6 cities: New York, Boston, Chicago, DC, Honolulu, and San Francisco.
Almost half of the 36.5 million trips were on NYC’s Citi Bike network.
Davis’ argument, which of course has been made by others before, is that deregulation has allowed housing supply to actually keep up with demand. Land use policies were relaxed to allow taller and denser buildings to be built and some degree of decision making (I’m not sure how much) was moved to the central government in order to counteract the NIMBY problem that invariably attaches itself to local politics.
The result is housing numbers that look and compare like this:
In Tokyo last year, housing starts came in around 145,000, according to Japan’s land ministry. This figure is on par with the total number of new housing units authorized last year in New York, Los Angeles, Boston and Houston combined, based on the U.S. Census Bureau data. The same feat was achieved in 2017.
If we are to normalize against New York, it looks like this:
And the belief seems to be that it is working:
“A reason why housing prices in Japan are not rising as fast as in New York, for example, is the large number of housing starts,” says Masahiro Kobayashi, a director general at the Japan Housing Finance Agency, a state-run entity which supports the housing market by purchasing home loans.
One sentence that really stood out for me in the article is this one here: “Private consultants were given permission to issue building permits to speed up construction.” If any of you have tried to pull a building permit for a large project in Toronto, you’ll know that it can take a very long time (understatement). Maybe it is the same in your city. Should we be looking at this?
Three years ago I wrote about how I was one step closer to not only going cashless — I had pretty much already done that — but also going walletless. (That’s one of the things about writing a daily blog — there’s a public record.) I still carry a wallet in most cases, but I couldn’t tell you the last time I paid for something using cash here in Toronto. It was probably at a Vietnamese restaurant.
I did, however, notice on my trip last month that Germany and Austria are still quite reliant on cash. Many places only accepted cash and many places wouldn’t accept credit cards under a certain minimum spend. Fewer opportunities to just tap as well. I had forgotten how annoying it was to carry around lots of coins. You really need a change purse.
Still, a paradigm shift has taken place. And because of this shift, there’s a growing movement in cities toward banning cash-free businesses. Philadelphia, Chicago, San Francisco, New York City, and Washington, DC are all working on policy. The concern is that not accepting cash discriminates against lower-income patrons.
An additional 24.2 million US households (additional 18.7% of all households) are estimated to be “underbanked”, meaning they have at least one account at an insured institution, but they also rely on outside financial products — such as payday loans.
When surveyed, somewhere around half tend to cite “not having enough money” as one of the reasons for being “unbanked.” But the good news is that the percentage of people without a bank account seems to be declining (see above chart).
This is important because we all know where things are headed. And banning cashless businesses isn’t going to stop that march. There are deeper issues that need to be addressed. Here is an excerpt from a recent CityLab article on the topic:
“I certainly don’t think [this bill] is the right long-term solution,” said Rogoff. “The future does not lie in this direction. The future lies in giving people free debit cards and financial inclusion.” He cited the case of India. The country launched a program to decrease the number of unbanked and saw the percentage decrease from 47 percent of adults in 2014 to 20 percent unbanked in 2017 according to the World Bank Global Findex Report. “If India can manage to give people free debit cards, so can the U.S.” Rogoff said.
Kenneth Rogoff is a professor of public policy at Harvard University, the former chief economist of the IMF, and author of The Curse of Cash. If you’re interested in this topic, his book may be a good one to check out.
The third edition of Savills’ annual Tech Cities report is now out. Savills is a global real estate company headquartered in London and a few years ago they started looking and what makes a successful “tech city.” As always, you should take these rankings with a healthy dose of scepticism. But this one is based on over 100 individual metrics across 6 main categories:
Business environment (such as the size of the financial services industry)
Tech environment (such as the amount of inward VC investment)
City buzz and wellness (is it a cool place to live?)
Talent Pool (is the city creating and attracting young/smart talent?)
Real estate costs
Urban mobility
Here are the top 30 cities for tech and startup companies:
New York takes the top spot, supposedly because of its deep talent pool and position as one of if not the capital the world. But my friends in the Bay Area tell me that their housing shortage is also starting to impact SF’s tech dominance.
Generally, the report finds that the above “tech cities” should see their GDP rise by 36% over the next decade, compared to 19% for other developed cities. I’m not sure how much of this has to do with tech, but the above list does differ from what you’d see in a more conventional global cities index. Here you have Austin ahead of global cities such as Hong Kong. And you have Toronto ahead of cities like Tokyo and Paris.
One takeaway that shouldn’t come as a surprise to readers of this blog is the rise of Chinese cities in the index. Beijing is ahead of New York, London, and San Francisco by a wide margin in terms of annual VC investment. And Chinese cities as a whole are starting to take a greater share of global VC dollars (second chart below).
If you’d like to download a PDF of the full report, you can do that here.
The MIRA Tower in San Francisco is one of my favorite buildings by Studio Gang and probably my favorite tall building under construction right now. Here’s a video and a few photos from the San Francisco Chronicle’s urban design critic, John King:
Now that the MIRA Tower is well underway, I have to say that it looks even better than it did pinned to the walls of their Chicago studio. I can’t wait to see it in person once it’s complete.
Earlier in the week, my friend Rodney Wilts of Theia Partners sent me a JLL report called, World Cities: Mapping the Pathways to Success. I am admittedly only getting around to it now.
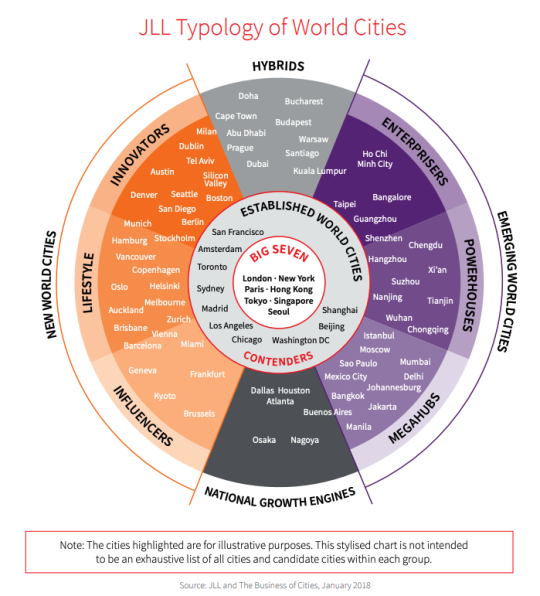
The report proposes a new typology of world cities that looks like this:
It is based on 10 overall categories of cities, grouped into 4 main buckets. The first bucket is “Established World Cities”, within which there is the “Big Seven”, and then the “Contenders.”
The Real Estate Highlights that accompany each category of city is a good place to start if you’re looking to do a quick scan of the report.
Here’s a taste:
One-quarter of all capital invested in commercial real estate globally currently lands in one of the “Big Seven” cities. And London and New York are easily at the top.
Cities that recently graduated from “New World City” status – namely Toronto, San Francisco, Sydney, and Amsterdam – are all struggling to address housing and infrastructure deficits.
“Lifestyle” cities – such as Vancouver, Auckland, and Oslo – are some of the most active investment markets. Biggest rental growth for prime offices (since 2000) in the “New World Cities” category.
BuildZoom, which is a tool to help people find local contractors, recently looked at construction costs across the US.
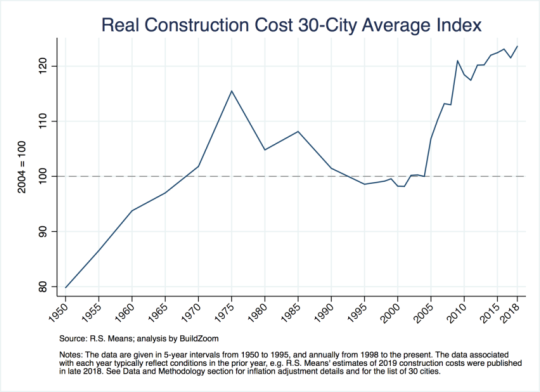
Here is their 30-city average index running from 1950 to roughly today:
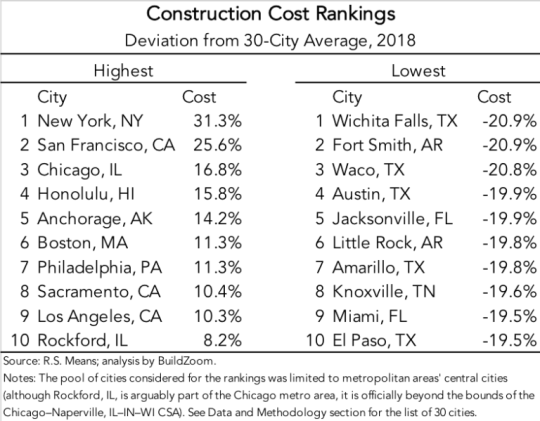
Here is a chart showing the most and least expensive cities (that is, the cities that deviate the most from their 30-city average):
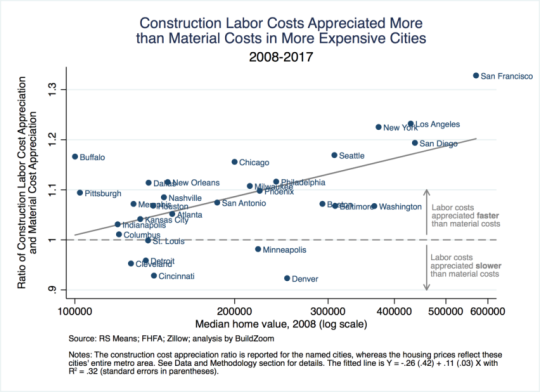
And here is a chart that compares labor cost appreciation to material costs:
Labor costs account for the bulk of the geographic variation in construction costs and the most expensive cities to build in also tend to have the highest median home prices.
The way to read the above chart is that any city with a y-axis value greater than 1 means that labor costs have appreciated faster than material costs from 2008 to 2017.
In the case of San Francisco, labor costs have appreciated 32.8% (> 1.3) faster than material costs.
Part of this likely has to do with the fact that San Francisco is an expensive city in which to live. People have to be paid more if they’re going to work there.