Daily insights for city builders, delivered every morning at 6 AM ET. I’m Brandon Donnelly — a Toronto-based real estate developer and founder of Globizen. I’ve been writing here since 2013.

Category: Paris

  • The biggest developer in Paris today is the mayor

    March 9, 2025 · View original


    The other night, I went down a Parisian real estate rabbit hole on Twitter. And one of the things that kept coming up was this half joke: The biggest developer in Paris today is the mayor. The reason for this is that the city is targeting 40% of all homes to be public housing by 2035 (of which 30% will be social housing and 10% will be moderately affordable).

    Supposedly this is to stem the steady outflow of people from the capital as a result of housing being too expensive. But it means that a lot of new public housing will need to be created. As of January 1, 2021, the official estimate was 260,563 “logements sociaux” in the capital, which translates into 22.4% of all principal residences.

    To hit this 40% goal, the city is going to need to create somewhere around 140,000 new public housing dwellings between now and 2035. So how does it plan to do this? By being a developer, of course. A big part of the strategy seems to be to convert existing buildings (d’adapter l’existant). And to execute on this, the city is leveraging something known as “le droit de préemption.”

    The way it works is like a right of first refusal clause (ROFR), except that it’s not something that was contractually negotiated between market participants, it’s just the law. What it means is that if a property owner goes to sell their building and they receive an offer, the city has an automatic ROFR and can choose to buy the building at whatever that third party was willing to pay.

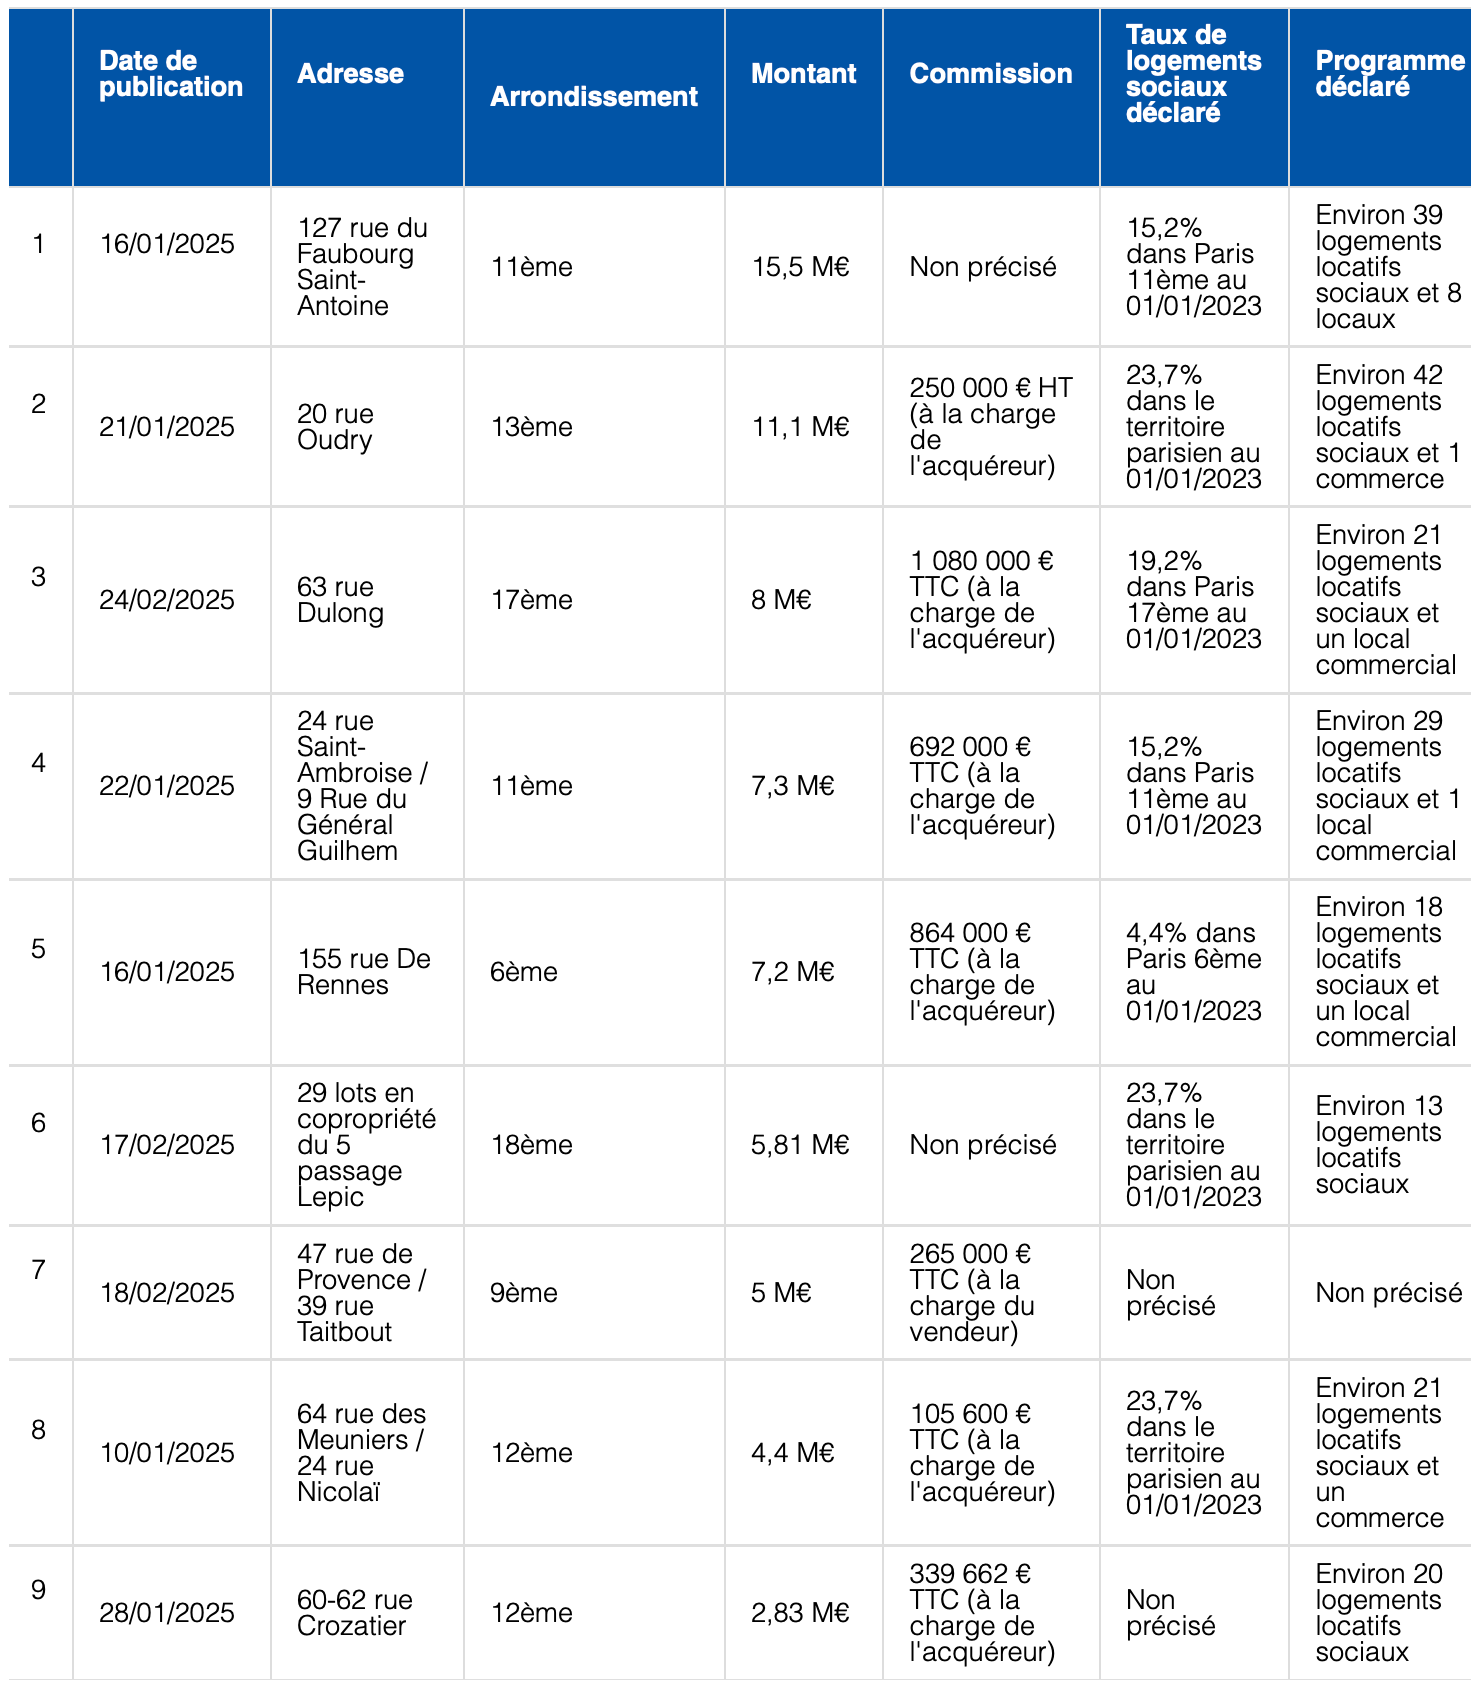
    Over the last two years, the city has elected to do this 84 times and has spent over €1.1 billion, according to Business Immo. And since the beginning of this year, they’ve done it 9 times, spending about €67 million on the following properties:

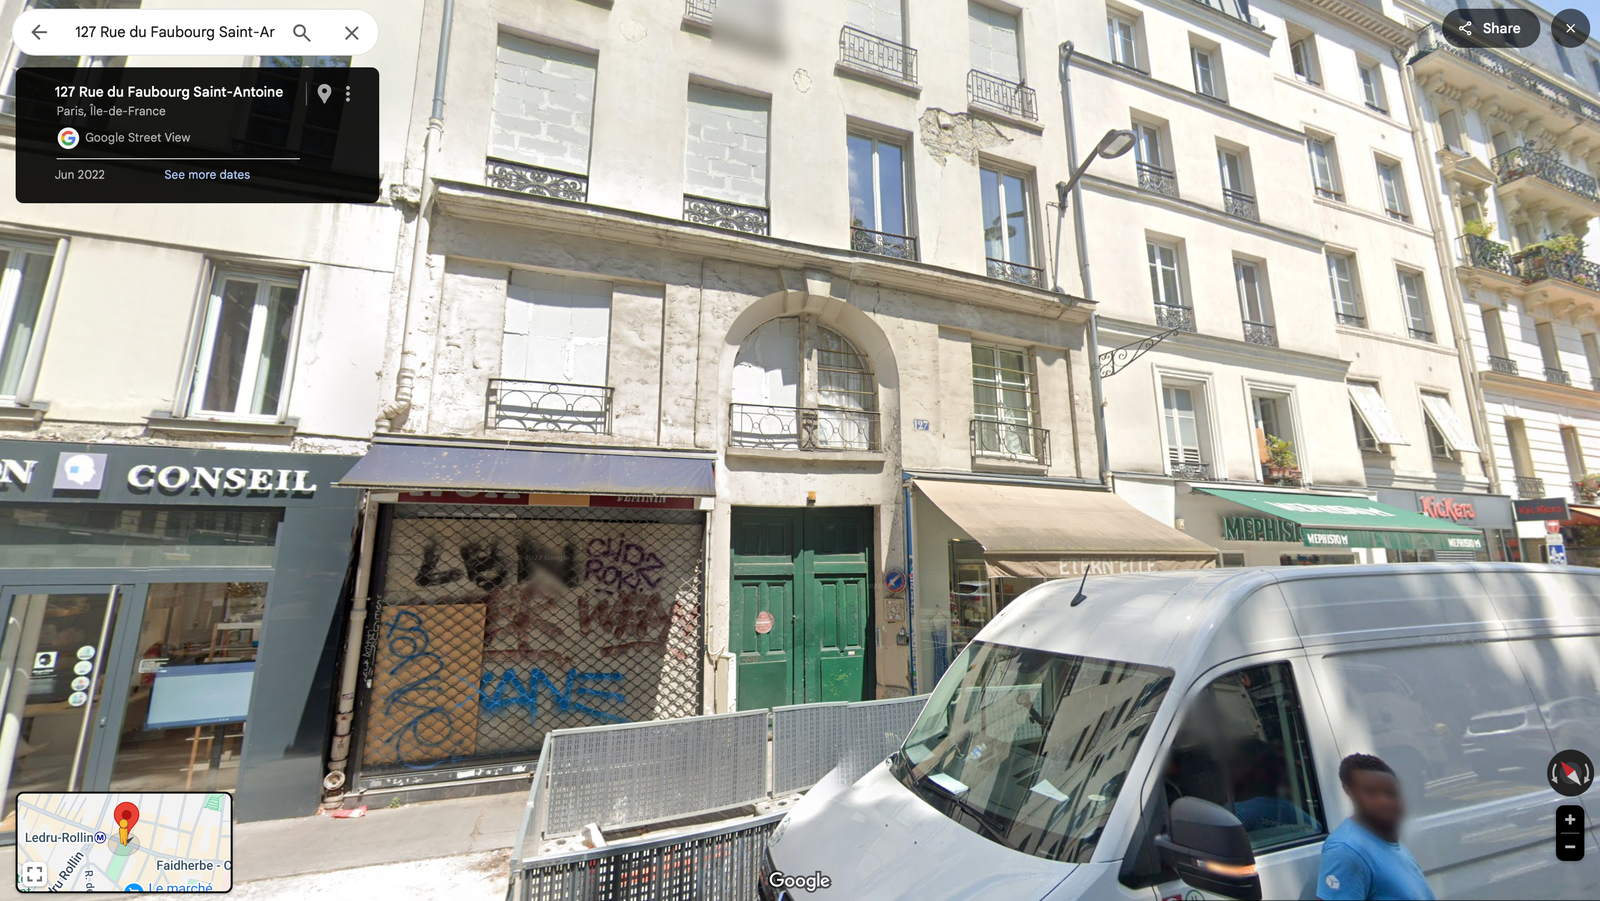
    For those of you who are visual learners like me, here’s the first property on the list:

    It’s certainly ambitious.

    But, for the most part, it does not create a lot of net new housing, even though the city is also aiming to buy office buildings, parking garages, and other non-residential buildings. APUR previously estimated that for every 1 unit of new public housing, 0.6 existing units are being demolished. So the most accurate way to think about this initiative is that it represents the socialization of Paris’ housing stock into public hands.

    This runs in contrast to what we’ve been talking about recently with cities like Minneapolis and Austin, who have instead added a lot of new market-rate housing in order to temper rents and increase affordability. Paris is reducing its stock of market-rate housing.

    At the same time, the city also enacted new policy prohibiting homes that consume more than 450 kWh/m2 from being rented. This is intended to force landlords to renovate, but it will certainly have a further impact on supply, at least in the short term.

    It’s also worth noting that all of this is happening at a time when Paris’ housing market is in broad decline (less transactions, higher days on market, lower prices, and so on). Like Toronto, it started around the middle of 2022. And it’s something that Paris hadn’t seen since the 2008 financial crisis.

    Chart by CoStar via Business Immo; cover photo by Salomé Watel on Unsplash

  • Demographic trends in Greater Paris

    January 20, 2025 · View original


    The work of l’Atelier parisien d’urbanisme (or Apur) is right in my wheelhouse. Run by an architect, they are a group that analyzes, documents, and then develops strategies for urban matters impacting Paris and Greater Paris (la Métropole du Grand Paris). For example, last year they published a book called Paris Atlas, which contains 150 original maps and lots of statistics about the city. And this month, they published a note talking about population and demographic trends in the city. Here’s a brief summary of this latest report.

    As of January 1, 2022, there were 7,115,576 people in Greater Paris:

    Between 2016 and 2022, its population grew by about 0.2% per year or about 14,800 people per year. This is slower than the previous reporting period (2011 to 2015). It’s also all because of natural births:

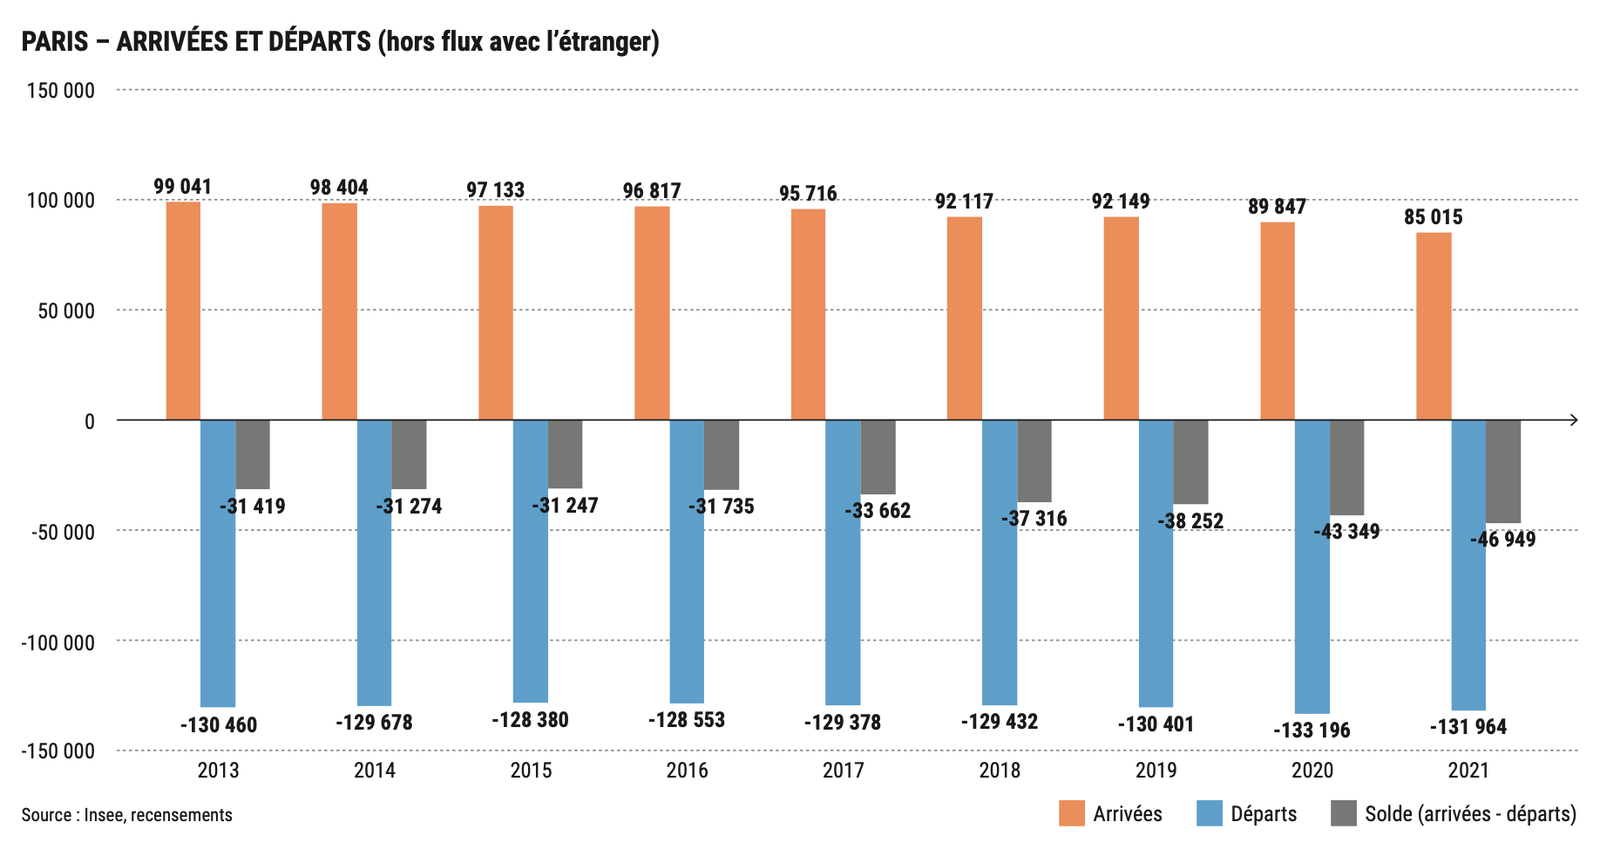
    When it comes to migration, more people leave the city each year than come to it:

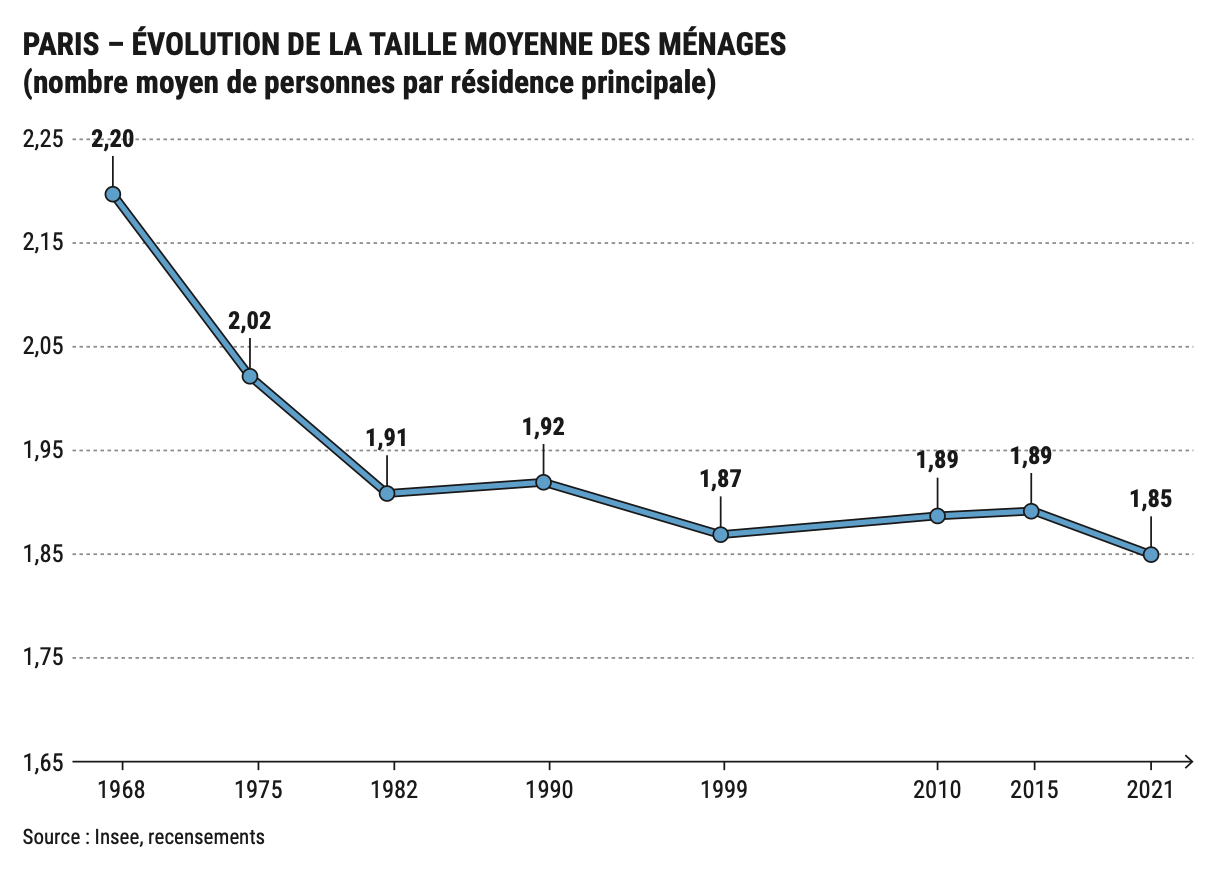
    This runs in contrast to a city region like Toronto, where the vast majority of our population growth comes from positive net migration. This is also true of Canada as a whole. Still, Paris is not immune to lower birthrates and a declining average household size:

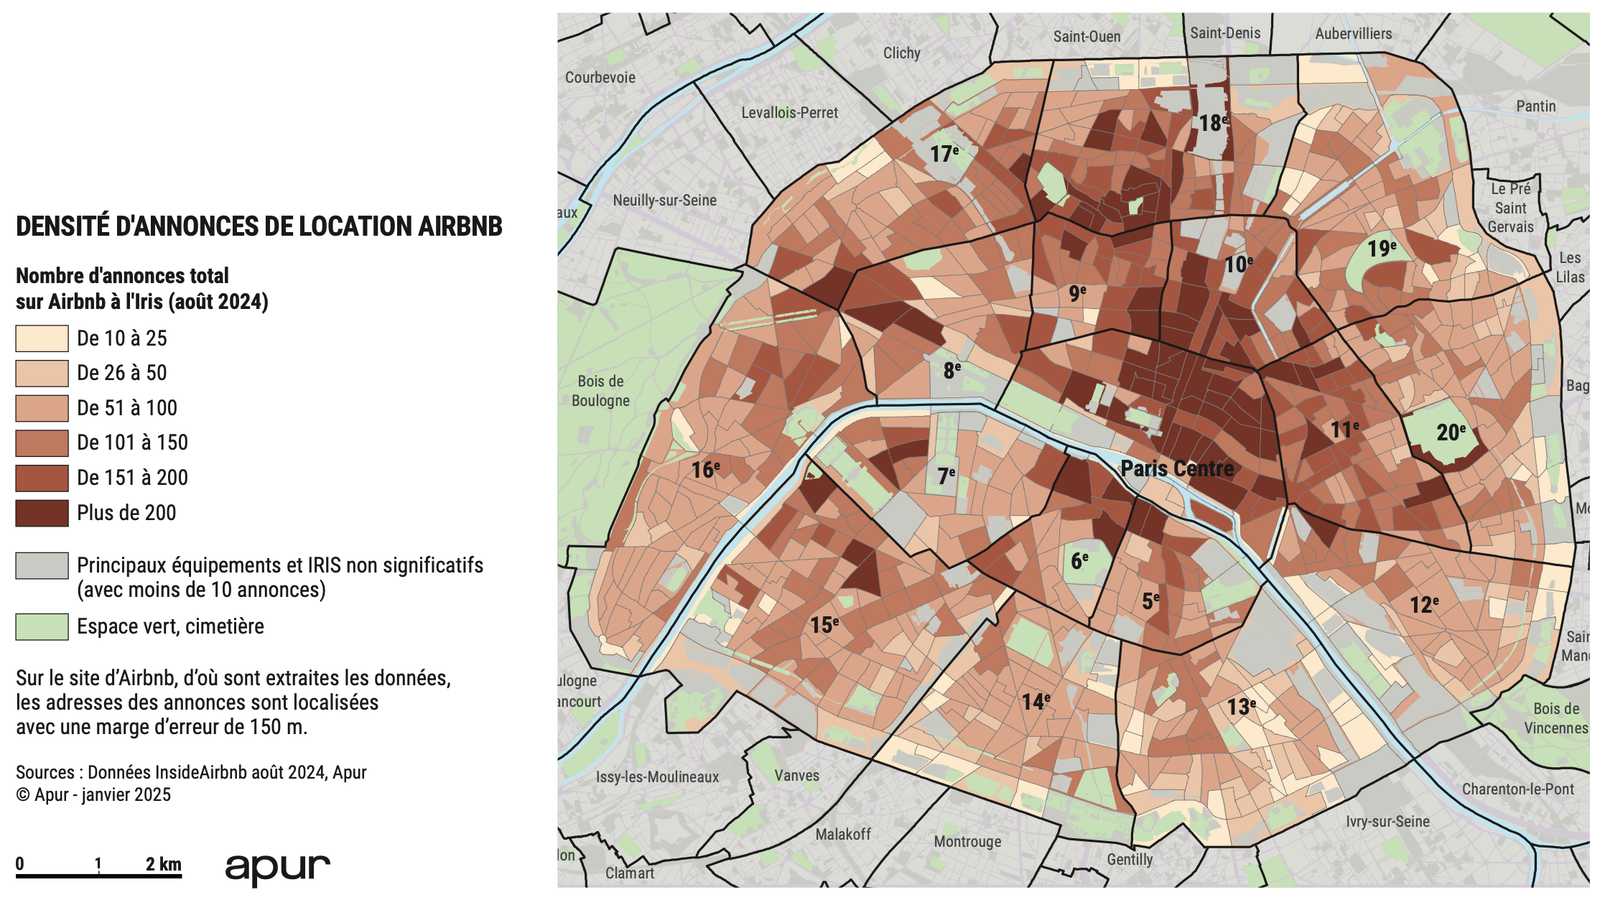
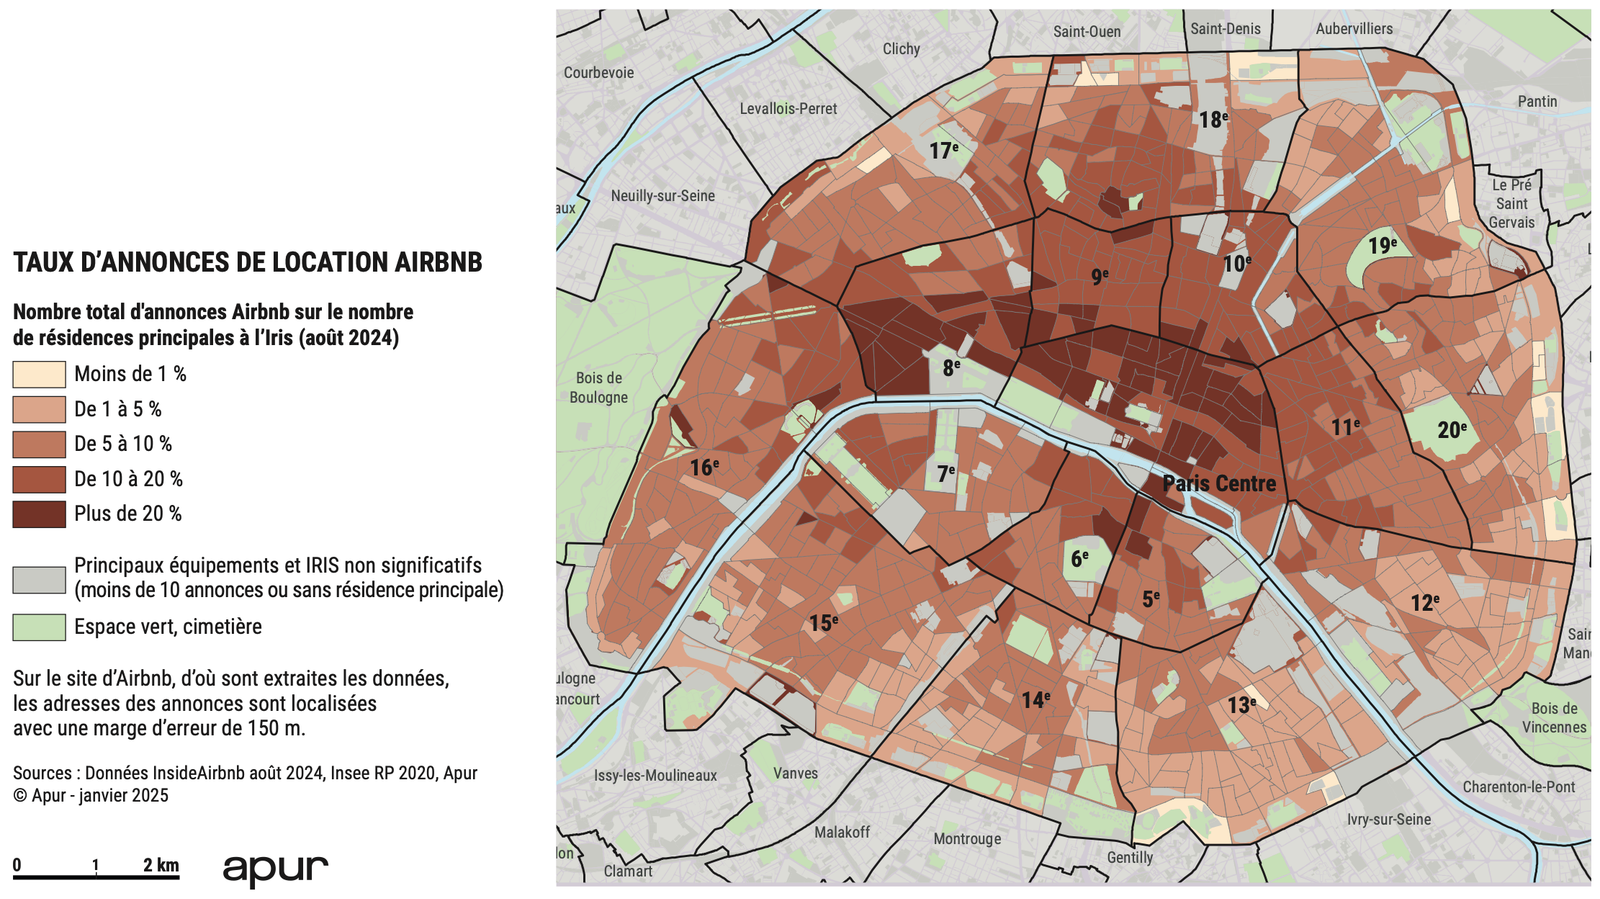
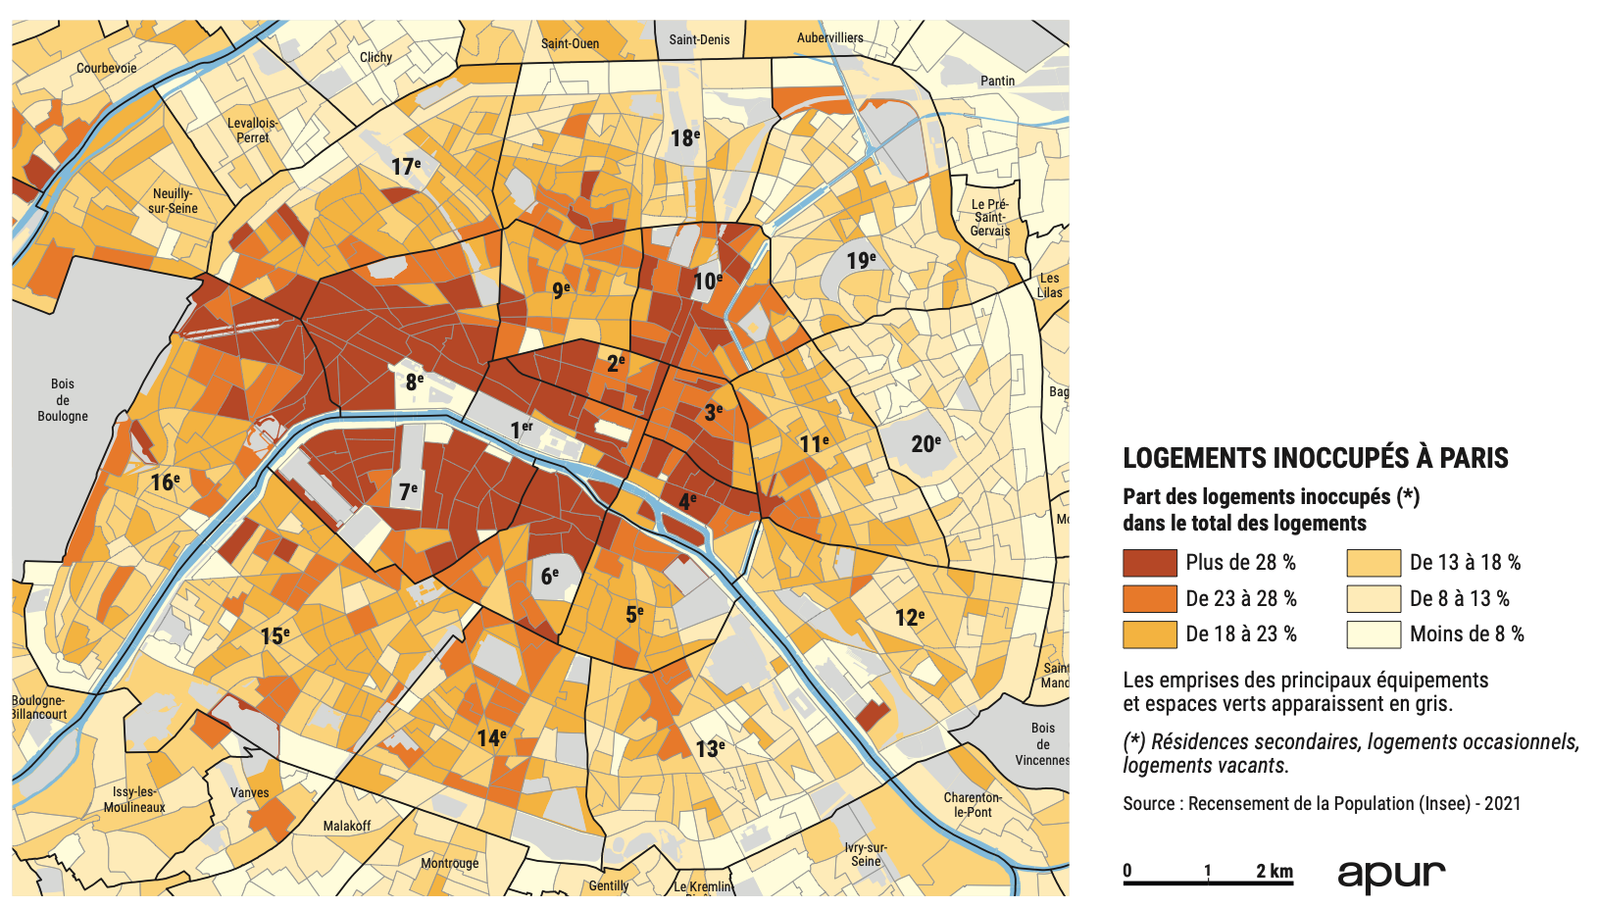
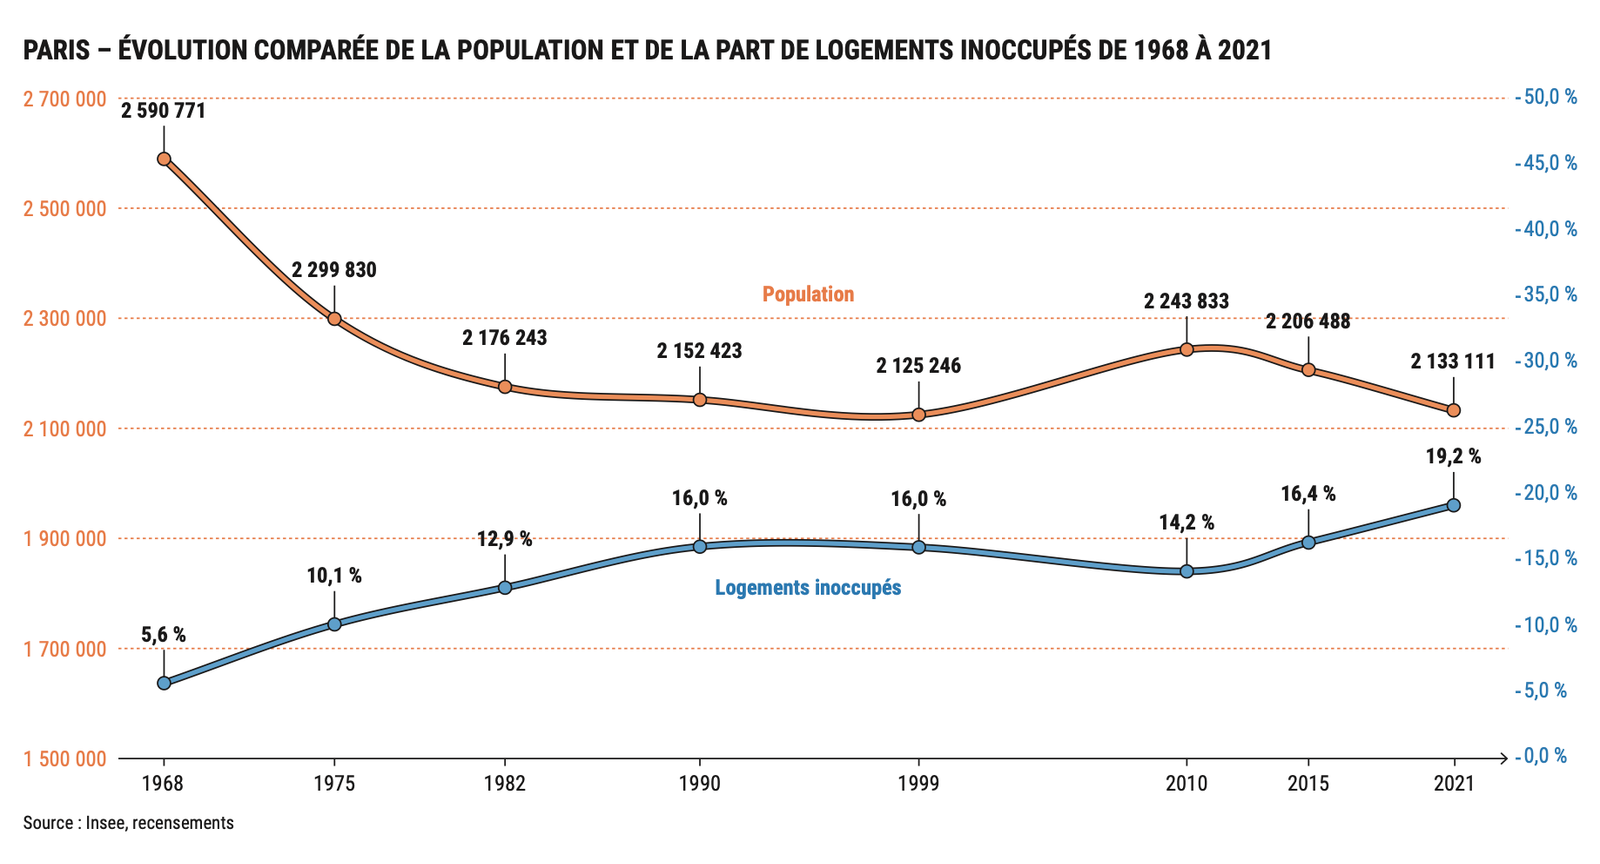
    Another factor impacting population, according to the report, is the decline in principal residences (homes occupied for more than 6 months of the year) and the rise of what the report calls “unoccupied homes”, which includes secondary homes and vacation rentals. As of 2021, the number of “unoccupied homes” was estimated at approximately 19.2%:

    However, in four arrondissements (1, 6, 7, and 8), the number of homes not used as a principal residence is thought to exceed 30%! This is making it even harder to build enough new homes. For example, between 2015 and 2021, Paris built approximately 30,300 new homes. (Reminder, the Greater Toronto and Hamilton Area completed about that many in one year last year.) But at the same time, the city counted 14,600 fewer principal residences. This is, I guess, what happens when you’re one of the most visited cities in the world.

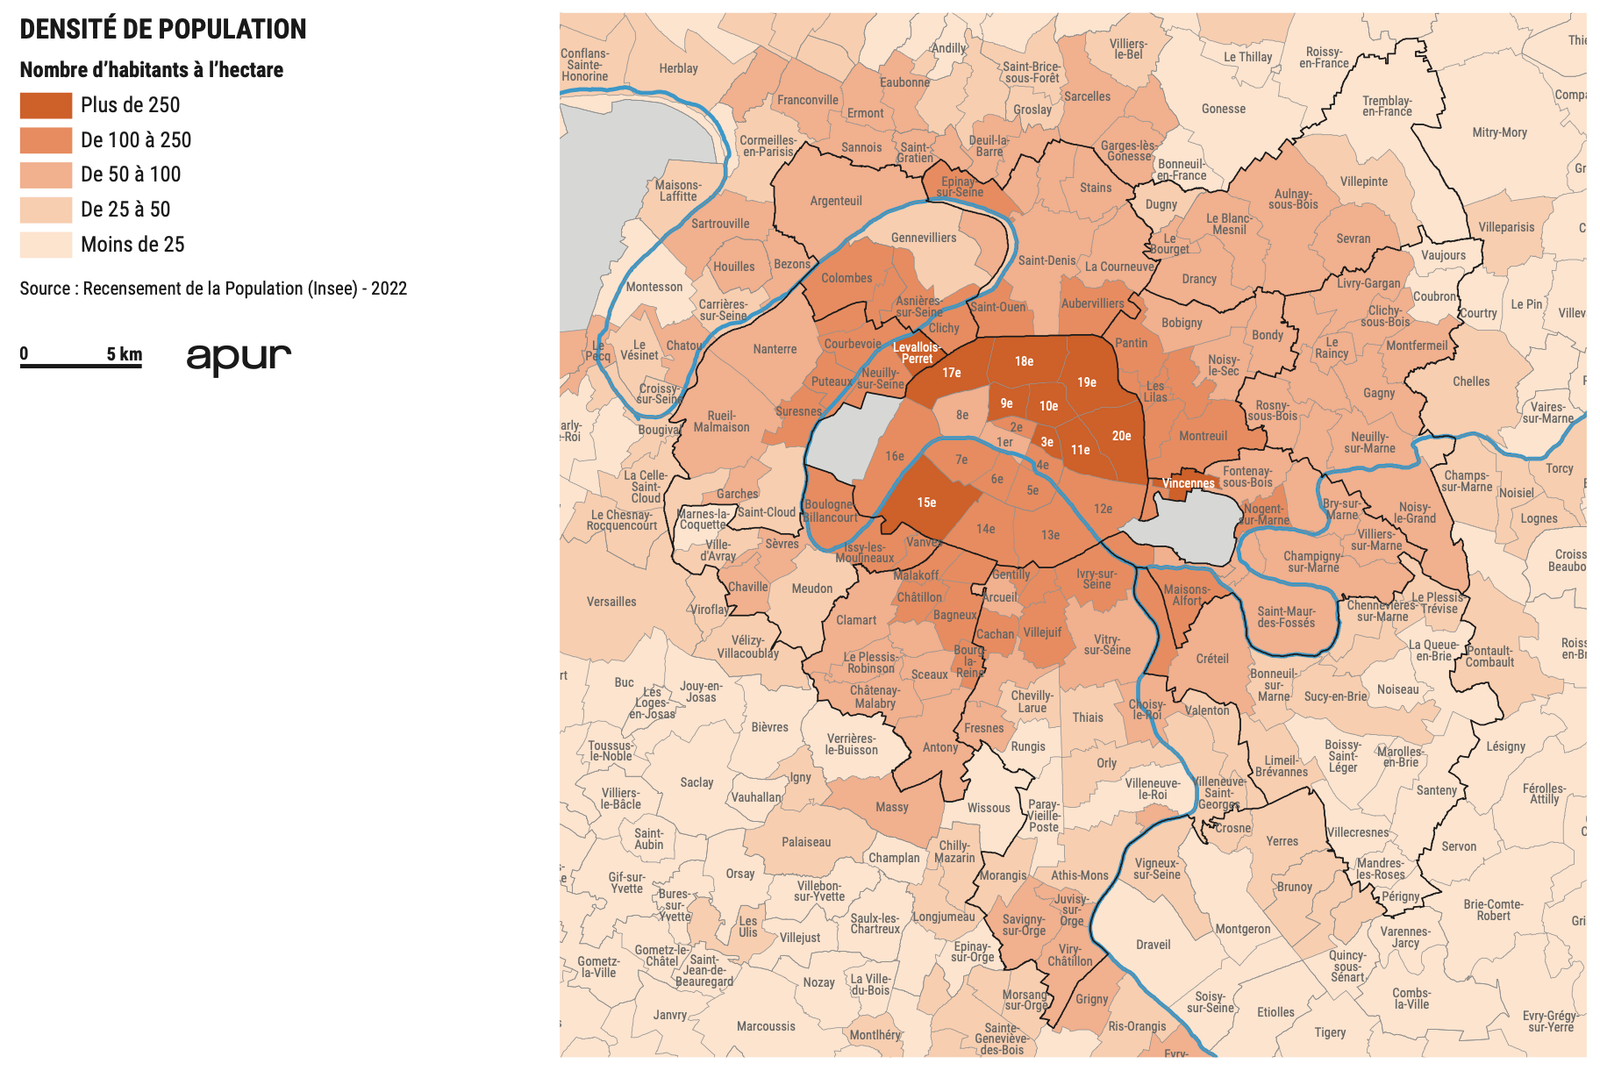
    To end, I’ll leave you all with this population density map:

    The darkest areas represent more than 250 people per hectare. That works out to more than 25,000 people per square kilometer (just divide the above numbers by 0.01). At the same time, between 2016 and 2022, the population of Paris proper (not Greater Paris) decreased by an average of 12,800 people per year. This is in comparison to an average decrease of 11,900 people per year for the period of 2011 to 2016. As is the case in many/most cities, Paris’ population growth is happening largely in the suburbs and in the outskirts.

    Cover photo by JOHN TOWNER on Unsplash

  • Paris may have the busiest bike route in the world

    In my opinion, we need far better urban data if we’re actually going to make evidence-based decisions. Thankfully, there are lots of great companies that are focused on this space. One of them is Eco-Counter, which makes devices to count pedestrians and cyclists, among other things. This is an important job, because as Peter Drucker used to say, “you can’t manage what you don’t measure.”

    Let’s look at their bike counters. According to their global map, they have 464 of them installed around the world. Montreal has 58 of them, which we’ve spoken about before, and is an impressive install base. And Toronto looks to have only one, which is located on Bloor Street on the north side of High Park.

    The busiest route/counter in Montreal is at St-Denis Street and Rue des Carriéres. So far this year — up to November 17, 2024 — this counter has seen an average of just under 5,000 trips per day and a year-to-date total of 1,600,468 trips. Both of these metrics are notably up compared to 2023 when I last looked at the data.

    The busiest route in Eco-Counter’s entire network is on Boulevard de Sébastopol in Paris (an important main roadway, not a side street). It has seen an average of 13,667 trips per day and a year-to-date total of 4,386,996 trips. Not surprisingly, the Paris counter exhibits less seasonality. People still cycle in the winter in Montreal, but it’s less than in the warmer months.

    Finally, our lone Toronto counter adjacent to High Park has seen an average of 1,186 trips per day and a year-to-date total of 380,813 trips. Not quite Paris or Montreal (the latter of which has a colder climate), but I would argue that this really isn’t an indicative location for Toronto given how underdeveloped the area is. Plus, you need to see each route as part of a network.

    If you look at Montreal’s top 5 bike counters, all of them have a year-to-date total that exceeds 1 million trips. This is important information if you’re trying to make mobility decisions and these are significant figures. Imagine if these millions of people got off their bikes and instead decided to take transit or drive a car. That would change things.

    Photo by Celine Ylmz on Unsplash

  • Call with a Paris developer

    I had a call with a developer in Paris earlier this week and it was interesting to hear him talk about the new home market over there. It sounded a lot like Toronto. Higher interest rates cooled demand. Individual investors largely disappeared. And now developers are having to rethink their strategies and floor plans (including suite sizes).

    But in his view, this isn’t necessarily a bad thing. It now means that you actually have to be a reasonably good developer in order to have a chance at succeeding. You have to design thoughtful floor plans and build great housing. It’s a return to fundamentals, and I would argue that the same thing is happening here in Toronto.

    My other noteworthy takeaway was around social housing. All new developments in the Île-de-France region are subject to inclusionary zoning. I believe the requirement is 30% of the suites. These suites are then purchased by social housing operators, and it is one of the ways that new supply is created in the market.

    We talk a lot about IZ on this blog, but what’s interesting about this approach is that it becomes a forward sale for the developer. Meaning, it helps to de-risk projects. Before doing anything, you know you’ve sold 30% of your inventory, and somehow the numbers all work. European social housing math is baffling to me.

    I am now wondering if this creates some kind of incentive to keep development costs in check. Because if social housing operators are expected to buy 30% of all new homes, then they too are going to want them to be as cost effective as possible. I’m speculating though; I don’t know that this is the case.

    If you’re a developer or real estate person in Paris, please get in touch. I’d love to learn more about your market and trade notes.

  • Paris introduces new limited traffic zone

    As counterintuitive as it may sound, one way you could try and improve traffic congestion is to discourage people from riding their bikes and instead encourage them to drive more. That’s what’s happening in Toronto right now. Another way is to dramatically restrict car usage. And starting this Monday, that’s what Paris will be doing with its new limited traffic zone (zone à trafic limité) in the center of the city:

    This new ZTL is approximately 5 square kilometers. About 100,000 people live within its boundaries, and it is estimated that somewhere between 350,000 to 500,000 vehicles enter it each day. But according to the city, it is estimated that only around 30% of these trips are absolutely necessary (because of a lack of alternatives, for example). The purpose of the ZTL is to reduce the unnecessary ones.

    The way it will work is that drivers will no longer be allowed to drive through this zone. You’ll only be able to enter if you plan on stopping for a legitimate reason. It’s not yet clear what this exact list of approved reasons will be, but the general idea is that if you want to drive in for dinner or to attend a meeting, that’s fine. What you can’t do, though, is just drive around in a souped-up Honda Civic blasting Taylor Swift.

    The next 6 months are planned to be a period of education. Drivers exiting the zone are just going to be told that there’s this new ZTL and that they better have stopped somewhere. But eventually there will be a 135 euro fine and eventually drivers will be expected to furnish some sort of supporting evidence for their stop, such as a restaurant receipt. There’s also talk of adding automatic cameras.

    Of course, this creates a lot of gray areas. What about if you’re just going over to a friend’s place for dinner? Will they then need to write you a note saying that you went over for some homemade bouillabaisse? Yeah, I don’t know the answer to this. But you have to admit that this is a bold city-building move, and a far more effective way of improving traffic flows.

    Unlike removing bike lanes, this plan will actually work.

  • Map of every development project in Paris

    It is surprisingly difficult to find good real estate and development information about a market that you’re not familiar with. So I was pretty excited when I came across this map of every development project in Grand Paris (Greater Paris) created by Arthur Weidmann.

    It’s in Google My Maps and what he has done is pin every project according to status: under construction, under renovation, approved, proposed, and recently delivered. For each pin, you’ll also find information like the expected completion date, the use(s), the area, the architect(s), and photos. It is unbelievably detailed and, according to Google, it was last updated 8 hours ago.

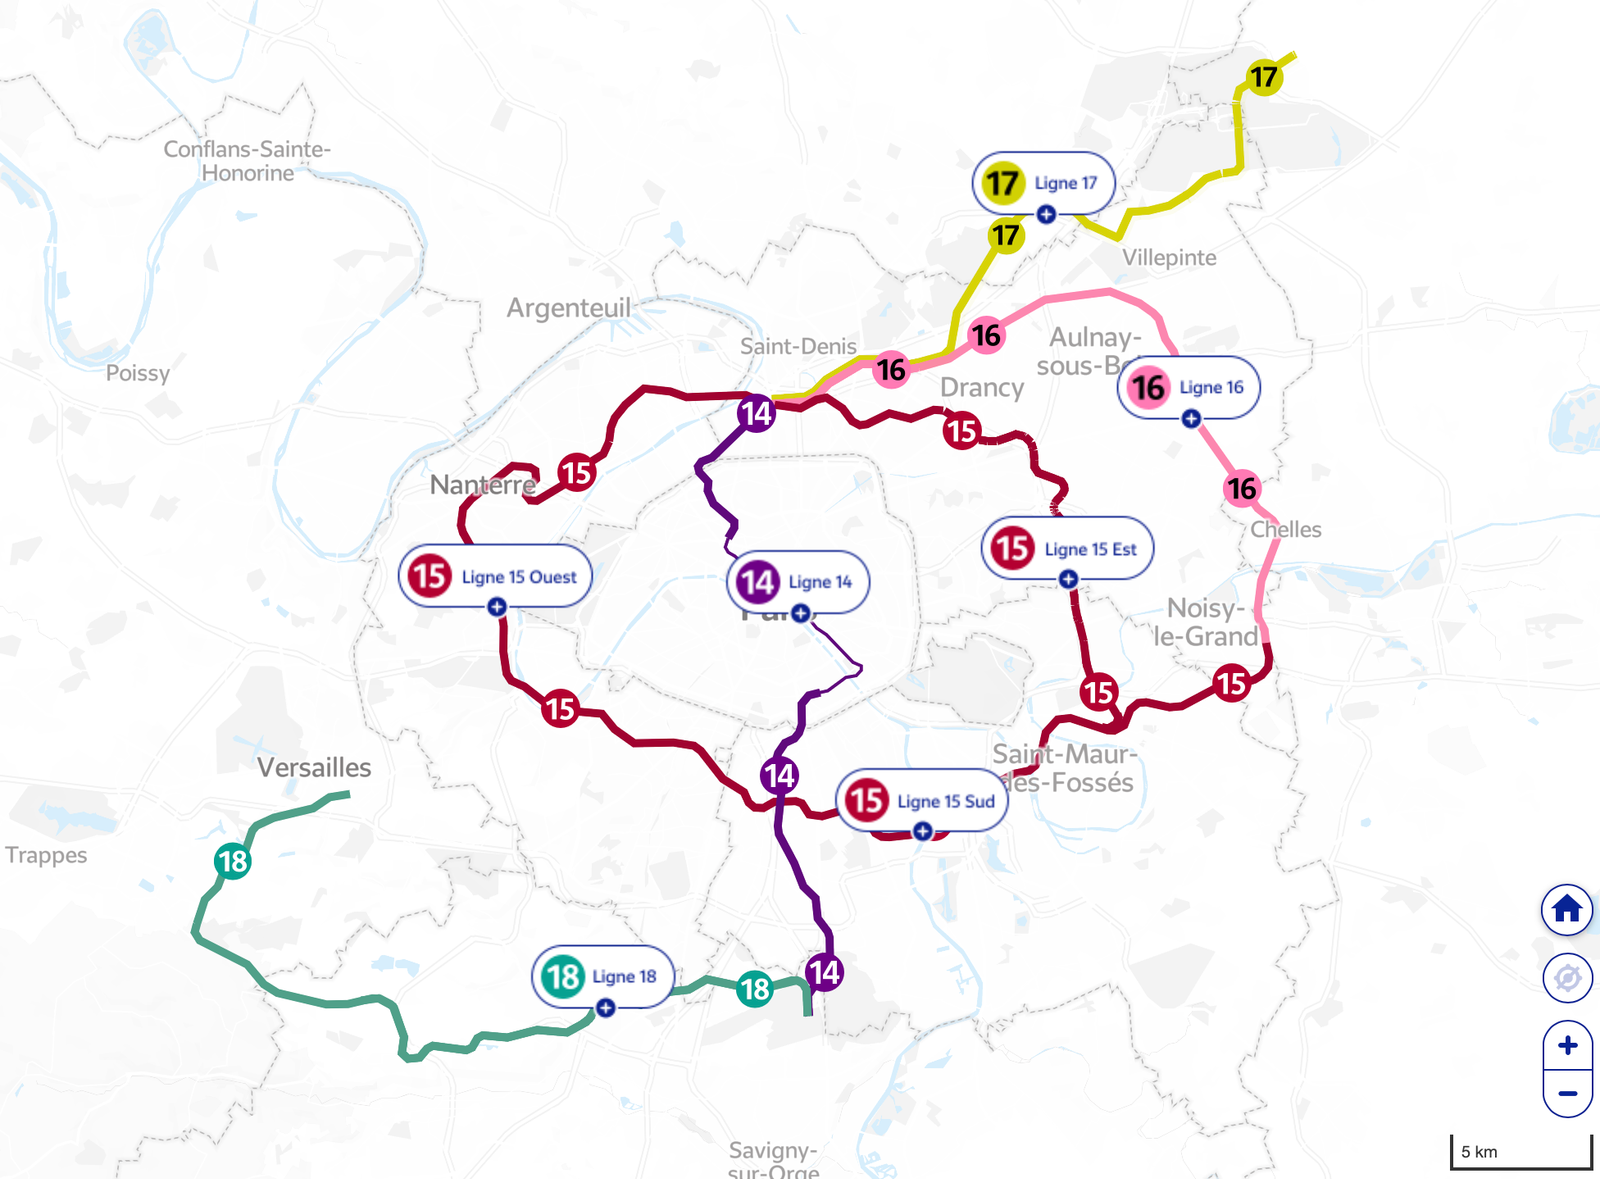
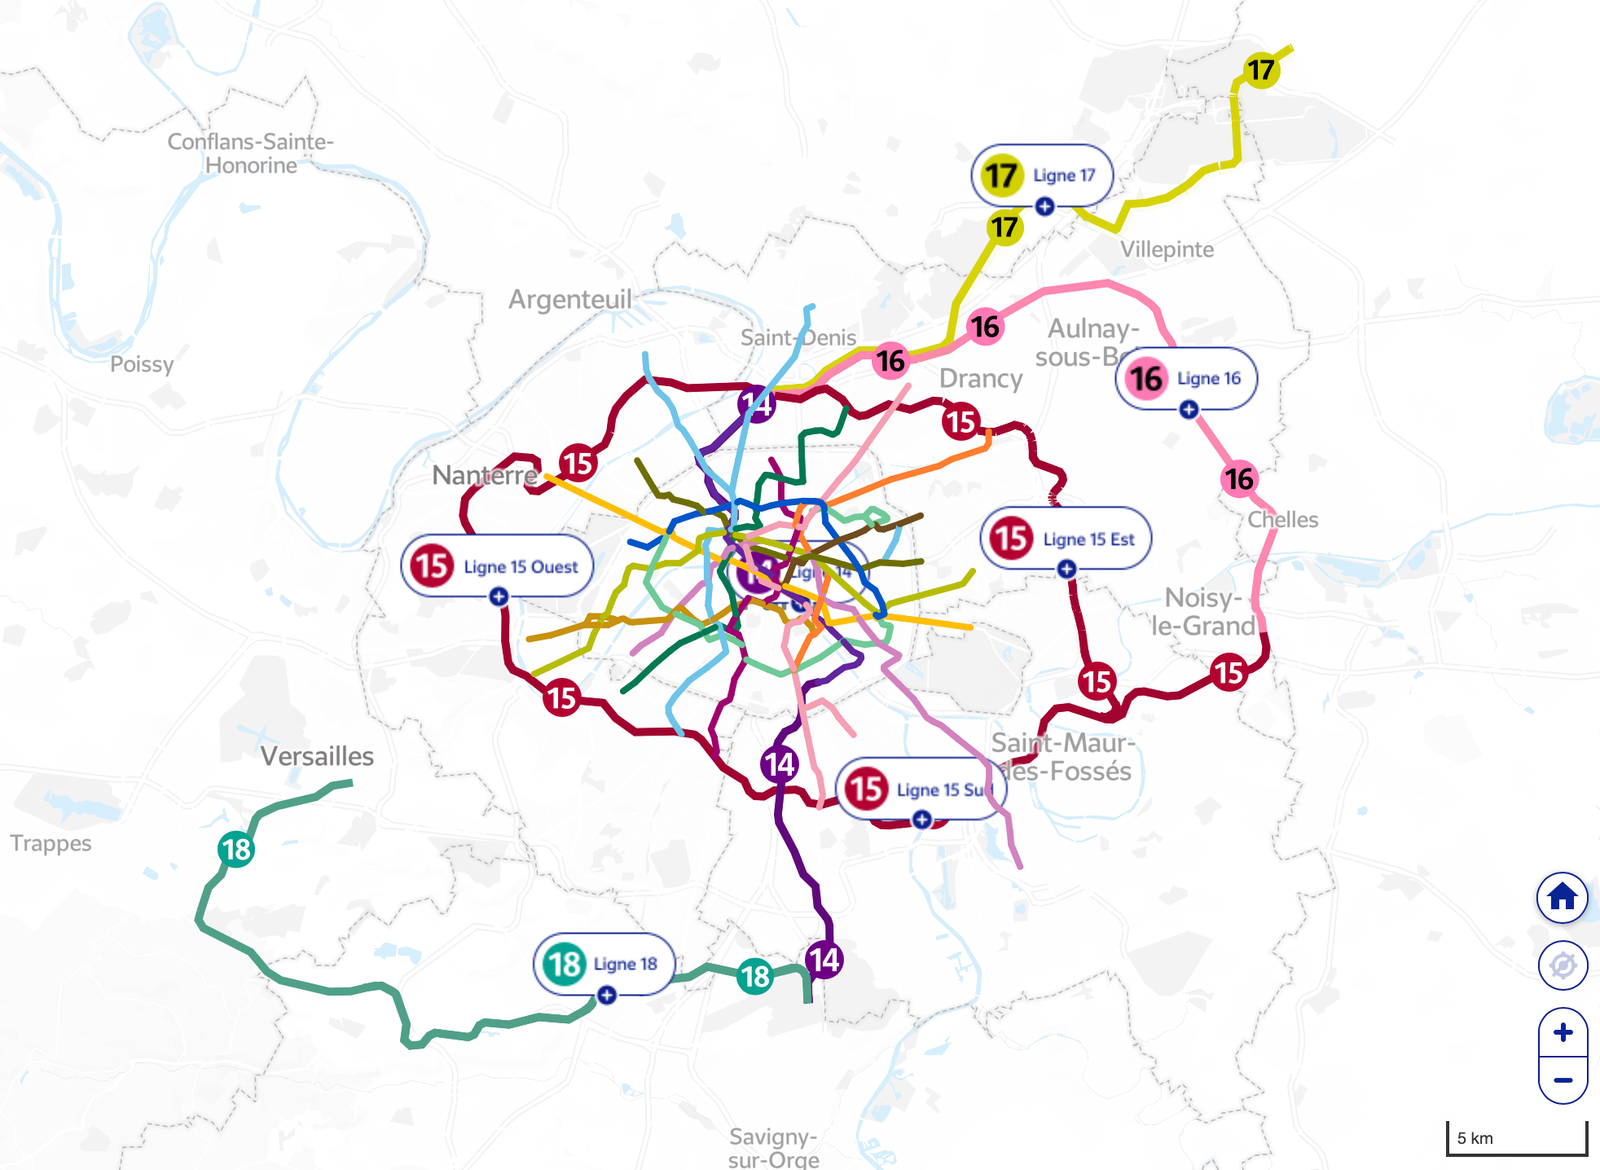
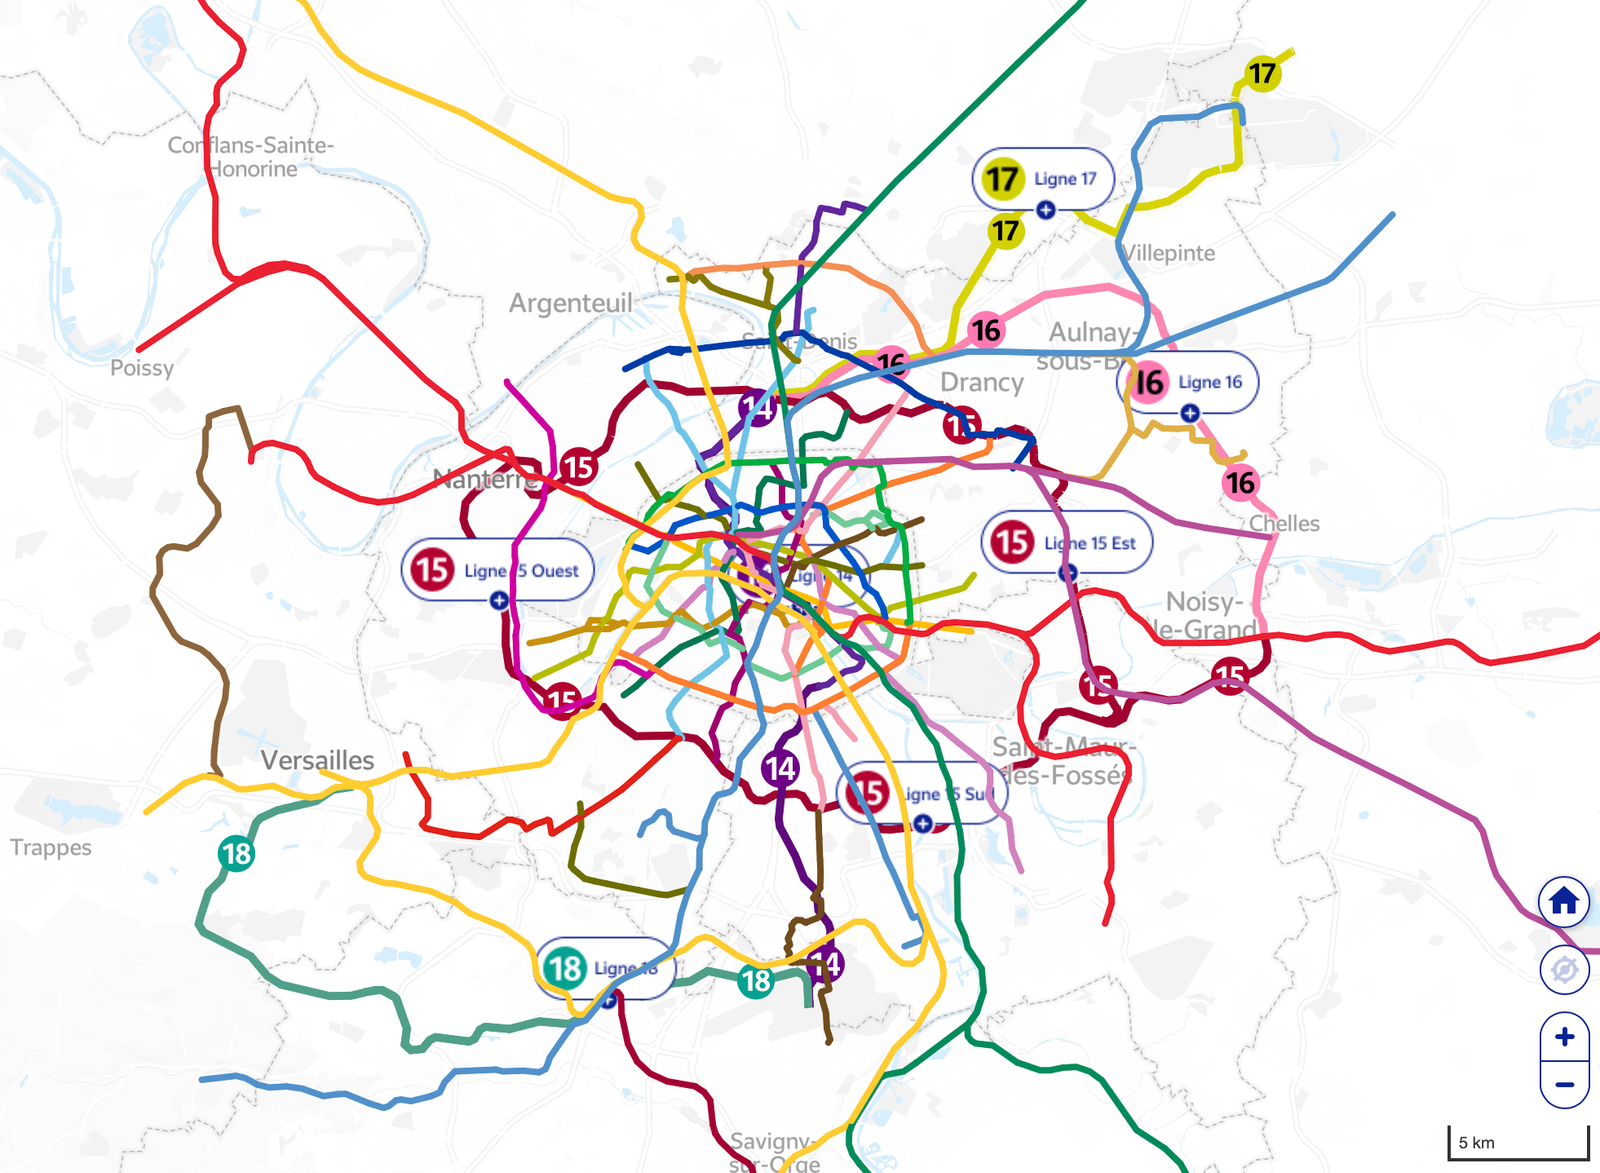
    Here’s the full map with all statuses shown:

    And here’s what it looks like if you filter by only projects under construction:

    It’s interesting, but not surprising, to note that the majority of construction projects seem to be taking place outside the boundaries of Paris proper. However, if you alternate to projects under renovation, it more or less flips, with most of the projects being within Paris:

    This tells you something about the city.

    Sometimes when I’m looking at or for information like this, I think to myself that I must be in the minority of people who are interested in tracking development projects with this level of detail. So I find it interesting that this map has been viewed nearly 300,000 times. Clearly, I’m not actually alone.

  • European office vacancy rates: La Défense vs. the Paris-CBD

    The first thing that stands out to me in this European office vacancy rate chart from Savills is the difference between Paris-La Défense (~15%) and Paris-CBD (2%).

    For those of you who maybe aren’t familiar, La Défense is the largest purpose-built business district in Europe. It houses upwards of 40 million square feet of office space and covers about 1,400 acres. It’s also more or less where Paris decided to allow and put tall buildings. Though, it is about 3 km west of the city limits.

    The Paris-CBD, on the other hand, is within the city limits and I’m assuming it refers to the quartier central des affaires (QCA). But regardless of the exact boundary definitions, what we are comparing here is a purpose-built business district to an older supply-constrained central one. And clearly there are, right now, meaningful differences in demand for the offices in these two areas.

    What’s also interesting is that there’s a meaningful difference in the rents. According to Reuters, office space in La Défense is on average about 50% cheaper than the QCA. This, to me, is a reminder that monofunctional urban areas tend to be less resilient over time. And that’s why La Défense is actively working to add additional uses, such as more residential.

    But it’s not just about uses. The area will also need to contend with the fact that it has a vastly different kind of built form; one that isn’t fine-grained and walkable like the QCA. This matters.

  • 10 years of radical change in Paris

    I know that many of you already know this, but it’s pretty remarkable what Paris has been able to achieve over the last 10 years:

    Paris has closed more than 100 streets to motor vehicles, tripled parking fees for SUVs, removed roughly 50,000 parking spots, and constructed more than 1,300 kilometers (800 miles) of bike lanes since Mayor Anne Hidalgo took office in 2014.

    The result is that, according to city officials, air pollution in the capital has declined by about 40% since 2011. And bicycle usage has increased by some 70% — this is since 2019.

    Now, Paris does happen to be blessed with a dense urban fabric. But that doesn’t necessarily mean that this transformation was simple or easy. The difference is will. Most Parisians seem to support these actions.

    So the next time you’re stuck in traffic and cursing some scapegoat, maybe consider what you would be willing to do to dramatically reduce traffic congestion. Would you be open to radical change in your city?

  • France’s rental ban on energy-inefficient homes

    One of the things that you’ll notice on real estate listings in France is an Energy Performance Diagnostics (EPD) rating. In French, it gets reversed, and so it’s a DPE (diagnostic de performance énergétique). What it tells you is how much energy the dwelling (or building) consumes and how much greenhouse gas it emits. And it is a requirement on all real estate listings and for all dwellings, except those that are occupied for less than 4 months per year. The output of this diagnostic is a rating from A (best) to G (worst).

    According to FT, this is how primary residences in France rank today:

    Less than 5% of homes are rated A and B (the most energy efficient). And many more are rated G and F. Beyond just being energy inefficient, this is potentially a problem because there are penalties and restrictions for the lowest rated homes, one of which is that you are not allowed to rent out the property. Right now and as of January 1 of this year, the upper consumption limit is 450 kWh per square meter per year. Go above this and the home becomes ineligible.

    This number is also planned to reduce over time:

    • January 1, 2023: Rental ban on properties with G+ energy label
    • January 1, 2025: Rental ban on all properties with G energy label
    • January 1, 2028: Rental ban on all properties with F energy label
    • January 1, 2034: Rental ban on all properties with E energy label

    Now here’s what this is thought to mean for overall rental supply:

    By 2028, 5.2mn homes rated F and G, or 17 per cent of total housing stock, will become ineligible for rental. By 2034, all E properties will also be excluded, amounting to about 40 per cent of homes.

    This raises an interesting question: Is it more important to have energy-efficient homes or to have greater overall supply? Now obviously the goal and ideal scenario is both; lots of affordable homes that are also energy efficient. And presumably, one of the objectives of this rental ban is to stick/carrot owners into investing in energy measures. But it’s not exactly obvious as to how many owners will be able to renovate their homes in time, and how many homes will become ineligible for rent. This will be an interesting policy to watch as it plays out.

  • CryptoParisian #112

    I have written about Bright Moments before. They are a digital art company exploring the intersection of NFTs and real-world experiences. It started as a popup gallery in Venice Beach California, where artists could show new work and where collectors could buy IRL. They then created their own pixel art collection called CryptoVenetians. It included 1,000 different people-centered NFTs by artist QianQian. Since then, they have gone on to host events and create new CryptoCitizen collections in New York, Berlin, London, Mexico City, Tokyo, and Buenos Aires. And this week they were in Paris.

    (I don’t know why they skipped over Toronto!)

    Their end goal is to create a complete collection of 10,000 NFTs, most of which are tied to a specific city. (The only one that isn’t is their CryptoGalacticans collection.) What’s obviously great about this approach is that it’s a way to promote digital art and onboard new users into the crypto space. They are literally going around the world, throwing parties, and saying “look how cool and fun this whole crypto thing is.” At the same time, it also links the digital and the physical, which I believe is fundamental. We’re social beings and web3 will never change that.

    The other interesting thing about Bright Moments is that they are structured as a decentralized autonomous organization (or DOA). That’s like a company, except that governance is distributed to its tokenholders and it’s all managed on a blockchain. But it still operates as a company and it can raise money like one too. In 2021, Union Square Ventures invested 500 ETH into the DOA through a blockchain transaction that would naturally be public if you cared to look it up. Based on today’s spot price of about CA$4k per ETH, that was a CA$2 million investment.

    In the case of Bright Moments, its tokenholders are the people who own a CryptoCitizen. These are the people who get to vote on how the organization is run. They can also earn money if they do things like host a community dinner or organize a local meetup, with the idea being that, as an organization, you want to encourage this sort of bottom-up participation and innovation. I find it fascinating to watch this new governance and entity structure emerge, and it will only continue to evolve.

    I’ve been following Bright Moments more or less since they dropped the CryptoVenetians. I thought about jumping in then, but I figured I would wait to see if there would be a CryptoTorontonian. That would obviously be my number one choice. But once they announced their final list of cities, and Toronto wasn’t on it, I grumpily decided I would instead wait for a CryptoParisian. And since this week was Paris, it was time.

    I now hold CryptoParisian #112:

    I like that it has the Pont Neuf and that the human is wearing sunglasses.

    This means that I now have a small ownership stake in the Bright Moments DOA. So presumably I’ll soon have a say in important and serious matters! It also means that when they launch their final CryptoCitizen collection in Venice, Italy this spring (nice work going full circle here), there is a chance I might get airdropped a CryptoVenetian. It’s a random process, so whatever. I also know that it’s easy to look at this pixelated Parisian and think, “WTF, Brandon.” But something new is building here. And I’m sure that all of the folks who were in Paris this week can testify to that.