
Early on in my career, I used to run development pro formas where I would assume that our costs would increase at some rate in and around inflation. Combined with a conservative contingency allowance, I used to think I was being prudent. How cute.
The pandemic made this approach seem silly. Our pro formas did not contemplate 40-50% cost increases for certain line items. But even without these outliers, the pandemic did cause things to become more expensive than one would have expected from pre-pandemic trends. Here’s a recent chart via the Bank of Canada:
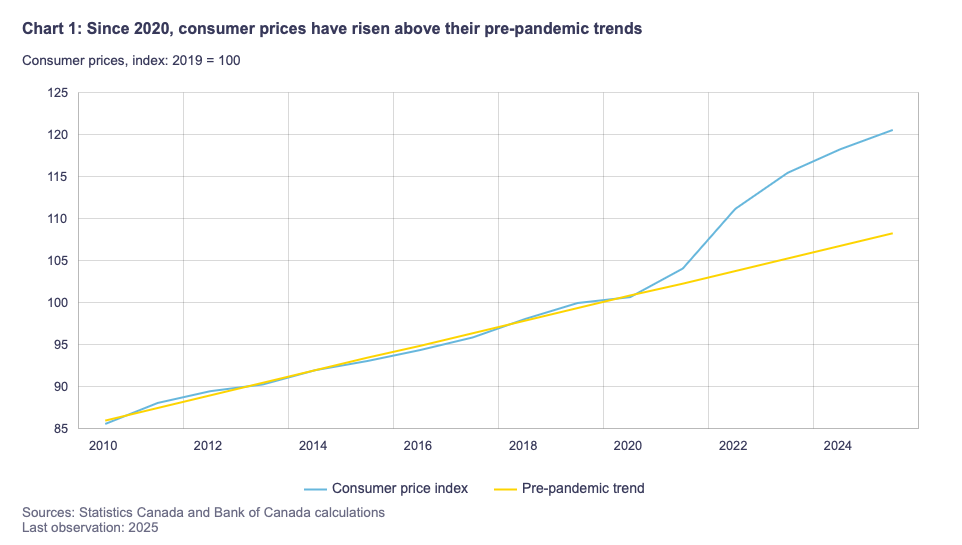
But the cost of things is only one side of the equation. For things to be “more expensive,” we also need to look at their relationship to income, and that’s what Yaz Terajima has done here. Interestingly enough, household disposable income seems to have kept pace with the additional cost of things, at least on average.
Between 2020-25, the average household spent about $6,500 more per year relative to pre-pandemic trends, but disposable income increased by about $7,400, creating a positive income-expense gap of about $900.
So why, then, does it feel like things are more expensive? Well, for one thing, there is a meaningful difference across age groups and income levels. Yaz also found that younger and lower-income households did not, in fact, see their incomes rise sufficiently to cover these higher costs.
On top of this, this study does not factor increases in overall wealth due to assets appreciating, which tend to be more concentrated among wealthier households. So the full-picture reality is almost certainly a bigger socioeconomic divide across age groups and income levels.
Leave a Reply