Daily insights for city builders, delivered every morning at 6 AM ET. I’m Brandon Donnelly — a Toronto-based real estate developer and founder of Globizen. I’ve been writing here since 2013.
The Coalition Against New-Home Taxes (or CANT) is a group of home builders, led by Matt Young of Republic Developments, who are asking all levels of government in Canada to lower the taxes on new homes. In some cities, these taxes — which include everything from development charges to HST — can account for up to 30% of the cost of a new home. This is bad for housing affordability and runs counter to our publicly stated goals. So to drive this point home, the group created a cheeky game called Taxopoly: The Unwinnable Game of Canadian Homeownership. (Credit to Blackjet for the idea and design.) I don’t think that the average buyer understands what kind of taxes are being levied on new homes, and so kudos to CANT for being a loud advocate for positive change. To learn more, sign their pledge, and/or email your representative, here’s their website.
I had a call with a developer in Paris earlier this week and it was interesting to hear him talk about the new home market over there. It sounded a lot like Toronto. Higher interest rates cooled demand. Individual investors largely disappeared. And now developers are having to rethink their strategies and floor plans (including suite sizes).
But in his view, this isn’t necessarily a bad thing. It now means that you actually have to be a reasonably good developer in order to have a chance at succeeding. You have to design thoughtful floor plans and build great housing. It’s a return to fundamentals, and I would argue that the same thing is happening here in Toronto.
My other noteworthy takeaway was around social housing. All new developments in the Île-de-France region are subject to inclusionary zoning. I believe the requirement is 30% of the suites. These suites are then purchased by social housing operators, and it is one of the ways that new supply is created in the market.
We talk a lot about IZ on this blog, but what’s interesting about this approach is that it becomes a forward sale for the developer. Meaning, it helps to de-risk projects. Before doing anything, you know you’ve sold 30% of your inventory, and somehow the numbers all work. European social housing math is baffling to me.
I am now wondering if this creates some kind of incentive to keep development costs in check. Because if social housing operators are expected to buy 30% of all new homes, then they too are going to want them to be as cost effective as possible. I’m speculating though; I don’t know that this is the case.
If you’re a developer or real estate person in Paris, please get in touch. I’d love to learn more about your market and trade notes.
As counterintuitive as it may sound, one way you could try and improve traffic congestion is to discourage people from riding their bikes and instead encourage them to drive more. That’s what’s happening in Toronto right now. Another way is to dramatically restrict car usage. And starting this Monday, that’s what Paris will be doing with its new limited traffic zone (zone à trafic limité) in the center of the city:
This new ZTL is approximately 5 square kilometers. About 100,000 people live within its boundaries, and it is estimated that somewhere between 350,000 to 500,000 vehicles enter it each day. But according to the city, it is estimated that only around 30% of these trips are absolutely necessary (because of a lack of alternatives, for example). The purpose of the ZTL is to reduce the unnecessary ones.
The way it will work is that drivers will no longer be allowed to drive through this zone. You’ll only be able to enter if you plan on stopping for a legitimate reason. It’s not yet clear what this exact list of approved reasons will be, but the general idea is that if you want to drive in for dinner or to attend a meeting, that’s fine. What you can’t do, though, is just drive around in a souped-up Honda Civic blasting Taylor Swift.
The next 6 months are planned to be a period of education. Drivers exiting the zone are just going to be told that there’s this new ZTL and that they better have stopped somewhere. But eventually there will be a 135 euro fine and eventually drivers will be expected to furnish some sort of supporting evidence for their stop, such as a restaurant receipt. There’s also talk of adding automatic cameras.
Of course, this creates a lot of gray areas. What about if you’re just going over to a friend’s place for dinner? Will they then need to write you a note saying that you went over for some homemade bouillabaisse? Yeah, I don’t know the answer to this. But you have to admit that this is a bold city-building move, and a far more effective way of improving traffic flows.
Unlike removing bike lanes, this plan will actually work.
Yesterday, the City of Toronto announced that it would be “unlocking” 7,000 new rental homes — including 1,400 deeply affordable homes — by doing two key things:
Waiving development charges on rentals
Providing a 15% reduction on property taxes
And by their estimates, the value of these benefits would be roughly $58k per new rental home:
Great news, right?
But wait, there’s a catch. If you read the details, you’ll see that in order for a project to be approved under this program, there is also a requirement to deliver at least 20% of the homes as affordable rentals.
So let’s look at what this could mean.
Here is a chart comparing a market rental suite at $3,000 per month to a more affordable one at $1,500 per month:
Market
Affordable
Variance
Face Rent
$3,000
$1,500
($1,500)
Suite Size
$600
600
0
PSF Rent
$5.00
$2.50
($3)
Annual PSF Rent
$60
$30
($30)
NOI Margin
70%
70%
$0
Annual Net Rent
$42
$21
($21)
Cap Rate
4.50%
4.50%
$0
PSF Value
$933
$467
($467)
Per Unit Impact
($280,000)
20% of Units
($56,000)
Both are assumed to be 600 square feet. In the case of the market suite, the per square foot (PSF) value is estimated at $933 psf, and the affordable suite is estimated at $467 psf. This represents a halving of the value (which makes sense because I halved the rents).
On a per unit basis (again, we’re assuming 600 sf), this is a loss in value of about $280k. But since only 20% of the units would need to be “affordable”, I multiplied this number by 0.2. The result is a per unit loss of approximately $56k.
What this means is that we’re basically doing a whole bunch of stuff to get right back to the same place. Like, hey, we’re not building enough rental housing and we’re certainly not building enough affordable housing — because the development margins are so dangerously thin — so here’s a credit of $58k per unit. But at the same time, here’s a bill for $56k per unit.
What’s the point, besides making it sound like we’re doing something to create more housing? This program will do absolutely nothing to spur the creation of new rental housing.
The train from Paris to Marseille takes just over 3 hours:
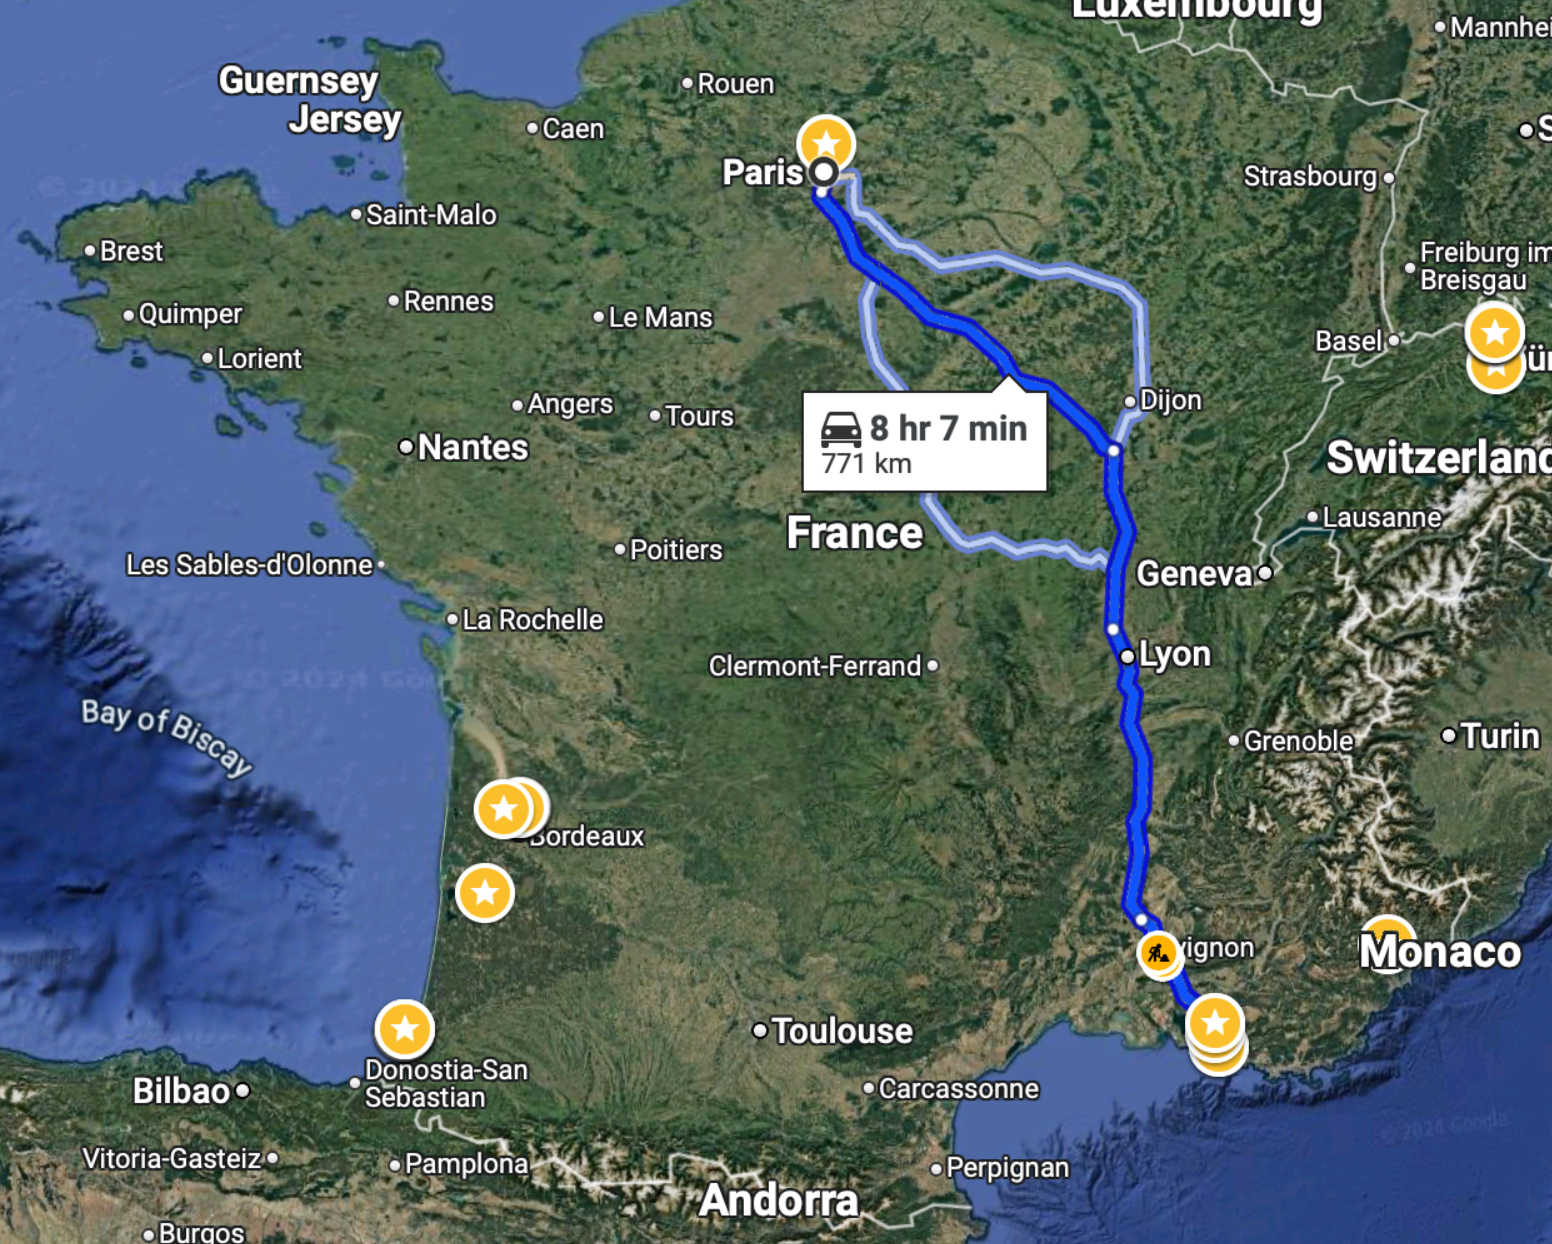
To drive this same distance, it would take just over 8 hours:
So unless you had a very specific reason, I don’t know why you’d ever want to drive this route. I certainly hate long drives and would avoid this at all costs.
On a related note, the Canadian government announced this week that it will actually be moving forward with a high-speed train linking Québec City to Toronto, stopping in Peterborough, Ottawa, Montréal, Trois-Rivières, and Laval. And unlike previous announcements, it will actually go pretty fast — upwards of 300 km/h, which is comparable to what the TGV does on the above route.
There are three consortia currently competing for this contract, but apparently the federal government has already chosen a winning bidder. An announcement is expected next month. At the same time, the project office owns all of the bids, and so there’s a chance that elements from each of them could be used in the final project.
According to official messaging, the design alone is expected to take some 4 to 5 years, which is an eternity and way too long. But at least we seem to be moving forward. This rail link is a no brainer. It will compress the geography of an importantly bilingual corridor with nearly 20 million people — about half the population of Canada! It’s our megalopolis.
Now we just need to move forward with urgency and with an unwavering commitment to creating the best high-speed rail service in the world. Let’s not accept mediocrity. And let’s not cancel it once we’ve already sunk millions into it. That would be a terrible outcome for such an obviously important nation-building project.
The divisive debate over bikes lanes in Toronto continues to remind me that we need far better urban data. People and politicians keep touting “evidence-based decisions,” but what exactly is that evidence? The high-level figure being thrown around by the anti-cycling side is that only something like 1% of residents use bike lanes. So obviously it only makes sense to focus on the 99% and not give up any space to this small minority group.
But this is highly aggregated data. It also doesn’t speak to any of the externalities associated with introducing new bike infrastructure. Looking at 2021 Census data, the number of cyclists was actually around 5% for the old City of Toronto and in some areas it was between 15-20%. However, it’s absolutely critical to note that this is only the people who selected cycling as their “primary mode of commuting” when submitting their responses to the last census.
Meaning, it excludes people who maybe only cycle 1-2 days a week, or who ride for leisure and/or for exercise, or who ride to their French class in the evenings (like me). I would also assume that these numbers have generally grown since 2021 given the overall investments that have been made in biking infrastructure. So overall, this is weak data. It’s a few years old. And it excludes many types of users. We need to get more granular.
Like, it’s great to see local business owners speaking out about the benefits that they have seen as a result of the Bloor bike lanes, but in the end, this is also anecdotal. We need real-time data, precise modal splits, the throughput of every major street, and much more. Then maybe we’ll be able to better optimize around the fact that we are a city divided by built form and by politics. That’s the thing about evidence-based decisions, they tend to get stronger with accurate evidence.
I had lunch today with a friend (from school) who runs a multifamily development company in South Florida. His business is very similar to the apartment strategy that we are now working on in Toronto, in that he builds a repeatable apartment product (garden style apartments). In fact, he was telling me that he now has a dedicated design & QA/QC team within the company. Their job is to focus on continuous optimization and on reducing construction inefficiencies.
This is the way!
But each market is obviously unique. His rents are in the US$3 – 3.25 psf range (call it ~C$4.15 – 4.50 psf), whereas in Toronto you need something closer to C$5 psf to have a feasible project. Our yields are also lower on average. It’s hard work to get to an untrended yield-to-cost of 5% here. But for him, he can’t raise capital with anything less than 6.5%, which represents a development spread of at least 150 bps over where multifamily cap rates are today in his market (~5%).
Let’s check in on office utilization (in Toronto). The last time we talked about this was in April. At that time, the average weekly utilization figure was 63%. The peak day — Wednesday — was 73%. And the low day — Friday — was 40%. Today, well as of September 15, these numbers are now 69%, 79%, and 39%, respectively (see above chart). So we continue to climb. The only slight downward trend is Fridays. People don’t like coming into the office on Fridays. Still, the average is up 6% over the span of about 6 months. This makes you continue to wonder: When does this level off? I also don’t know what this index looked like before 2020. Are we back, or not yet?
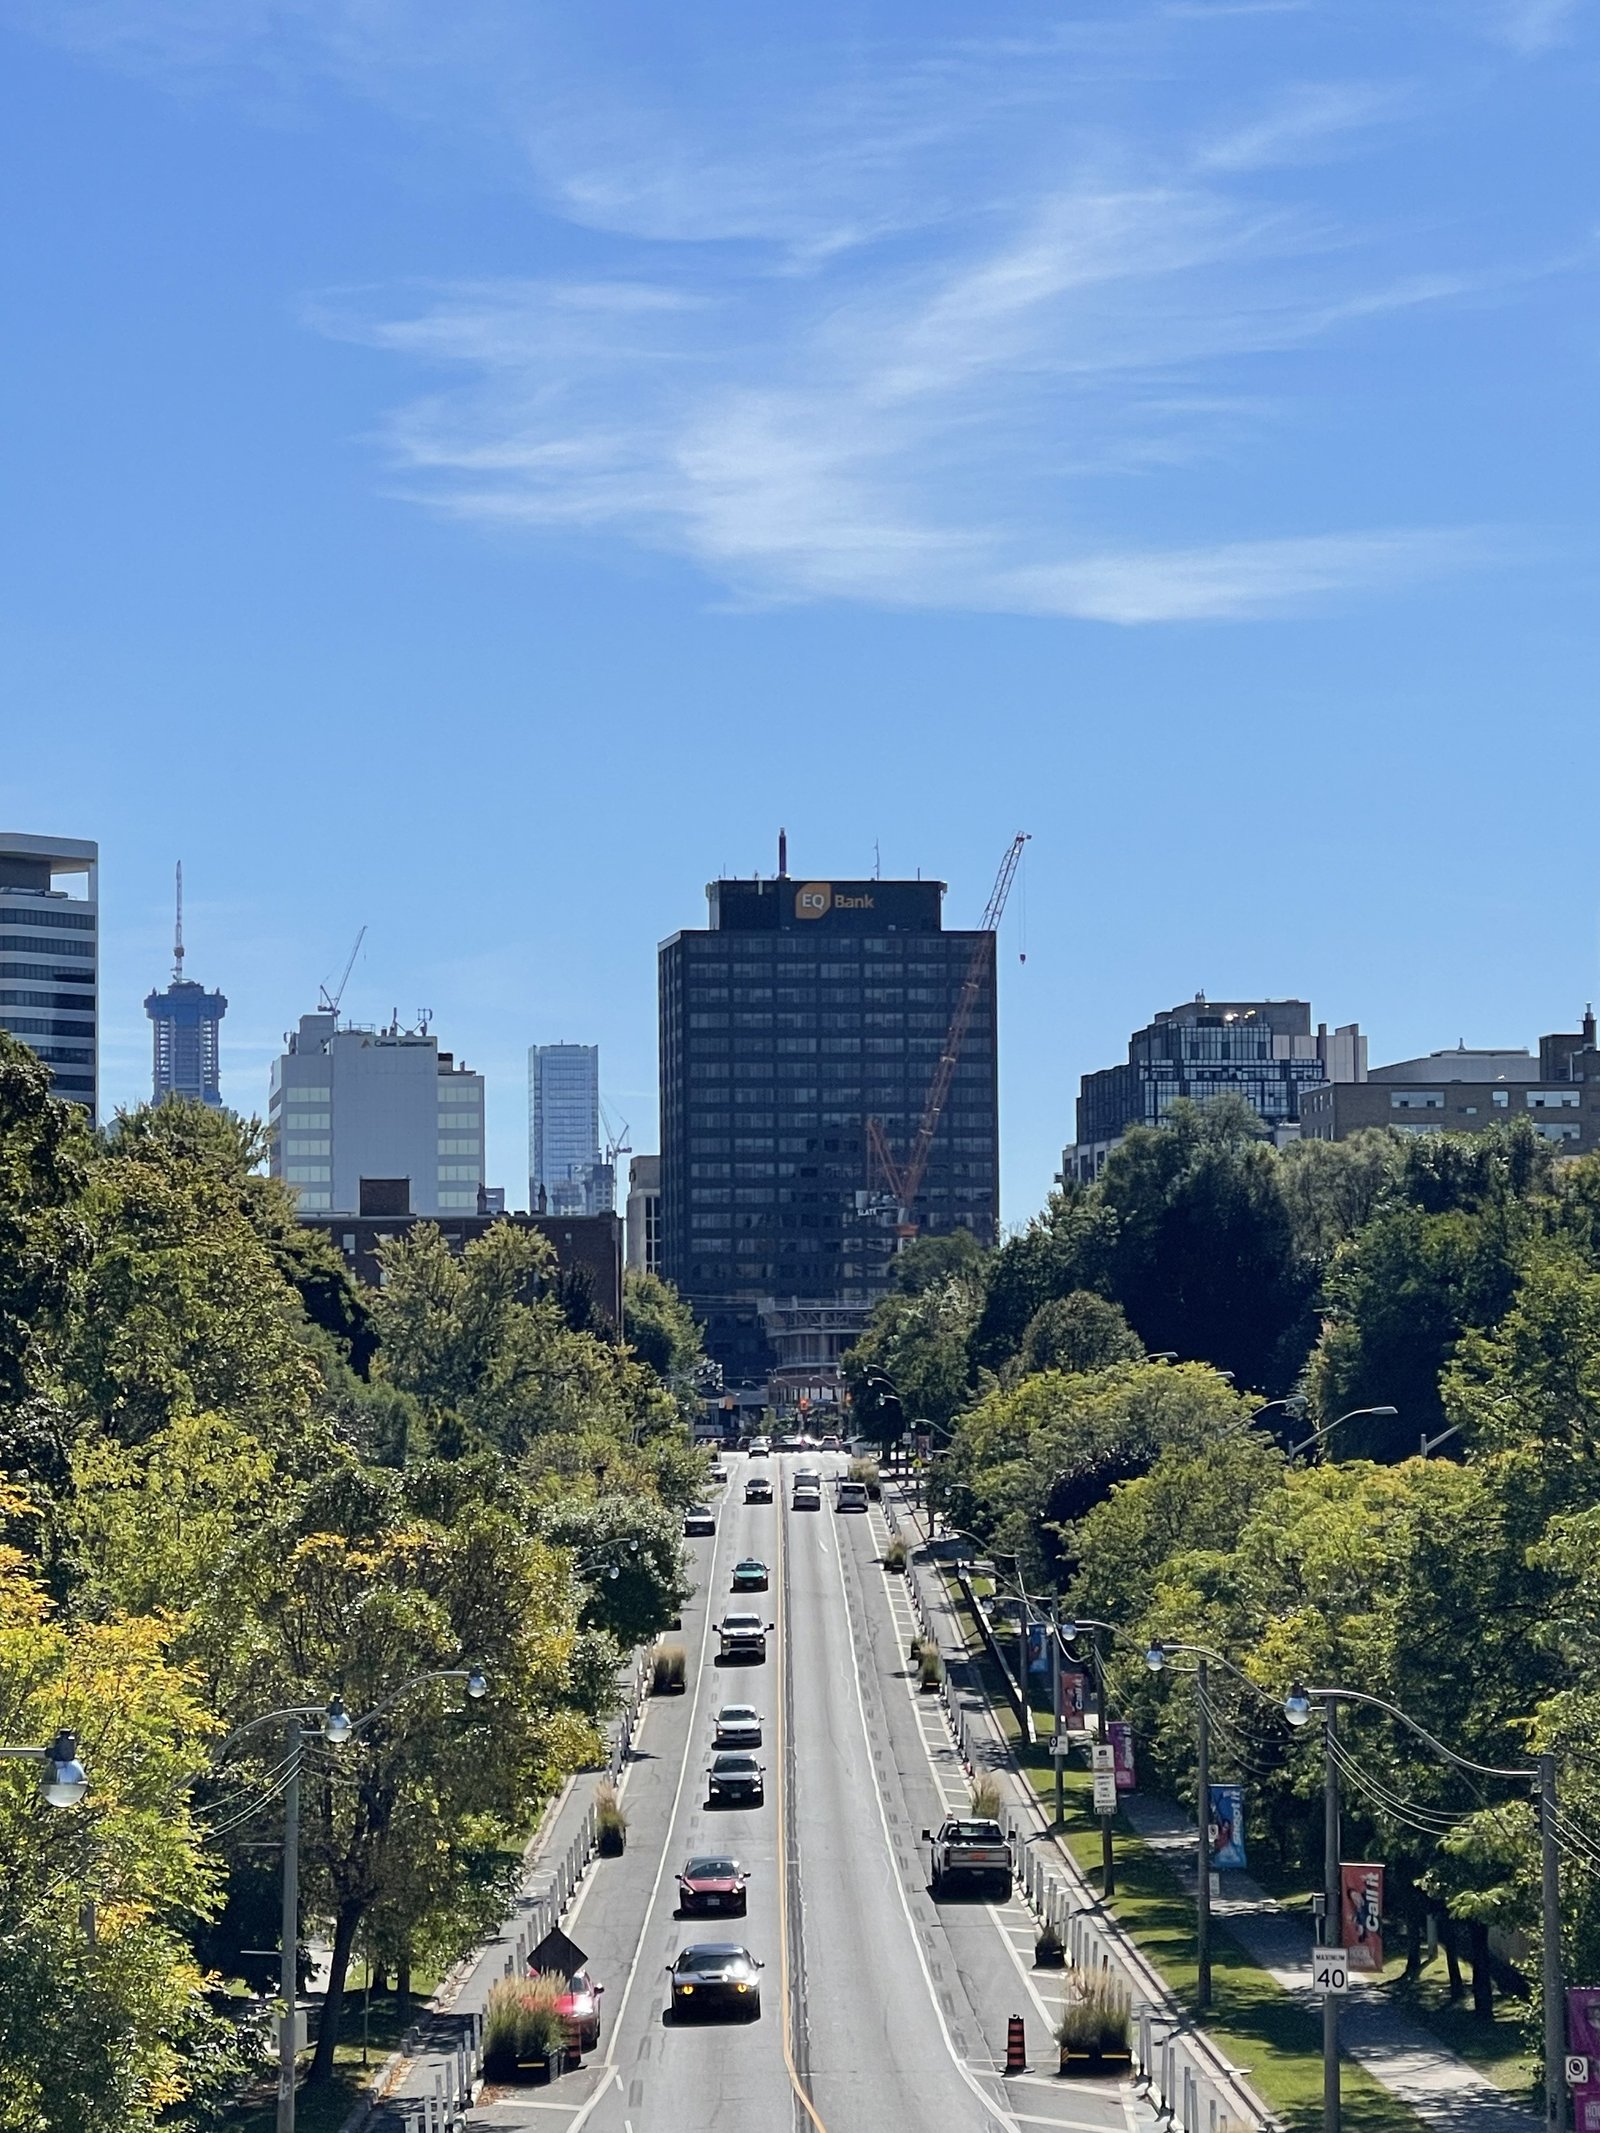
“Complete streets” are streets that are designed to be safe for all users: people who walk, bicycle, take transit or drive, and people of varying ages and levels of ability. They also consider other uses like sidewalk cafés, street furniture, street trees, utilities, and stormwater management.
Right now, the city is in the public consultation phase. If you’d like to provide your feedback, you can do that here. You have until October 30th. The online tool is also pretty neat. You can drop comments on specific areas of the street. And already the map has been totally filled up.
This is an important and busy artery in midtown. I use it all the time as a pedestrian, cyclist, and driver. It’s not the best street, though. Yesterday it took me 45 minutes to drive from one end of it to the other. Along with better street design, this part of the city could use better transit.
I’m looking forward to seeing how Dupont ultimately gets designed.
On Saturday, I went on a bike ride all around Toronto. We cut across midtown (checking in on One Delisle), stopped at the Chester Hill Lookout (which if you grew up in the east end is where you probably went as a teenager to make out), shot down the Don Valley, and then turned west along the waterfront. The weather was perfect.
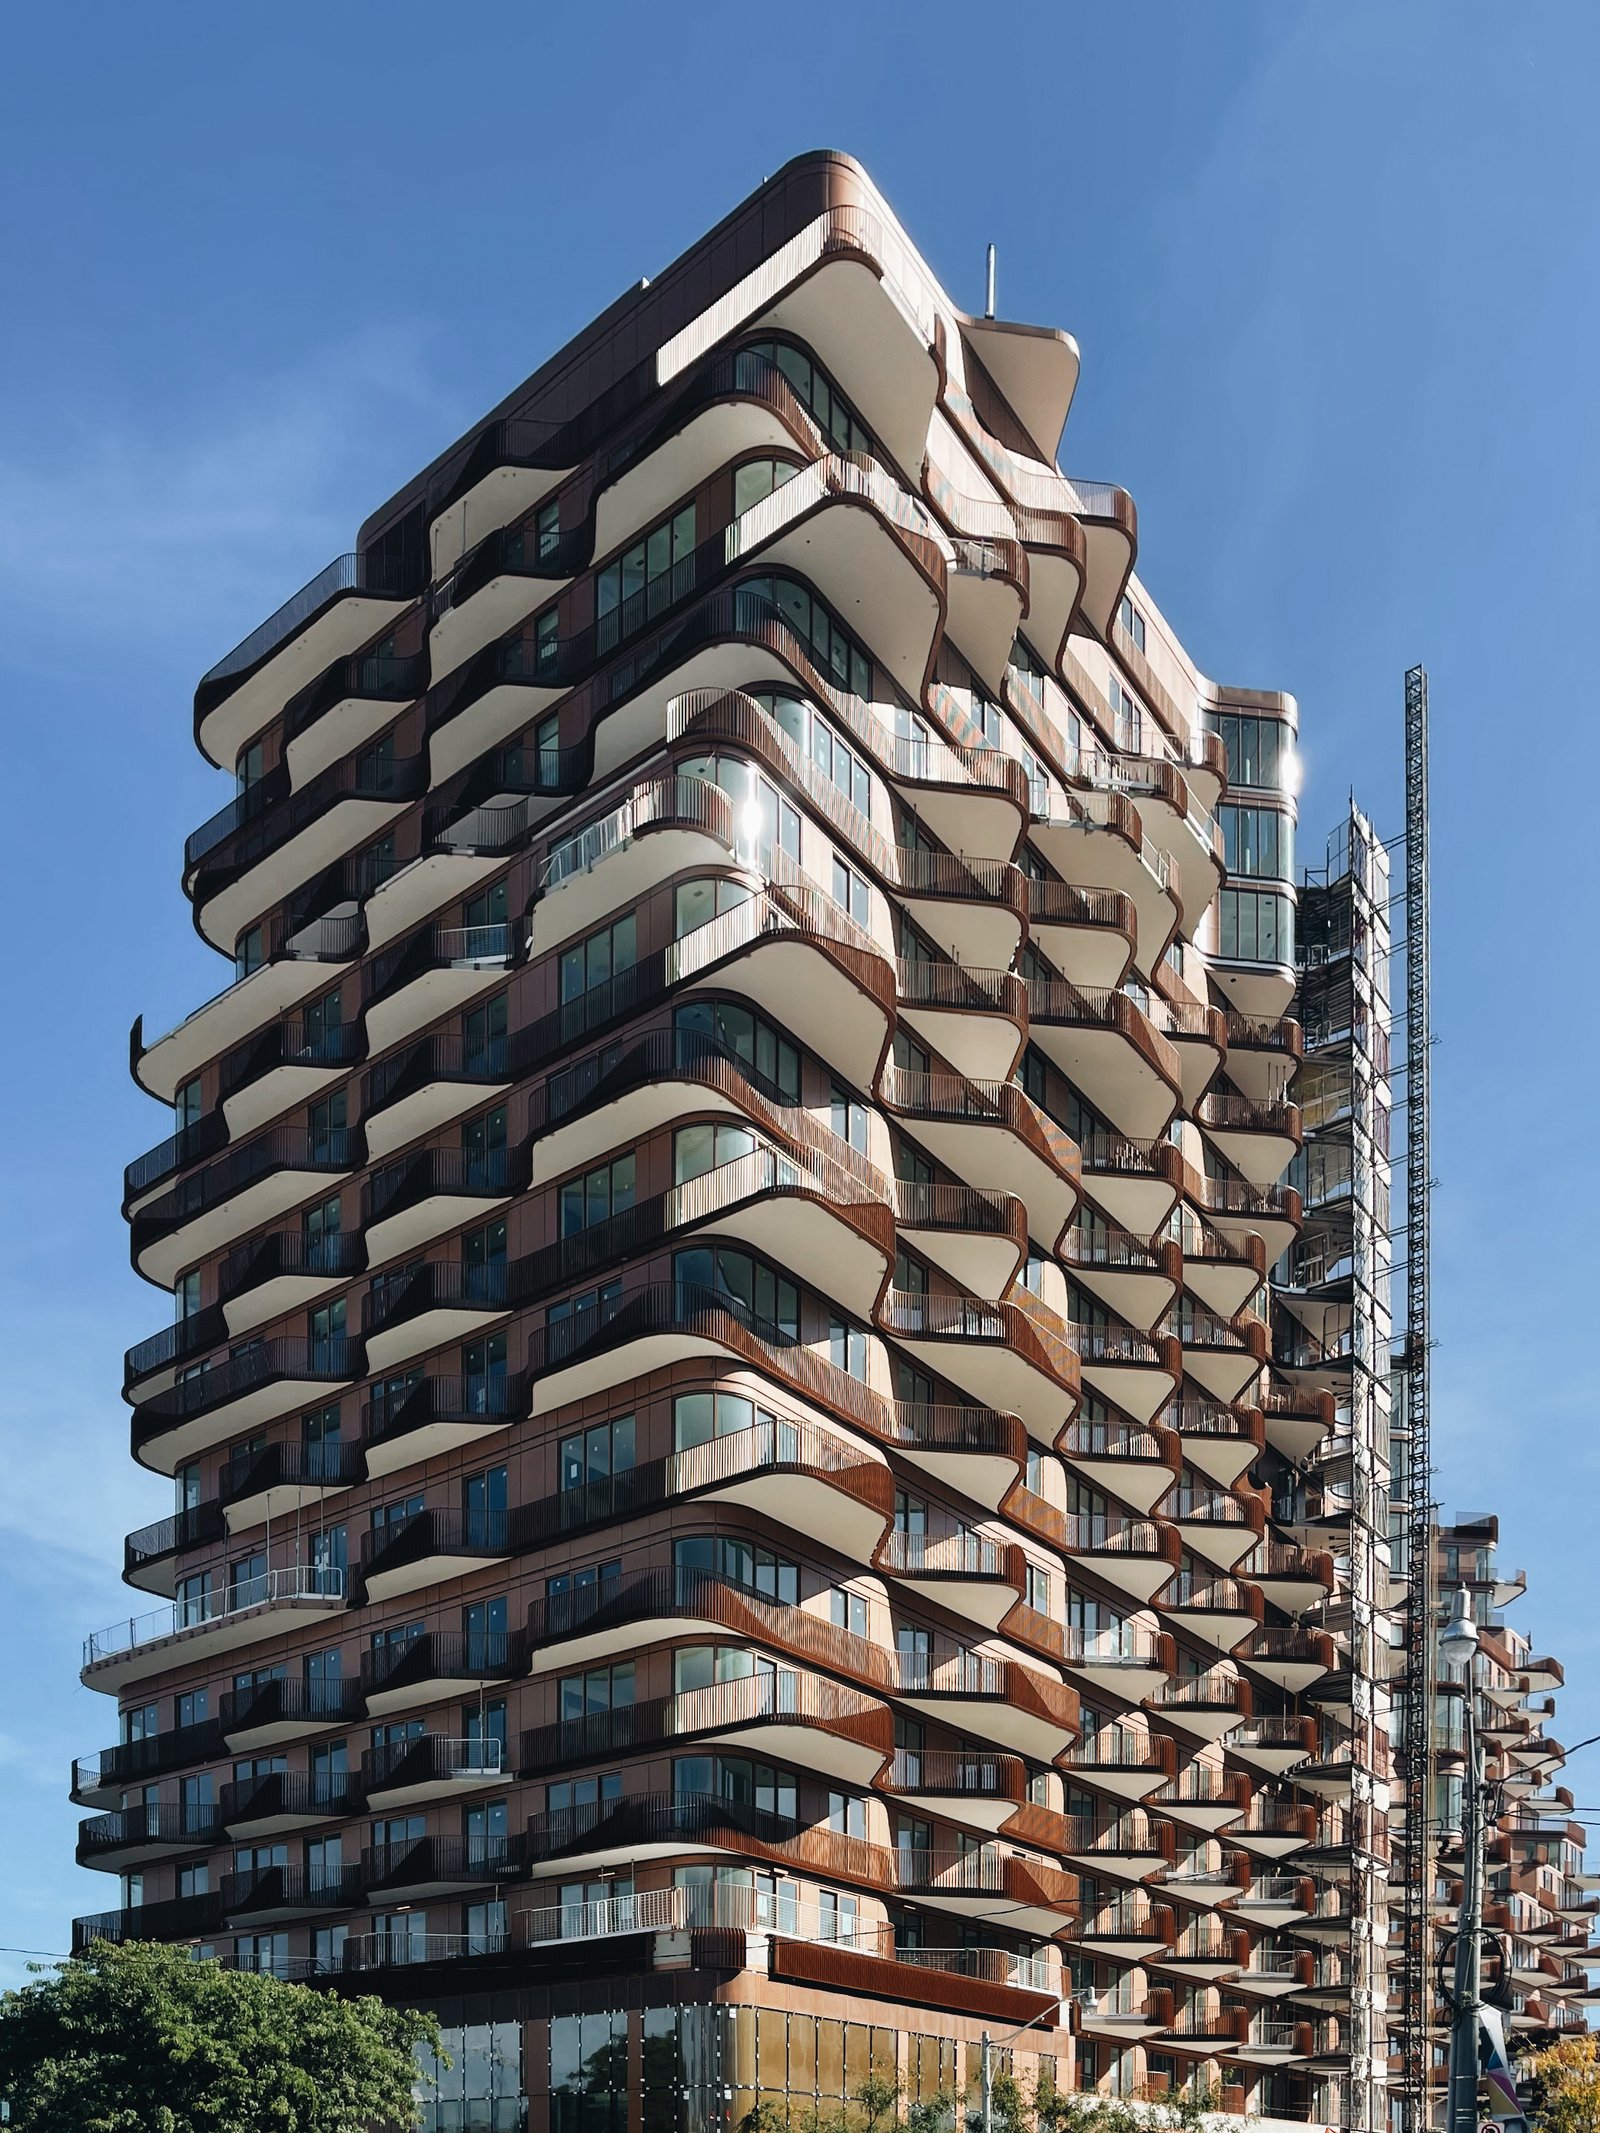
As we were going along the waterfront, we passed the new Aqualuna building that is under construction on Queens Quay East, near Parliament Street. Being the architecture nerd that I am, I immediately noticed that as you pass by — at the speed of a bike — the balconies create this really nice cinematic effect.
So I stopped to take these photos (I probably should have taken a video now that I think of it):
I then tweeted a tweet calling it one of the most beautiful buildings going up in Toronto today. Judging from the responses, most people seem to be in agreement, but a few people questioned the practicality of balconies like this. Namely how private and usable they will be. I don’t disagree, but I still think it’s fine looking building.