Daily insights for city builders, delivered every morning at 6 AM ET. I’m Brandon Donnelly — a Toronto-based real estate developer and founder of Globizen. I’ve been writing here since 2013.

Tag: new york times

  • What it’s like to live in darkness

    The New York Times recently asked its readers – specifically the ones who live near or above the article circle – what it is like to live in darkness for part of the year. 

    Almost 700 people responded with photos and stories, both of which can be found here. The photos are absolutely spectacular. Make sure you watch the video.

    I love snow and I love being in the mountains, but I can only imagine what it must be like to live for months with no (or minimal) light. It must do a number on your mental state.

    At the same time, there is something so sublime and beautiful about these places. I can’t say I’m ready to move, but I would like to experience it one day.

  • It doesn’t matter what Bitcoin is trading at right now

    Steven Johnson has a terrific piece in New York Times Magazine called: Beyond the Bitcoin Bubble. Here is a snippet:

    The only blockchain project that has crossed over into mainstream recognition so far is Bitcoin, which is in the middle of a speculative bubble that makes the 1990s internet I.P.O. frenzy look like a neighborhood garage sale. 

    But the point of the article, as its title suggests, is to talk about what all of this craziness could mean for the future of the internet and how, in some ways, it could be a return to what the internet was always intended to be.

    The real promise of these new technologies, many of their evangelists believe, lies not in displacing our currencies but in replacing much of what we now think of as the internet, while at the same time returning the online world to a more decentralized and egalitarian system. If you believe the evangelists, the blockchain is the future. But it is also a way of getting back to the internet’s roots.

    Some are calling this new, decentralized internet version 3.0. We are currently living with internet 2.0. Practically speaking though, what could this shift really mean for us?

    One example that is given in the article has to do with urban mobility – a topic that is particularly relevant to this audience. 

    Internet 2.0 has created a winner-take-most economic model. And in the case of mobility – at least in the world of apps – that winner is Uber. But with internet 3.0 and the blockchain, this could be possible:

    Just as GPS gave us a way of discovering and sharing our location, this new protocol would define a simple request: I am here and would like to go there. A distributed ledger might record all its users’ past trips, credit cards, favorite locations — all the metadata that services like Uber or Amazon use to encourage lock-in. Call it, for the sake of argument, the Transit protocol. The standards for sending a Transit request out onto the internet would be entirely open; anyone who wanted to build an app to respond to that request would be free to do so.

    Cities could build Transit apps that allowed taxi drivers to field requests. But so could bike-share collectives, or rickshaw drivers.

    I don’t know about you, but I find this perspective a lot more interesting. I recommend you read Steven’s article. It will help you cut through a lot of the Bitcoin noise.


  • The worst on-time performance of any major transit system in the world

    I was recently with some New Yorkers and we got on to the topic of their subway system. I made a comment about how extensive their network is and how their express trains work so well for traveling further distances. 

    They responded by basically saying: “Yeah, it’s great, when it works.” They then went on to tell me that most of the time they just use Uber to get around the city because the subway has become so unreliable.

    Admittedly, I don’t use the NYC subway system enough to comment on its declining performance. But this recent New York Times article describes it as an utterly failing system.

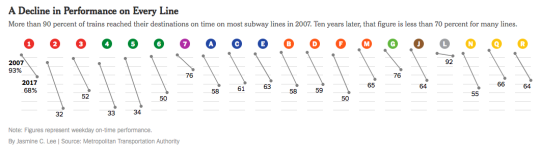
    Here is a diagram from the article that shows performance on every line (2007 to 2017), measured as a percentage of trains that reach their destinations on time (i.e. less than 5 minutes late):

    image

    In 2007, more than 90% of trains reached their destinations on time. Today, the weekday average is around 65% and some of the lines are in the 30s. This is the worst it has been since the 1970s when NYC was almost bankrupt.

    Apparently this also awards NYC’s subway the title of the worst on-time performance out of the world’s top 20 biggest systems.

    I suppose one of the lessons here is that subway lines on a map will always be far sexier than the nuts and bolts of maintenance, performance, and ridership. But we can’t forget the nuts and bolts. Maybe those are the most important parts.

  • 738,000 single-family homes were built last year in the US

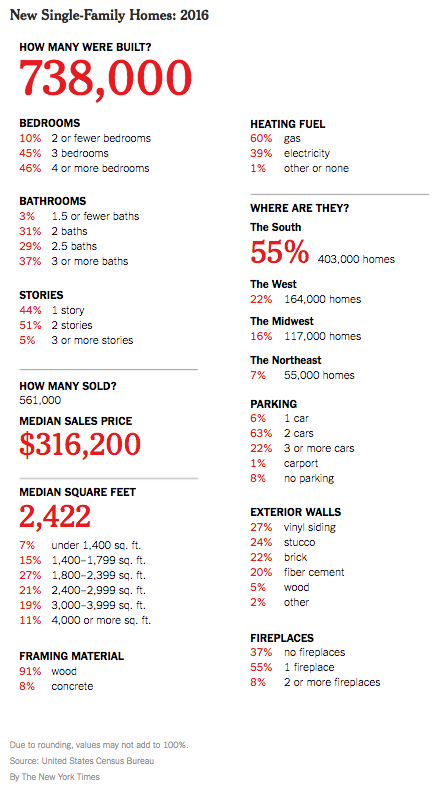
    The New York Times recently published “a portrait of new single-family homes” in the US in 2016. Here’s that portrait:

    For those of those living in dense urban centers, this portrait is perhaps a reminder that in many other places a large single-family home can be had for about the price of a studio apartment.

    Nothing in the above portrait likely surprised you, but it’s interesting to note that over half of all new single family homes delivered last year were in “The South.” Only 7% were built in the dense northeast.

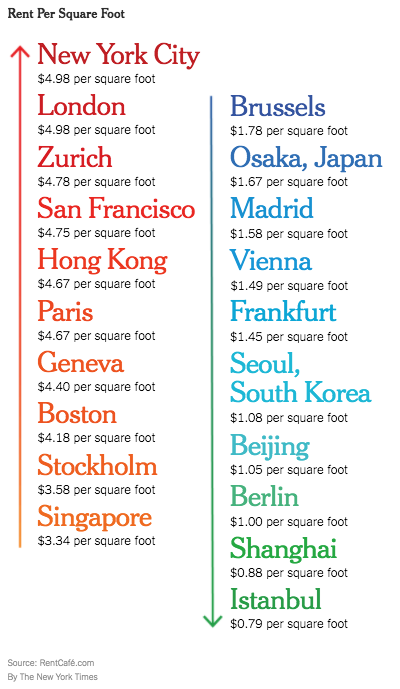
    The New York Times also recently looked at “international rents per square foot” using data from RentCafe. Here they are:

    New York City sits at the top with an average rent of $4.98 psf. This is across all boroughs. I am surprised by how low some of these international rents are. But averages rarely tell you the whole story.

    In any event, I do think that these two graphics start to speak to the economic spikiness that we are seeing across the US. 

  • Winner take all, or most, economy

    The world is increasingly spiky. Inequality is growing and it is increasingly geographic in nature. We know that people tend to make more money in urban areas compared to rural areas – even when they possess the exact same level of education. The returns to being smart and educated are simply greater in cities.

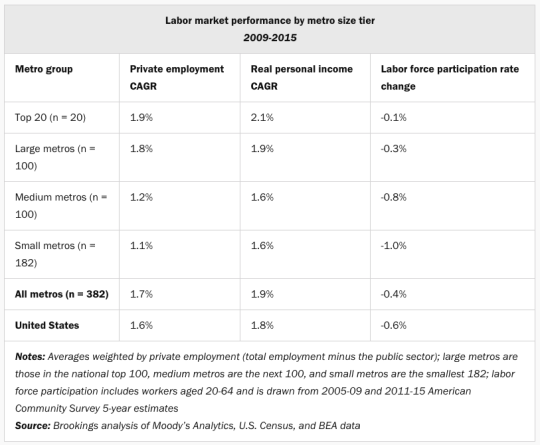
    But they also depend on the size of the city. Mark Muro and Jacob Whiton of Brookings recently published data looking at labor market performance – by metro size – from 2009-2015 (right after the financial crisis). What they found is that larger metropolitan areas simply performed better than smaller ones.

    image

    In summary:

    City size matters because it’s a major influence on city prosperity and adaptability as well as local worker fortunes. Bigger cities are more productive. They are more innovative. They draw better-educated workers by offering higher wages.

    The situation is even more pronounced across the pond. According to the New York Times (quote from Richard Florida), a third of Britain’s gross domestic product comes from London alone.

    What is far less clear is what should be done to address the decline of some of the smaller cities in America – cities that are stagnating and feeling left behind. But perhaps the first step is acknowledging what has happened and what remains feasible in today’s global economy.

    Here is another quote from the above NY Times article:

    Mr. Trump’s promise to relieve the pain by reviving the coal and steel industries, by keeping immigrants out of the country and by raising barriers against manufactured imports is only a rhetorical balm to satisfy an angry base seeking to reclaim a prosperous past that is no longer available.

    That rhetorical balm.

  • A generation of architects

    The New York Times just published a piece called “a generation of architects making its mark at dizzying speed.” It’s a current list, albeit not an exhaustive one, of notable architects and their projects. 

    Included on this list is One Spadina, home of the Daniels Faculty of Architecture, Landscape, and Design at the University of Toronto, which was designed by Nader Tehrani and the Boston practice NADAAA.

    Some of the best architecture in the city is being built on this campus.

    One thing you’ll notice about this summary of architects is the emphasis on age. Architecture is a slow process. This is true for buildings in general. So historically it has been the case that architects usually don’t hit their stride until later in their career.

    The youngest architect on the list is Bjarke Ingels at 42. An outlier for sure. He saw tremendous success in his 30s, and even in his 20s with the firm PLOT. I think great storytelling had a lot to do with this.

    Tehrani is 53. And the author rightly points out that Frank Gehry didn’t become Frank Gehry until he renovated his own house at the age of 48.

  • E-commerce jobs are clustering in larger cities

    image

    The New York Times just ran an interesting piece on “how the growth of e-commerce is shifting retail jobs.”

    Here are some of the key takeaways (all US data).

    Online shopping accounts for about 8.4% of all retail sales.

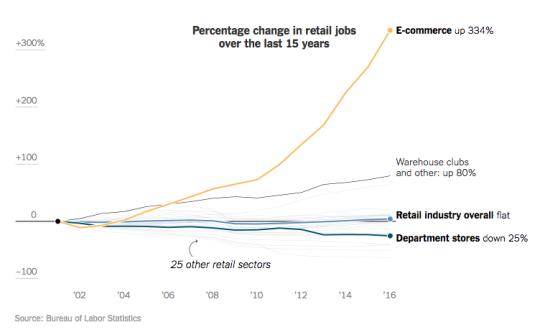
    But e-commerce related jobs are growing way faster than all other forms of retail employment. See above graph.

    That said, e-commerce jobs are still a small portion of overall retail employment. And the rise in e-commerce employment has not been enough to offset the losses in other areas, such as in departments stores.

    Over the last 15 years, e-commerce added 178,000 jobs and department stores lost 448,000 jobs. In this same time period, warehouse clubs added 841,000 jobs! I found it interesting to see department stores on the bottom and warehouse clubs on the top of the graph.

    image

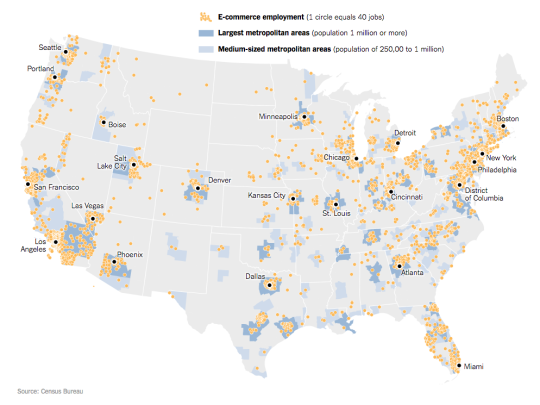
    Finally, e-commerce jobs appear to be concentrating in larger metros. See above map. Each mustard dot represents 40 e-commerce jobs. You’re selling more products with less human capital, and those people are clustering. This is a broader trend.

    According to the New York Times, counties and smaller cities (under 250,000 people) account for almost ¼ of overall retail employment. But when it comes to e-commerce firms the number drops to around 13%.

    Once again it would seem that technology and what we do online have an impact on our cities and towns. And that’s fascinating.

    All images from the New York Times

  • Late-stage gentrification on Bleecker Street

    The New York Times ran an interesting piece this past week about the rise and fall of Bleecker Street in the West Village. 

    The synopsis of the story is as follows: 

    Bleecker was once a quaint West Village street. Then the yuppy cupcake shop and big brands (Marc Jacobs) came in to cater to the “Black Card-wielding 1-percenters”. But eventually rents got so out of hand that even the big brands started closing up shop. Now the street is filled with empty storefronts.

    Here’s an excerpt from the article:

    Bleecker Street, Mr. Moss said, is a prime example of high-rent blight, a symptom of late-stage gentrification. “These stores open as billboards for the brand,” he said. “Then they leave because the rents become untenable. Landlords hold out. And you’re left with storefronts that will sit vacant for a year, two years, three years.”

    Nobody likes vacant storefronts. But it is a perfect example of the kind of cycles that neighborhoods and cities can and will continue to go through. Understandably though, there is a real concern that New York could be losing its soul. And really that’s a question and challenge for all global cities.

    What happened to the New York where the artist Donald Judd was able to buy a five-story cast-iron building in Soho for under $70,000 (1968)? It’s gone. 

  • So is this Brutalism or not?

    image

    The Spaces just featured 21 Scott Street in Bronte (a suburb of Sydney) as its property of the week. (The home is currently listed.)

    Designed by MCK Architects, the home is also called the “Upsilon House” and was supposedly designed for a fashion-industry couple.

    Two things should immediately stand out to you about the house. One is how long and narrow the site and house are.

    Here is a lengthwise view of the main living floor:

    image

    Based on the plans provided by The Agency (listing agency), the house is about ~3.9m wide. That’s because of its tight site. However, the clerestory windows that run the length of the house would provide ample light.

    The other thing that should stand out is all of the exposed concrete. The Spaces calls it “soft brutalism.” I personally love it, but I recognize that it’s not for everyone.

    In any event, it reminded me of a recent blog post by Witold Rybczynski in which he responded to the New York Times calling Habitat in Montreal a brutalist building. His rebuttal: that’s a gross over-simplification. Brutalism, in its truest sense, is about dramatizing the “rough character of concrete.”

    But I particularly enjoyed how he ended the post:

    “There is another litmus test of Brutalism. Buildings like Habitat remain popular with their users. If people don’t hate it, it can’t be Brutalist.”

    If that’s the case, then 21 Scott is certainly not Brutalism in my book.

    Images via MCK Architects

  • Opendoor is now selling ~300 homes per month

    Farhad Manjoo of the New York Times published an article this morning about Opendoor – a startup that I have written about multiple times on this blog – called, The Rise of the Fat Start-Up. (His definition of “fat” is that the startup owns lots of hard assets, which considered atypical in tech.)

    Below are a couple of interesting tidbits from the article:

    • Opendoor has raised over $300 million in equity and over $500 million in debt since inception.
    • Opendoor plans to be in 10 cities by the end of this year.
    • Average commission charged on Opendoor is 7.5%, which is higher than a traditional real estate agent and higher than what was quoted before in the press. The higher % is because of certainty and convenience.
    • Opendoor offers a leaseback option if you’d like to stay in your house for a period of time after you’ve sold it.
    • Their conversion rate (offers made to closings) is about 30%.
    • Other startups are now in the market with similar models, including Offerpad and Knock. Zillow is working with Offerpad on a pilot. Someone is starting to feel threatened.

    The article also quotes a blogger and real estate analyst named Mike Delprete. Heads-up: His blog is called “Adventures in Real Estate Tech.” I’m sure this will appeal to many of you. I obviously just subscribed.

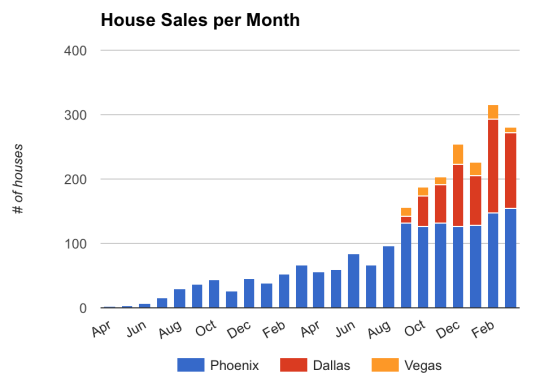
    Mike dug into MLS records in order to figure out Opendoor’s transaction volumes, since the company is not releasing this information. Here’s what he found (the chart is up to March 2017):

    The trend line is certainly moving in the right direction. But Mike also believes that Opendoor is only netting around $8,320 in profit per home and that much of it is driven by appreciation. There’s also substantial risk in owning so many homes – each one is usually held for a few months.

    But you can be sure they’re thinking well beyond where they are at today. Expect many more updates on this blog.