Daily insights for city builders, delivered every morning at 6 AM ET. I’m Brandon Donnelly — a Toronto-based real estate developer and founder of Globizen. I’ve been writing here since 2013.

Tag: greater toronto area

  • Everything has a cost

    A new report was just published by Urbanation and the Federation of Rental-Housing Providers of Ontario (FRPO) arguing that the Greater Toronto Area is undersupplying rental housing to the tune of about 20,000 units per year. This number considers both purpose-built rental housing and condominiums that are purchased by investors and later rented out. (Shane Dingman also covered the report in this recent Globe and Mail article.)

    These findings probably won’t come as a surprise to a lot of you. It is pretty common for most big/growing cities to operate with a perpetual housing supply deficit. With all of the barriers to development, it’s often impossible to keep pace with demand. This naturally creates upward pressure on pricing. But the other factor that cannot be ignored is development costs. How much does it cost to actually deliver new supply?

    Here’s an excerpt from the report that speaks to this consideration:

    While the results of the infill development potential exercise are encouraging, the economics
    of intensifying these sites may be too difficult for owners to ultimately move them forward in many cases even with a zero land cost, as achievable rents outside of Central Toronto are
    often not high enough to offset development and operating costs.

    It’s also something that we’ve talked about many times before on the blog. Even with free land, there are going to be countless sites and neighborhoods where it does not make economic sense to build anything new: development costs > potential revenues. And so to build, somebody is going to have to pay. Either the costs need to be subsidized or the revenues needs to be topped up somehow. Otherwise, supply = 0.

    If you’re facing a deficit of 20,000 units per year, this seems like something you may want to consider. How might we increase supply? And how might we increase the supply of affordable housing? Many, including some of the folks interviewed in Shane’s Globe and Mail article, believe that inclusionary zoning is one such solution. Force new developments to deliver a certain percentage of affordable units (kind of like forcing restaurants to offer up 5-10% of their tables at a loss).

    But again, I think it’s important to remember that whenever costs exceed revenues, somebody is going to have to pay for that shortfall, otherwise supply = 0. Something has to give, whether that be reduced costs, greater density, or higher rents on the remaining market rate units. I think part of the allure of inclusionary zoning is that it creates the allusion of a free lunch. But here’s the thing: everything has a cost.

  • Suburban household debt in Canada

    Rachelle Younglai and Chen Wang’s recent piece in the Globe and Mail on suburban household debt (in Canada) has a number of interesting stats. Here are some of them:

    • Looking at debt service ratios across the country, the most financially stressed neighborhoods in Canada are almost exclusively in the suburbs. (Map of the Greater Toronto Area shown at the top of this post. Data from Environics Analytics.)
    • 34 of the top 100 most financially strained neighborhoods in Canada are located in Brampton, Ontario.
    • Brampton has grown at 2x the rate of Toronto over the last decade.
    • 43% of Brampton’s housing was built between 2001 and 2016.
    • 80% of homeowners in Brampton have a mortgage compared to 63% across the Toronto region as a whole.
    • 80% of Brampton’s property tax revenue comes from residential property (not surprising). In comparison, 47% of Toronto’s property tax revenue comes from commercial properties.
    • About 2/3 of Brampton’s work force leaves the city for their job. This makes sense given the above point.

    The other thing the article talks about is the increase in the average household size in many suburban communities as a result of people renting out parts of their house.

    One Brampton gentleman is quoted as saying that he rents his basement out to 3 or 4 students and his upstairs bedrooms to two truckers. This translates into typically 6 vehicles parked in his driveway.

    Assuming this is the trend, I wonder how much of this additional income is being reported to CRA. Because if it’s not, then it could be throwing of these debt ratios and making the financial situation look more dire than it is.

    In any event, I think this speaks to, among other things, the role that many suburban communities now serve for new immigrants coming to Canada. They are doing what they can to try and get ahead.

    It’s also worth noting that if you look at the above map of the Greater Toronto Area, the lowest “debt spots” are in fact where homes tend to be the most expensive — the core.

    Map: The Globe and Mail

  • Cost-plus pricing

    Today, Urbanation released its Q4-2018 market highlights report for the Greater Toronto Area. 

    The general media will pick up these numbers and tell you that there’s been a precipitous decline in the number of new condominium sales. But the reality is that 20,028 units were sold in 2018, which is actually in-line with 10-year averages for this region. 2017 was a particularly frenetic, and unsustainable, year.

    The average pre-construction sold price for a new condominium in the former City of Toronto (the core) was $1,117 psf last year, and $921 psf across the broader region. These numbers represent significant double digit increases from the year prior. But again, what I don’t think many people appreciate is that the cost environment has also changed dramatically over the last few years.

    Construction costs are way up, as are development charges and a myriad of other pro forma line items. The above numbers are simply a result of cost-plus pricing. Here’s where costs are at and here’s where we need to be to make the project feasible. Margins haven’t increased; in fact, they’ve probably been squeezed for many developers.

    I think this is an important topic that deserves more transparency and visibility. So I’m hoping to work with a developer friend of mine and publish something more substantial in the coming months.

  • Q4-2018 high-density land sales in Toronto

    image

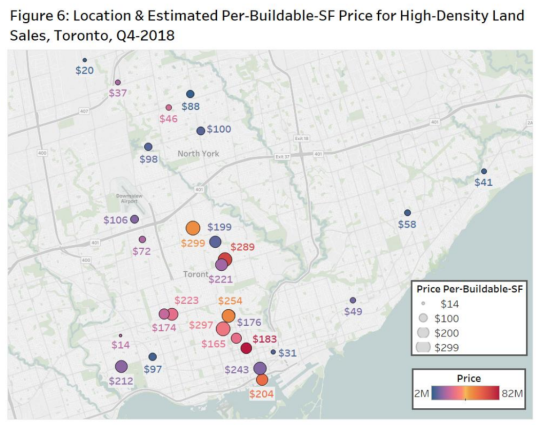
    Bullpen Research & Consulting and Batory Management just published their Q4-2018 High-Rise Land Insights Report for the Greater Toronto Area. 

    Above is a mapping of the estimated per square foot buildable prices for the land that traded hands specifically in Toronto last quarter. 

    The average is $178 per square foot. And the projected average sale (condo) price is $1,097 psf. That sounds right. You basically need that kind of end pricing to make the math work with today’s costs.

    Across the GTA, the average spread between zoned and unzoned land was almost $40 psf. $159 psf versus $120 psf, respectively.

    A full copy of the report can be downloaded here

  • Average price of a new condo in Toronto is now above $1,000 psf

    Urbanation released its Q3-2018 condo market results for the Greater Toronto Area earlier this month. 

    Here are a few highlights:

    – The unsold inventory of new condos in development is currently 33% below the 10-year average of 14,806 units.

    – Year-to-date sales of new condominiums decreased to 14,055 units from 25,839 units (same period last year). 2017 was a record year.

    – The average price per square foot for new project launches in Q3-2018 was $1,044 psf. This is the first time the average has broken the $1,000 psf mark. 

    – This is a significant price increase from last year and it is being driven by low supply, stable demand, and rising development/construction costs (my opinion).

    – The average unit size for project launches in Q3-2018 was 714 sf.

    – The average opening quarter absorption rate remains above 55%. It has been this way since Q1-2016.

    For the full press release, click here.

  • Car-dependent spatial structure

    Earlier this week a 58 year old woman named Dalia was struck and killed by a car near the University of Toronto’s downtown campus. This tragedy has everyone talking about and questioning how to make our roads safer, though the answers are not difficult to find. Here is an excerpt from a piece that Richard Florida penned following the incident called, Toronto’s Deadly Car Crisis:

    Today, more Torontonians die from being hit by cars than from being killed by guns. In 2016, nearly 2,000 pedestrians and 1,000 cyclists in the city were hit by cars. Of these, 43 resulted in fatalities. On average, a pedestrian in Toronto is hit every four or five hours, and a cyclist every eight or nine. This means that Toronto’s rate of pedestrian deaths was 1.6 per 100,000 people in 2016 — worse than in Chicago, Seattle, San Francisco, Boston, Washington, D.C., Portland, Pittsburgh, Cleveland, and Buffalo. It has risen to 1.7 deaths per 100,000 people in 2017 and is on track to rise still further to 1.8 deaths per 100,000 this year. And, children and the elderly face the greatest risk of being struck and killed by a car. The problem is only getting worse. Across Canada, pedestrian fatalities increased by more than 10 percent between 2010 and 2016; at time when they decreased by more than 25 percent in European countries like Norway, Switzerland, and the Netherlands.

    The broader issue is what he refers to as Toronto’s “car-dependent spatial structure.” And it is detrimental to not only our public safety, as we saw this week, but also to our ability to grow as a global city. The Greater Toronto Area is projected to reach 10 million people by 2041. I agree with Florida that, for a number of important reasons, we are going to need to commit ourselves to a new model for growth.

  • New School of Cities

    The University of Toronto just announced a new School of Cities. It will begin operations on July 1 of this year (2018) and bring together researchers from various disciplines to address the world’s most critical urban challenges. 

    Insert stat here about the percentage of the population that will live in an urban area by 2050.

    There are more than 220 faculty members across 40 different academic divisions at the University of Toronto who are doing urban-focused work. The School of Cities is intended to bring those minds together.

    So far there are plans for a “global cities summit” and an “urban lab” that will also bring students, faculty, industry, and government together. The intent is for the School to act as a city builder both locally (Greater Toronto Area) and globally.

    This once again goes to show just how important we are all taking urban issues today. But I am sure this blog audience didn’t need to be reminded of that.

    If you would like to sign up for updates from the School of Cities, you can do that here.

    Photo by Jorge Vasconez on Unsplash

  • Half of Toronto condos completed last year became new rental housing

    image

    Shaun Hildebrand (Urbanation) and Benjamin Tal (CIBC) published a report today called, “A Window Into the World of Condo Investors.” In it they revealed that last year (2017 data) no less than 48% of the Greater Toronto Area’s newly completed condo units were closed on by “rental investors.” In other words, almost half of the units became new rental supply.

    This stat was not surprisingly turned into clickbait-y type headlines like, “Half of Toronto condos bought last year were by investors”; whereas an alternate headline might read: “Half of Toronto condos completed last year became new rental housing.” Not as jarring, I know.

    In any event, there are a bunch of other interesting stats in the reports. Here are a few of them:

    – 80% of all new home sales in the GTA last year were condo.

    – Average resale condo prices (per square foot) increased by 26% last year and rents grew by 9%.

    – Over 20% of condo investors purchased their property with no mortgage.

    – Average down payment made by investors was 20%; non-investors were closer to 15%, likely because of mortgage insurance and other factors.

    – Out of the condo investors who took possession in 2017 with a mortgage, no less than 44% are in a negative cash flow position – meaning their rental income isn’t covering their carrying costs. 

    – The returns, which the report calls exceptional, have been coming in the form of price appreciation.

    – As a stress test for the market – what if all these negative cash flow investors suddenly sold their condos? – the report also estimates that if you took all of the rental investors who closed in 2017 with a mortgage and who are in a negative cash flow position greater than $500 per month, it would represent only 3.4% of the total annual supply of condos (both new and resale product).

    If you would like to check out the full report, you can do that over here.

    Photo by Scott Webb on Unsplash

  • New high-rise home prices up 39.5% year-over-year

    February data (2018) for the new home market in the Greater Toronto Area was released this past week by BILD and Altus. I seem to have gotten into the habit of writing about this every month.

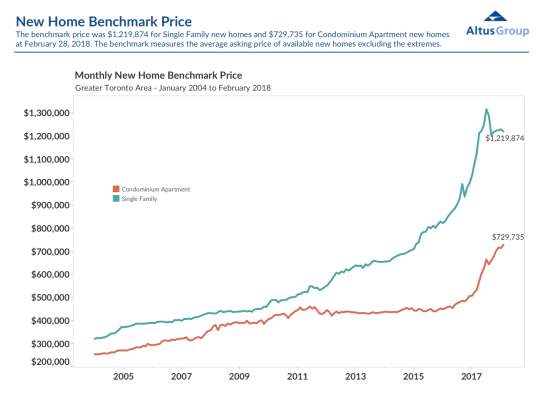
    The benchmark price for new low-rise single-family housing was down slightly from January to $1,219,874, but still up 12.8% from a year prior.

    The benchmark price for new high-rise housing was up a whopping 39.5% year-over-year to $729,735. But part of this is being driven by an equally dramatic increase in average unit sizes.

    Here is the relevant graph:

    image

    The story continues to be about tight supply, historically low developer inventories, and a lack of affordable low-rise product. 

    As I have argued many times before on this blog, I believe these factors — and in particular the last one — are, at least partly, driving this recent pop in high-rise pricing. People are priced out and now searching for substitutes.

    So my prediction continues to be that we will see a convergence (i.e. diminishing spread) between new low-rise and high-rise pricing.

    That will also bring about design and product changes on the high-rise side.

  • Only 2 new single-family homes sold in Toronto last month

    Altus Group just released its January (2018) sales figures for the new home market in the Greater Toronto Area.

    – 1,251 new homes sold last month. 886 of these (or 70.8%) were condominium apartments (everything from stacked townhouses to high-rises).

    – This is down from 2,429 homes in 2017 and 2,118 homes in 2016.

    – Almost half of the new home sales (609 homes) came from Toronto alone. And almost all of these (607 homes) were condominium apartments. Only 2 new single-family homes sold in the city last month.

    – Benchmark price for single-family homes was $1,229,454, which is a 19.6% increase from January 2017.

    – Benchmark price for condominium apartments was $714,430, which is a 40.8% increase from January 2017.

    That last increase really stands out. I did a double take.

    But as we’ve talked about before, low supply and high prices seem to be pushing more buyers toward condos – and larger ones at that.

    Recently we’ve been seeing an increase in both average unit sizes and prices per square foot.

    According to Altus, sales of new single-family homes in the GTA last month were the lowest for a January since before 2000.