
Daily insights for city builders, delivered every morning at 6 AM ET. I’m Brandon Donnelly — a Toronto-based real estate developer and founder of Globizen. I’ve been writing here since 2013.

Tag: greater toronto area

  • Land prices and transaction volumes are, as you’d expect, down

    Bullpen Consulting just released its Q3-2024 high-rise land report for the Greater Toronto Area. Here’s a figure showing average high-density land prices (on a per buildable square foot) by quarter since 2018:

    Here’s their summary data broken out by Toronto versus the Greater Toronto Area:

    And here’s a list of all the land transactions last quarter:
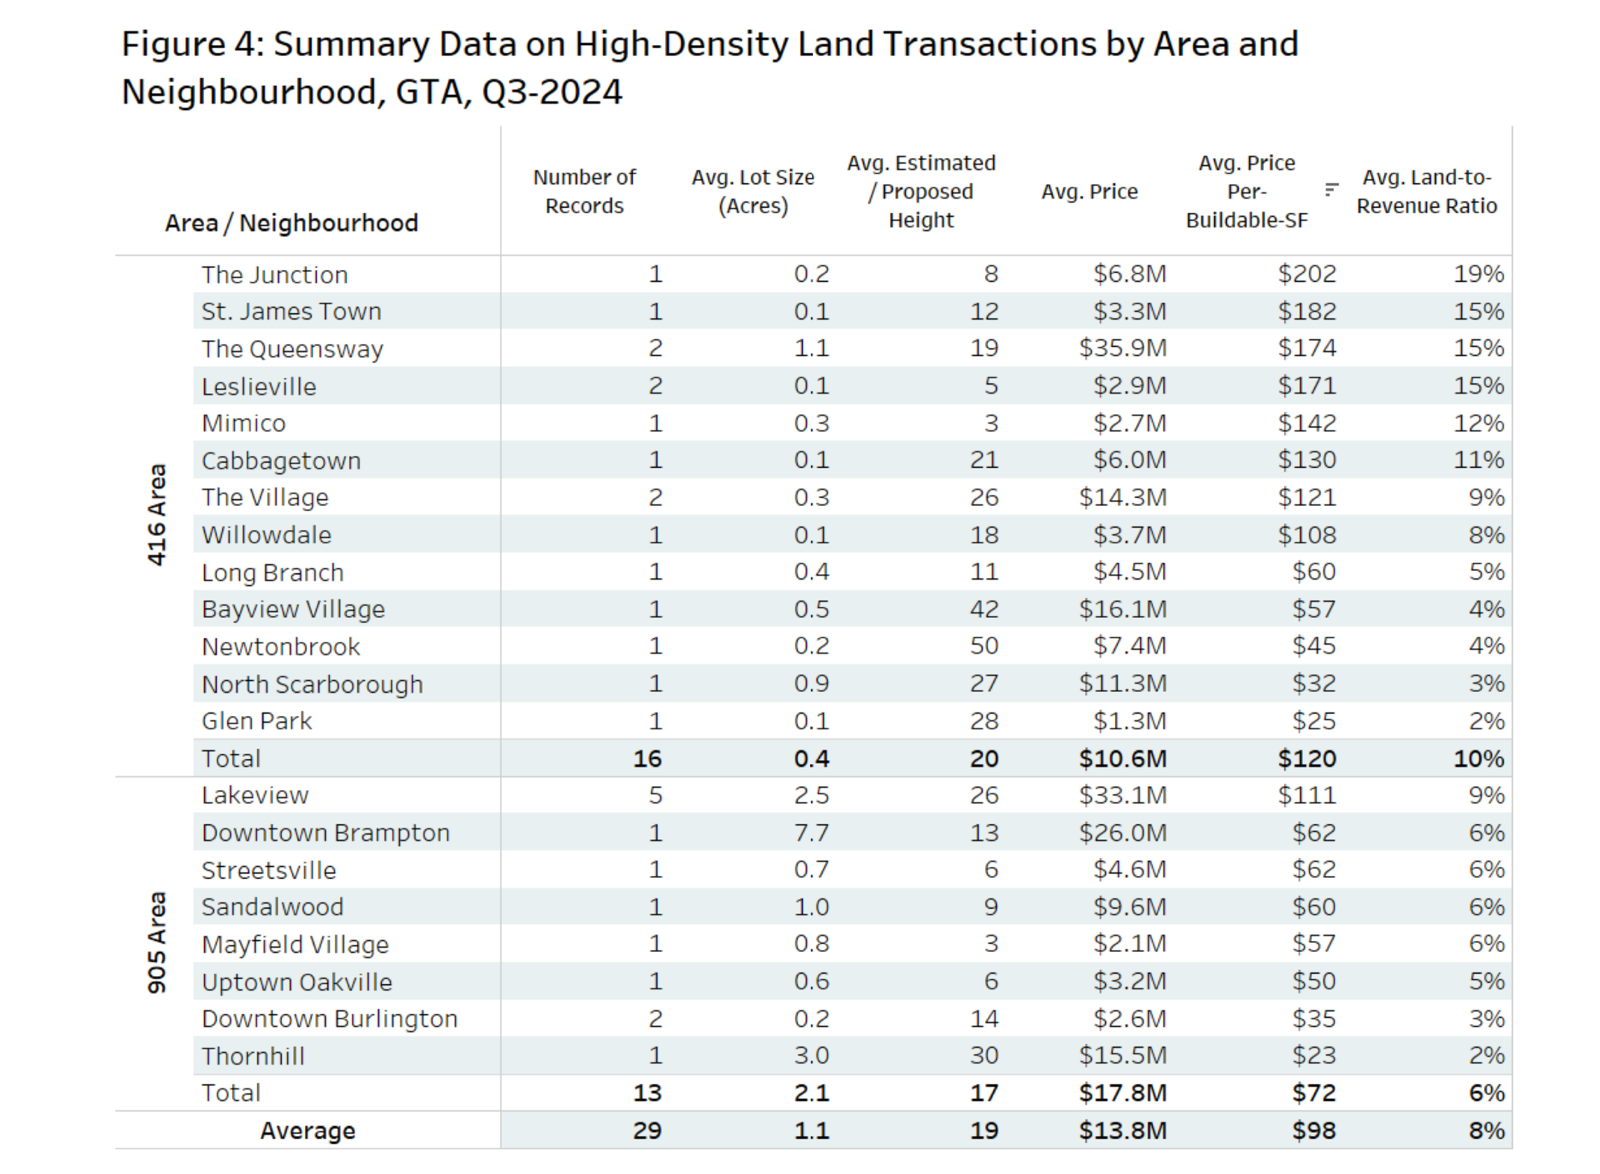
    At the highest level, the average high-density land trade last quarter across the GTA was at around $98 per buildable square foot. This is down 13% from $112 pbsf in Q3-2023. And going back to the first chart in this post, there also seems to be a longer-term decline in high-density land prices.

    But as Bullpen rightly points out in their report, there are limits to what can be gleaned from data like this. And that’s because land transactions can be structured in countless ways. Did the vendor provide cheap financing? Was there a delayed close? Are there any unique site conditions that could be impacting value? The list goes on.

    So even though prices and transaction volumes are down (which is what one would totally expect right now), it still doesn’t feel like this data accurately reflects what’s going on in the market today. I think the reality is worse.

    If you’d like to join Bullpen’s mailing list, here’s their website.

    Figures: Bullpen Research & Consulting

  • More people, fewer new homes

    This is an interesting chart from the Centre for Urban Research and Land Development at Toronto Metropolitan University (TMU).

    It is based on recent population estimates from Statistics Canada, and what it is saying is that the Greater Toronto Area grew by 233,000 people during the 12 months ending July 1, 2023. If you include Hamilton, this number increases to 246,000. And if you include the entire Greater Golden Horseshoe, it increases to 340,000.

    This is significantly more population growth compared to any of the six preceding years. And assuming this 2021 population estimate of about 9.8 million people is more or less correct, it represents an almost 3.5% growth rate. That’s remarkable. It’s also happening at a time when housing starts are declining.

  • Cost-plus price floor

    Oftentimes, it feels like there is a perception that developers price new housing with the fattest of margins. Meaning, if only developers were less greedy, housing could be more affordable. But as we have spoken about many times before, real estate development is a competitive industry; therefore, projects happen on the margin.

    Ordinarily, the prices you see are the result of a cost-plus pricing strategy. Developers figure out what it will cost to build and develop, they add on a margin that they think their investors will accept, and then they determine what sticker prices they need to make the project financially feasible.

    I’ve been writing about this approach for many years, but today it’s even more obvious. According to Urbanation’s Q1-2024 condominium report, new unsold condominium inventory in the GTA is currently sitting at approximately 23,815 units. This is up 30% YoY and is equal to about 23 months of supply. Two years ago in Q1-2022, this number had reached an 18-quarter low of 8,726 units.

    Developers are highly motivated to sell and move their projects forward. Time is a killer, especially today. So the logical explanation for this rising inventory is simply that they can’t sell it. Their cost-plus pricing doesn’t overlap with what most buyers in the market are willing to pay. Like I said, development happens on the margin.

    In theory, there is always a price where buyers would be willing to transact. If I listed a beautiful condominium for $100k today, many people would want to buy it. Supply would quickly run out. The problem is that no developer can build for this. There is always a very real price floor and, right now, that floor doesn’t seem to be low enough for many buyers.

  • Closing risk

    Urbanation is forecasting that approximately 27,000 condominium suites will finish construction and be ready for occupancy this year in the Greater Toronto Area. This is some sort of a record, and is naturally the result of record pre-construction sales over the last cycle.

    This number is going to come down given that construction starts are declining, but before that, these suites will need to get absorbed into the market. And that’s why I think that one of the biggest risks for our industry this year is going to be closing risk.

    In other words, you’ve got the pre-sales, but will the purchasers actually show up and close on their homes?

    It is for this exact reason that most/all construction lenders want to see pre-construction purchasers pay at least 10% in deposits before they’ll advance their loan. It is also why the most risk-averse developers won’t start construction until they have even more than 10% sitting in trust. The more hard money a purchaser has paid, the more likely they are to close.

    It can be easy to forget this when the market is on fire and you’re more preoccupied with holding back inventory because you think that sale prices will be higher in the future. But it’s prudent to remember these times. They are a naturally occurring part of real estate cycles.

    The most risk adverse execution strategies will likely leave some money on the table in the best of times. You won’t be profit maximizing. However, they’ll leave you more protected in the worst of times. That’s how risk and reward work.

  • Why are construction starts down?

    Last year in the Greater Toronto Area, condominium construction starts fell to a 9-year low of 15,891 homes. And this year, condominium construction starts are forecasted to fall to a 15-year low of 11,500 homes (though new sales are expected to rebound). Both of these figures are from Urbanation’s Q4-2023 market data.

    One possible explanation for this drop in construction starts could be that developers are somehow colluding to keep supply low and prices high. Another one could be that more developers are right now independently speculating that prices will be higher in the future, and so they think it’s better to just wait. But both of these explanations would be wrong.

    The correct answer is that more developers are unable to start construction because the market isn’t there. In the case of Toronto’s condominium market, this means that the pre-sales aren’t there. This might seem obvious, but there seems to always be a contingent of people who believe that developers can choose to build whenever they want.

    It is for this same reason that some people think that zoning approvals should have an expiry date. Call it a use-it-or-lose-it approach. But as I think we can see in the above numbers, developers don’t control the market. And so I would never want to be in a position where I need to start construction by a certain date, or else.

    That’s not entirely within my control. In fact, sometimes it’s completely out of my control.

  • Mid-rise development land is more expensive

    As is the case every quarter, Bullpen Research & Consulting and Batory Management have just published their latest Greater Toronto Area land insights report (for Q3-2022). The average price per buildable square foot (pbsf) in this report remains the same as in Q2 at $95.

    But once again, it’s important to keep in mind that this represents a fairly small sample size (34 land sales in the quarter versus 46 in Q2); that the range in land pricing can be significant across the GTA (here it is $24-274 pbsf); and that there can sometimes be a lag between a deal being struck and actual closing. Here is the summary data:

    Another interesting data point from the report is land price compared to building height. The average price for high-rise development land was $88 pbsf, and the average price for mid-rise development land (5-15 storeys) was $131 pbsf.

    This once again speaks to the cost differential between high-rise and mid-rise housing. The mid-rise scale is certainly a desirable form of infill, but it is also a more expensive form of housing.

  • Condo rents in Toronto are up 11.4% quarter-over-quarter

    Urbanation released its Q3-2021 rental report for the Greater Toronto Area at the beginning of this week. The vacancy rate in purpose-built rental buildings fell to 3.0%. This is down from 5.1% in Q2-2021 and 6.4% in Q1-2021. For the former City of Toronto (the city pre-amalgamation), vacancy rates declined to 3.8% in Q3-2021, down from 9% in Q1-2021. So people are renting apartments.

    At the same time, rents are growing. The average rent for newer purpose-built rentals was $2,389 per month or $3.30 per square foot at the end of last quarter. This is up 3.8% from Q2. But what is also interesting to see is how quickly the core / downtown is snapping back. Looking at condominium rentals, the former City of Toronto had the lowest leases-to-listings ratio at the start of the pandemic in Q2-2020. But in Q3 of this year, its ratio was the highest. See below.

    Average rents have also spiked for condo rentals in the core, posting an 11.4% quarter-over-quarter increase and a 6.2% year-over-year increase. The average rent is now sitting at $2,405 per month or $3.62 psf. See above. Remember when everyone thought that cities were dead and nobody was ever going to live in a downtown apartment ever again? Yeah, that was funny.

    Charts: Urbanation

  • Q2 2021 rental market update for the Greater Toronto Area

    The Greater Toronto Area builds a lot more condominiums than purpose-built rental units. This isn’t the case everywhere though. I was recently reading an article about Salt Lake City and how developers there don’t want to build condominiums. It’s mostly rental housing. There’s simply too much risk and liability with condominiums. I guess this is one of the reasons why real estate is often said to be a local business.

    In any event, because of this dynamic in Toronto, condominium rentals are often used to measure the health of the overall rental market. There are simply more recent comparables to point to when you’re trying to figure out what is “market.” The Toronto Regional Real Estate Board recently published its Q2-2021 rental market report and here is what they found when it comes to condominium apartment rental transactions in the Greater Toronto Area:

    Q2-2021 – 14,920 transactions

    Q1-2021 – 13,168 transactions

    Q2-2020 – 7,300 transactions

    What this report tells us is that rental demand is returning. Transactions and rents are up compared to the first quarter of this year and certainly compared to Q2 of last year (2020), which was the low point of this pandemic. We are not yet back to where we were in Q1-2020 when the city was firing on all cylinders, but I have no doubt that we will get there and ultimately surpass those figures.

    For the full rental market report, click here.

    Photo by Narciso Arellano on Unsplash

  • Toronto condos on the rise again

    CIBC Deputy Chief Economist Benjamin Tal was recently interviewed by Larysa Harapyn of the Financial Post about the state of the housing market in the Greater Toronto Area. The message he delivers is pretty clear: “If you think that Toronto is unaffordable now, you wait.” The long-term fundamentals in this market remain strong. Demand is outstripping supply and will likely continue to do so, which is why Tal also stresses the importance of delivering more purpose-built rental housing. If you can’t see the video above, click here. (And with that, I think it’s time to switch topics for tomorrow’s post. That’s enough Toronto housing for one week.)

  • Average price of a home in the Toronto region increased 13.5% last year

    The Toronto Regional Real Estate Board released its 2020 housing figures this week. And I suspect that the numbers are probably directionally similar for many city regions around the world.

    2020 saw more home sales than 2019 with 95,151 homes changing hands. This represents an 8.4% increase compared to last year. December was also a record month with 7,180 sales — a 65% year-over-year increase!

    The average selling price in the Greater Toronto Area also reached a new record of $929,699. This represents a 13.5% increase compared to last year. Once again, December was a record setting month with an average selling price of $932,222.

    When you look at sales and average prices by home type, the biggest drivers were low-rise homes outside of the city. No surprises here.

    But consider the price spread that now exists between condos and detached homes. In the City of Toronto (“416”), we’re talking about an average price delta of nearly $850k. That would be an expensive home in many other markets.

    Of course, condos tend to be smaller than detached homes. And so different prices per pound. But total price matters a great deal and historically a widening spread has moved many buyers over to the condo market.

    I suspect we will see that happen again this year.