Daily insights for city builders, delivered every morning at 6 AM ET. I’m Brandon Donnelly — a Toronto-based real estate developer and founder of Globizen. I’ve been writing here since 2013.

Tag: the economist

  • A more distributed startup geography

    The Economist recently argued that Silicon Valley’s innovation hegemony is waning and that it is a product of two factors: there appears to be more innovation happening elsewhere (good news), but that innovation in general also seems to be harder to achieve (bad news). Here is an excerpt from the article:

    Other cities are rising in relative importance as a result. The Kauffman Foundation, a non-profit group that tracks entrepreneurship, now ranks the Miami-Fort Lauderdale area first for startup activity in America, based on the density of startups and new entrepreneurs. Mr Thiel is moving to Los Angeles, which has a vibrant tech scene. Phoenix and Pittsburgh have become hubs for autonomous vehicles; New York for media startups; London for fintech; Shenzhen for hardware. None of these places can match the Valley on its own; between them, they point to a world in which innovation is more distributed.

    Part of the problem, of course, is rising costs in the Bay Area. Everything from the cost of living to the cost of operating a business. The article cites a recent survey where nearly half of all respondents said they are planning to leave the Bay Area in the next few years. This is up from 34% only two years ago.

    I don’t doubt that rising costs are causing some people to look to other cities, as well as other countries in the case of draconian visa policies. But I am suspect of the claim that we’ve heat peak “innovation” – however you want to define that.

  • Experiences over fashion — or is that really the case?

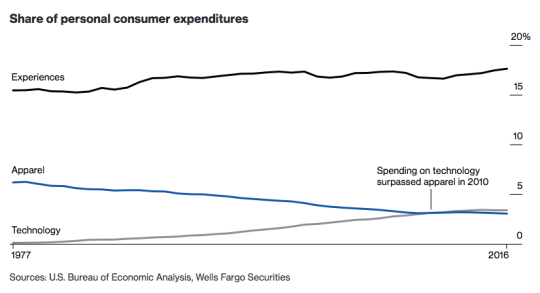
    Bloomberg recently published this interesting piece talking about the death of clothing. The reasons are as follows: we’re spending more on experiences, as well as technology (tech spending surpassed apparel spending in 2010); casual dress in the workplace has become more widely accepted; fast fashion companies like H&M and Zara are putting downward pressure on prices; and social media influencers – instead of big companies – are now the ones showing us what to buy and wear.

    Here is a graph from the article comparing experiences, apparel, and technology expenditures: 

    image

    The first thing I noticed is that experiences, while still increasing, haven’t really spiked since 1977, even though everybody seems to be talking about how social media-fueled Millennials are all about experiences. I was also surprised to see that the share of US employers that allow casual dress every day seems to be closing in on 50%. (Informal survey for the comments and for Twitter: Do you wear casual clothes to work? I’m a no.)

    But perhaps the biggest contributors to this decline are fast fashion and low-cost manufacturing. Stanley Pignal – South Asia business and finance correspondent for the Economist – pointed out on Twitter that since 1982 inflation in US apparel was only 123% compared to 248% for overall CPI. So maybe a lot of the above reasoning is just a distraction.

  • Why dynamic road pricing is inevitable

    The Economist recently published an article called: How and why road-pricing will happen. If you’re a regular reader, you’ll know that there’s been lots of talk and support

    over the years

    on this blog for dynamic road pricing.

    It’s politically unpopular, but it’s an incredibly rationale way to deal with traffic congestion. 

    In Singapore – home of the world’s first congestion charge zone (1975) – they constantly monitor traffic congestion. As soon as average speeds drop over a three-month period, they simply raise the charge. Congestion gone.

    We know this works, but for many reasons road pricing is highly divisive. According to The Economist, there are a few reasons why this is going to become a bit more politically palatable.

    For one, the take from gas taxes and vehicle duties has been declining in Britain over the past couple of years. Electric vehicles will only exacerbate this trend. So governments are going to be forced to look elsewhere for money.

    Secondly, traditional tolls and congestion charges are becoming increasingly ineffective. Today in central London, private-hire vehicles are said to make up about 38% of all car traffic – almost double the share of traditional black taxis. 

    These are cars circling around the city, picking up passengers. Blunt charges based on suburbanites entering the city in the morning and leaving in the afternoon is simply not capturing the way that many of us move around our cities today.

    In other words, urban mobility is undergoing dramatic changes and the revenue and congestion management tools are going to need to adapt. If you’re interested in this topic, check out the full article here.

    Photo by chuttersnap on Unsplash

  • Data is the new oil

    “A NEW commodity spawns a lucrative, fast-growing industry, prompting antitrust regulators to step in to restrain those who control its flow. A century ago, the resource in question was oil. Now similar concerns are being raised by the giants that deal in data, the oil of the digital era.“

    The Economist just penned an interesting piece arguing that the world’s most valuable resource is no longer oil, but data. That’s why the five most valuable publicly traded companies in the world are all tech/data companies.

    But the point they are really making is that current antitrust remedies are poorly suited to this new precious commodity. For example, in today’s world authorities need to be thinking not just about firm size, but about the extent of their data collection.

    There’s a reason firms with no (meaningful) revenue get acquired for huge numbers. Yes, sometimes it’s just for the talent. But it’s also because of the data they control and the potential threat they pose.

    So much of what we do today leaves a digital trace. And those traces are hugely valuable. I suspect we will be hearing more about this as the data economy continues to spawn tech giants.

  • Amazon is just getting started

    image

    The Economist has an article up talking about what a behemoth Amazon has and will continue to become. Here are some interesting stats for you to think about:

    • More than half of every dollar spent online in America now goes to Amazon
    • Amazon’s share price has increased 173% since the beginning of 2015 (12x faster than the S&P 500)
    • With a market capitalization > $400 billion, it is the 5th most valuable company in the world
    • 92% of its value is supposedly being derived from profits expected after 2020 – they are playing the long game
    • Investors believe that revenue will go from $136 billion (2016) to half a trillion over the next decade

    If I can buy something online, instead of in person, I will do it. And that very often leads me to Amazon. In fact, I bought my new camera lens from them last week. Many others seem to be doing the same.

    When I go to a store now it’s because I need something immediately or because I’m looking for a new experience. I want novelty and I want to feel something special when I walk in. That, or I just need groceries.

  • Latest house-price indicators from The Economist

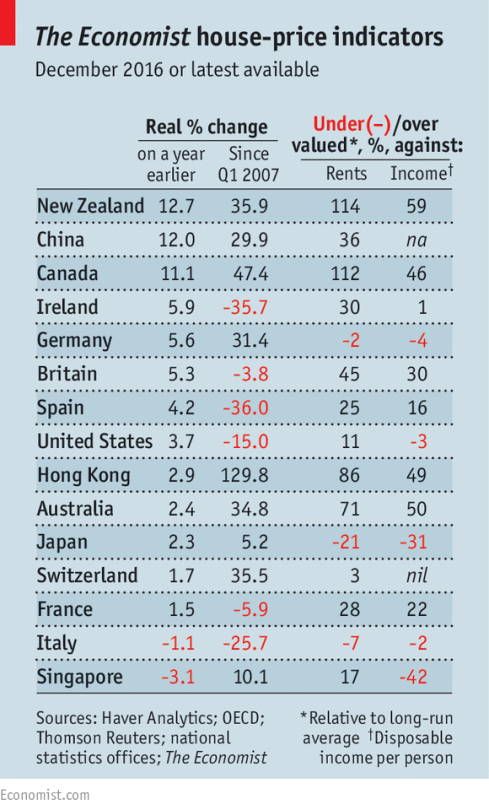
    The Economist recently published the following chart alongside this article talking about the impact of foreign buyers on global house prices.

    image

    They also have this set of interactive graphs that allows you to chart prices according to a number of different measures. The two metrics that The Economist focuses on (above) are house prices against rents and house prices against incomes. 

    The argument they make is that as (foreign) capital begins to think of property as merely a bolthole, it can start to detach itself from fundamentals such as rents and incomes. New Zealand, Canada, and Australia are specifically called out.

    This isn’t necessarily news. And one chart can only tell you so much. But I like staying on top of the various indices.

  • Where Canada’s immigrants have come from

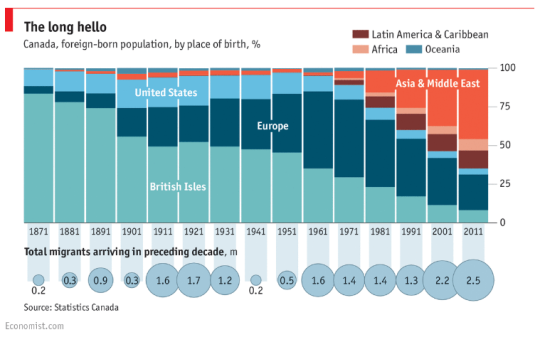
    Earlier today The Economist published the below chart showing where Canada’s immigrants have come from (place of birth) between 1871 and 2011. So basically from Confederation (1867) to today – almost.

    It’s a great chart. It really shows our evolution.

    Perhaps the most meaningful date to point out is 1962. That is the year Canada introduced new immigration regulations which effectively privileged skill and talent over race and national origin when it came to deciding who would be allowed to enter the country. 

    Look at the impact that had.

  • Corporate disaggregation (and some book suggestions)

    The truism is that both people and companies are moving back to downtowns. We are living in an urban era. But when you really look at the data, it is clear that the suburbs are far from dead. And when it comes to companies, the way in which they are relocating to downtown is not the same as it was in previous generations.

    The Economist calls it “corporate disaggregation.” Aaron Renn calls it “executive headquarters.” And it is the idea that it is primarily the elite executive jobs that are moving back downtown. The routine jobs are remaining in the suburbs or are being pushed out to even further outposts. On top of this, a move downtown can also provide the impetus for downsizing.

    Here’s an excerpt from The Economist:

    “The best book to read if you want to understand corporate America’s migration patterns is not Mr Florida’s but a more recent study, Bill Bishop’s “The Big Sort”. It argues that Americans are increasingly clustering in distinct areas on the basis of their jobs and social values. The headquarters revolution is yet another iteration of the sorting process that the book describes, as companies allocate elite jobs to the cities and routine jobs to the provinces. Corporate disaggregation is no doubt a sensible use of resources. But it will also add to the tensions that are tearing America apart as many bosses choose to work in very different worlds from the vast majority of Americans, including their own employees.”

    It is interesting, and probably disconcerting, to note that the divisiveness we are seeing in politics is also manifesting itself in our cities. The causes are likely the same. We may be living in an urban era, but we are also living in an era where, sadly, broad-based urban prosperity appears to be declining. See Elephant Graph.

    Another somewhat related book that may be of interest is Overcomplicated: Technology at the Limits of Comprehension. It is about the increasing complexity of our cities and our inability to properly understand it all. It argues that it may be time to seek out new tools.

  • What technological deflation could be doing to the economy

    Earlier in the week, I came across this post (via Fred Wilson), arguing that rapid technological progress is causing systemic deflation in the broader economy.

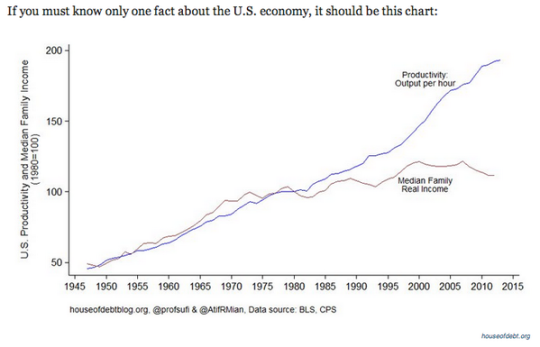
    Here’s a chart that illustrates the author’s point:

    What is happening here is that despite advances in technology and increases in productivity, real wages have been stagnant for decades. (This chart is for the US, but it likely applies to many other countries.)

    This is an interesting paradox. For a long time, increases in productivity were met with corresponding increases in income. So why the divergence?

    The author believes that it’s because the gains brought about by “extreme technological progress” are being unequally applied to the economy. In other words, they do not benefit the majority of people. He then goes on to argue that we could be entering an entirely new macroeconomic era: 

    “Economic growth may be over soon, at least in absolute terms. On the other hand that will be at least partially offset by the technological deflation. So instead of the decline of the innovation it will be just the opposite, the explosion of the innovation that will turn the economy to the decline. And moreover, it will not be a tragedy since we will be able to produce higher standard of living with fraction of the GDP today. Few adjustments needs to be done into our economic system to cope with the change for sure.”

    When you read things like this it makes the idea of a “basic income guarantee” seem far more palatable.

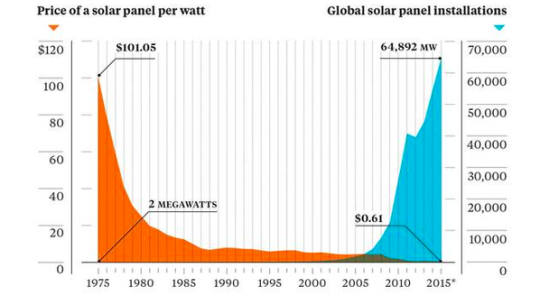
    The other chart that stood out to me was this one below, which shows the declining cost of solar panels and the rise of global solar panel installations. 

    It’s a great reminder that it’s only a matter of time before we wean ourselves off of oil. And, that we could be headed towards some sort of third industrial revolution where the marginal cost of energy is almost zero. Already about 25% of Germany’s electricity comes from renewables.

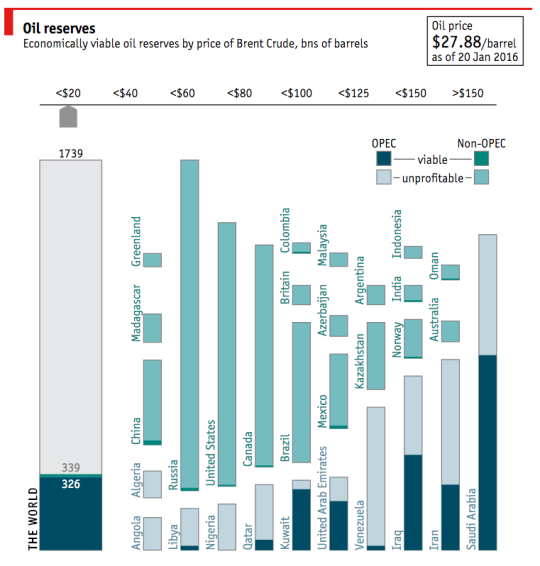
    On that note, I am going to end with a fantastic interactive chart from The Economist (screenshot below) that outlines oil reserves around the world by country. If you click through to their website, you can then toggle the price of oil (per barrel) to see how much of those reserves are actually viable.

    With the price of oil where it is today ($27.88 per barrel as of January 20, 2016), there are only a handful of countries with profitable oil. I am sure you could have guessed which ones.

    What will happen if, or should I say when, that oil is no longer needed? 

  • The world in 2050

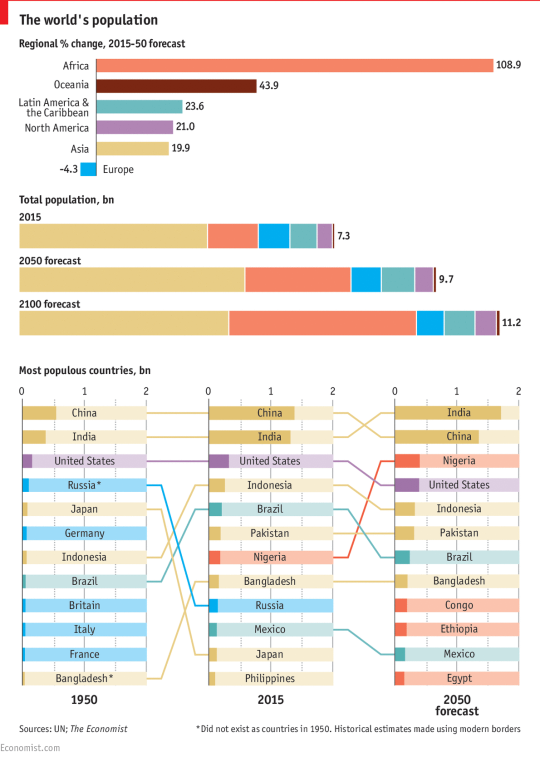
    The United Nations recently released its 2015 version of World Population Prospects. It looks as if they put out and revise this report every 5 years.

    The Economist then took some of their data and assembled it into the following charts:

    image

    It’s obviously extremely difficult to predict what will happen in the world by 2100, but to the extent that forecasting is possible, the world’s population is expected to reach somewhere around 11.2 billion people. Today it’s 7.3 billion.

    The bulk of this growth is expected to happen first in Africa, and then in Asia. By 2100, Africa’s share of the global population is expected to grow to 39% and Asia’s share is expected to decline to 44%.

    If you’ve been following population trends, most of this shouldn’t come as a surprise to you. The meaningful population growth happening in the world today is happening in the developing world. 

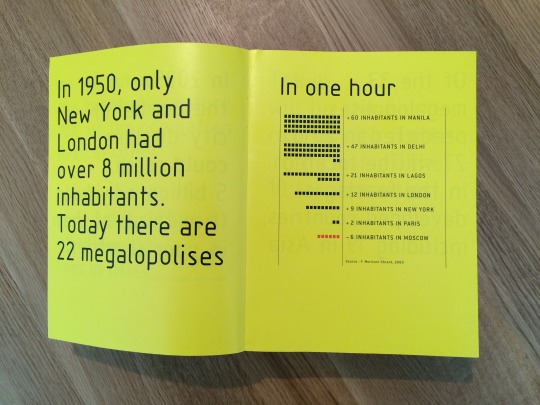
    That’s why architects, such as Rem Koolhaas, have been studying cities like Lagos (Nigeria) since the late 1990s and early 2000s. Below is a photo from a book/research project that I love called Mutations (2000). I pulled it from my bookshelf this morning.

    image

    It’s interesting to think about what all of this will mean for the global economy and for global governance. 

    The United States is about to be alone when it comes to advanced economies with a globally competitive population. Europe is shrinking, which leads me to believe that a strong EU is likely important. And we now have lots of megalopolises with big populations, but with very low income levels.

    Nigeria is the largest economy in Africa, but per capita income is somewhere around $3,000.