Daily insights for city builders, delivered every morning at 6 AM ET. I’m Brandon Donnelly — a Toronto-based real estate developer and founder of Globizen. I’ve been writing here since 2013.

Tag: sprawl

  • Urbanism versus architecture

    Good morning from rainy New Hampshire.

    It’s been raining all morning, but apparently there is an ocean hidden in the above picture. We also got in after dark and so all I really saw was what I could see on the drive from the airport.

    Whenever I am reminded that the vast majority of built form in North America is car-oriented in nature, I can’t help but think of how sticky all of this is going to be.

    Witold Rybczynski put it accurately when he said, “urbanism and architecture observe different time lines.” Buildings may take forever to build, but relative to urban form, they actually change pretty quickly.

    New materials and styles emerge, and so do new buildings. But the streets that surround them change so slowly, that for all intents and purposes, they mostly don’t change.

    What that means is that, for better or for worse, most of what we see is likely to persist. No wonder there is an arms race going on with autonomous vehicles.

  • Peaks and plains

    On the exact same day last week, the Toronto Star published two articles about housing. The first one, this one here, is about how “Toronto has protected huge parts of the city from anything denser than detached or semi-detached houses” and how this has resulted in an “uneven city.” The second article, this opinion piece, is about the “many repercussions to replacing little bungalows.” And one of the implied repercussions is that 3-storey sun blockers that invade privacy might actually kill people. Hmm.

    In effect, these are the two sides of this debate. If you zoom out and look at Toronto, you will largely see a contrasting and uneven city of tall buildings and low-rise housing. Instead of building like Paris, which is consistently mid-rise — but also far denser on average than Toronto — we have chosen peaks and large plains to constrain new housing. And if you zoom in across those plains, you’ll find many areas without sidewalks, along with people, such as the author of the second article above, who believe that nothing more than a single storey is appropriate for human health.

    All of this has persisted because it has been politically popular. But time continues to show us that it actually runs counter to our goals of building an inclusive and globally competitive city region. Thankfully, it feels like we are finally reaching a tipping point.

    Photo by Jackson Case on Unsplash

  • Zoning controls, sprawl, and housing affordability

    Maybe it’s confirmation bias, but I continue to feel like there is a groundswell of interest in trying to improve housing supply and overall affordability. The YIMBY movement continues to gain steam. Here are are few excerpts from a recent M. Nolan Gray article where he calls for an end to zoning as we know it today:

    In nearly every major U.S. city, apartments are banned in at least 70 percent of residential areas. San Jose prohibits apartments in 94 percent of its residential areas. The most a developer can build in these zones is a detached single-family home.

    The results speak for themselves. Houston builds housing at 14 times the rate of peers like San Jose. And it isn’t just sprawl: In 2019, Houston built roughly the same number of apartments as Los Angeles, despite being half its size. Since reforms to minimum-lot-size rules were put in place in 1998, more than 25,000 townhouses have been built, overwhelmingly in existing urban areas.

    To be clear, Houston has made its share of planning mistakes. But, free of zoning, the city can constantly remake itself. That Houston is now one of the most affordable and diverse cities in the country is no accident.

    The relationship between housing affordability and constraints on development is a well-documented one. If you want more affordable housing, you generally want fewer, rather than more, constraints on delivering new housing.

    But as I was reading through the article, I couldn’t help but think more specifically about the relationship between sprawl and affordability. Because it is also true that, for a variety of reasons, the former has tended to help the latter (or at least coincide with it), which is why Gray felt it was important to say “and it isn’t just sprawl” when talking about Houston.

    Part of this relationship has to do with the fact that expansionist development tends to be of the low-rise stick-built varietal, which is a relatively cost effective way to build. Whereas the higher density infill stuff tends to be built using more expensive materials like reinforced concrete. But of course there are many other factors at play, including lower land costs.

    So I think one really interesting question is this one here: To what extent could we break this relationship between sprawl and affordability with what Gray is advocating for? In other words, how cheap could we make new infill housing in our older cities if we were to greatly loosen zoning controls or possibly even remove them all together?

    I don’t know the exact answer, but I know that directionally it would be better.

  • Three in four Americans believe it’s better for the environment if houses are built farther apart

    Living in a low-density place with lots of greenery and open space can feel like a pretty “green” way to live. Maybe you’ve even got a little garden where you grow delicious tomatoes. And indeed, a lot of people seem to think this is the case. According to this recent YouGov poll (which surveyed 1,000 Americans), 75% of US adult citizens believe that “it’s better for the environment if houses are built farther apart.” The number drops slightly to 68% for Democrats, but we’re still talking about a clear majority.

    Most experts will tell you that the opposite is, in fact, true. One of the best ways to be green is to live in a high-density urban setting and get as far away as you can from the natural environment so that you don’t screw it up. There are multiple reasons for this, but it generally comes down to the fact that cities use land and other resources far more efficiently on a per capita basis. Smaller living spaces, fewer cars, more things that are shared, and so on.

    The reason why this isn’t so obvious is that per capita thinking is perhaps harder to grasp. Living in the countryside certainly feels more green than living in the middle of New York City. But what if the 8.5 million or so people in New York City suddenly decided to sprawl outward into the countryside to consume more housing (that would then need to be heated and cooled), and then started driving everywhere (in lieu of taking transit, cycling, and walking)?

    This would be a less green outcome. It’s about the collective here, not what feels nice and green for any one individual.

  • New land development across the US between 2001-2019

    The Washington Post just published this interactive feature showing new developed land (i.e. urban sprawl) across the US between 2001 and 2019.

    It is based on these land cover maps which were published by the US Geological Survey earlier in the summer. Their findings show that between 2001 and 2019, more than 10% of the land cover in the lower 48 states changed during this time period. Mostly in forested areas.

    The WP feature allows you to search by city/address and I would encourage all of you to try it out. As an example, here is Salt Lake City. The gray areas represent land that was already developed in 2001. The purple areas represent land that was developed sometime between 2001 and 2019.

    Images: Washington Post

  • Intraprovincial migration across the Greater Toronto Area

    This is a chart from a recent blog post by Ryerson University’s Centre for Urban Research and Land Development. It shows net intraprovincial migration across the regions of the Greater Toronto Area. And what you are seeing here is people moving from expensive and built-up areas like the City of Toronto and the Region of Peel to lower cost areas further outside of the city.

    This is interesting for a couple of reasons. One, it’s very much a natural market outcome. Many people tend to “vote with their feet” and look for greater housing affordability. And two, this is a trend that existed prior to COVID-19. It is not the death of cities. In the words of Ryerson’s CUR, it’s about people looking for more affordable lower-density housing.

    But to what extent is “lower density” the key deciding factor? In other words, how much of this is consumer preference and how much of this is people being forced out by a lack of infill housing supply?

  • The Great Dispersion

    It’s that time of year again. It’s time to make predictions for the upcoming year and time to look back on the ones we all got wrong from a year prior. I don’t recall many people (if any) predicting that a pandemic would cripple the global economy.

    I like how Scott Galloway put it in his 2021 predictions post. It’s obviously better to be right than wrong, but it’s okay to be wrong. The value in writing down your thoughts is that it forces you to think. It’s the reasoning that matters. (It’s one of the reasons why some people write blogs.)

    A key theme in Galloway’s predictions post is something that he calls “The Great Dispersion.” This involves two things: (1) The physical distribution of products and services over wider areas and (2) the bypassing of gatekeepers and other intermediaries (which is something the internet has always been good at).

    You could interpret this as being directly antithetical to cities. Urbanism, after all, is all about agglomerations. But I think it’s more nuanced that that. Cities have generally always had both centralizing and decentralizing forces. The two can co-exist.

    I will get into this in more detail in my own 2021 predictions post. But in the mean time, I would encourage you check out what Scott Galloway recently published, over here. And if any of you have any thoughts about what’s in store for us in 2021, please leave a comment below.

    Don’t worry, it’s okay if you’re not right.

  • Atlas of Urban Expansion

    Since 2012, a team at New York University has been working on something called the Atlas of Urban Expansion. What they are doing is collecting and analyzing data related to the quantity and quality of urban growth around the world. Everything from population densities to how well the streets were laid out during each geographic expansion.

    The Atlas defines a city as having at least 100,000 people, which is a commonly used benchmark. According to this definition, there were 4,245 cities on the planet as of 2010. Included in their study is a representative sample of 200 of them, all of which can be found here.

    They are also, rightly, looking at each city in terms of its extrema tectorum — the limits of its built-up area. This is as opposed to using administrative boundaries, which wouldn’t be as relevant in a study like this.

    I really like the animations that they created depicting urban growth from 1800 to 2014, because they show: (1) where each city started (the dark nucleus); (2) how different urban shapes emerge as a result of geography, transport, and other factors; and (3) how land consumptive many of our cities have become in recent years.

    Image: Atlas of Urban Expansion

  • Fastest growing large cities in the US

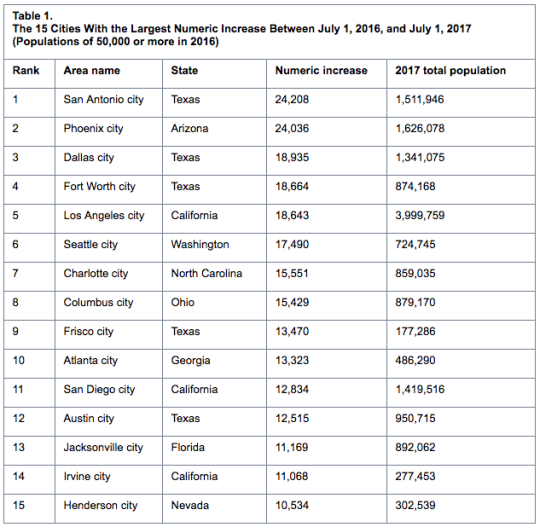
    Last week the US Census Bureau released its 2017 population estimates for the largest cities in the country. All of the figures are for the city itself and not the broader MSA or some other boundary.

    Here are the top 15 cities with the largest numeric increases between July 1, 2016 and July 1, 2017:

    However, if we switch over to percentage increases, Frisco, Texas – which is part of the Dallas-Fort Worth metro area – jumps up to number one with an increase of 8.2%. 

    In fact, the top 3 cities (on percentage basis) are in Texas and 10 of the top 15 cities are located in the South. That shouldn’t come as a surprise to many of you. Related post: Follow the sun and sprawl.

    However, if we only consider the 25 largest cities in the US, the fastest growing city on a percentage basis was Seattle at 2.47%. Number two was Fort Worth at 2.18%. And number three was Charlotte at 1.84%.

    New York City sits at 0.08%. And Detroit lost people. But it’s not a horrible figure (-0.35%). For more tables and data, click here.

  • The Great Recession only paused suburbanization

    According to newly released US census data for 2010-2017 – which Brookings analyzed here – the “back to the city” movement appears to have peaked in 2012. (This is something that we’ve looked at before on the blog.)

    Here is a graph from Brookings showing the annual growth rate for urban and suburban counties. Note how growth in the “urban core” peaked in 2012 and how growth in both the “emerging suburb” and “exurb” have increased since then.

    image

    The other finings from Brookings are that growth has slowed in large metropolitan areas (small metro areas and non metro areas, on the other hand are up) and that people are continuing to move from the Snow Belt to the Sun Belt.

    If you look at population gains and losses from 2016-2017 for the 100 largest US metro areas, the only Snow Belt gainers within the top 20 are New York (15th), Columbus (19th), and Boston (20th). Dallas, a Sun Belt city, was first with a gain of 146,000 people.

    So what’s going on? The narrative is that soon as the US economy and housing market recovered from the Great Recession of 2008, the trend lines simply reverted back to business as usual: sun and sprawl.