Daily insights for city builders, delivered every morning at 6 AM ET. I’m Brandon Donnelly — a Toronto-based real estate developer and founder of Globizen. I’ve been writing here since 2013.

Tag: san francisco

  • Is San Francisco losing its openness?

    Sam Altman has an interesting post up on his blog talking about what he feels is a changing cultural environment in San Francisco (which is where he is based). His argument is that heresies are good for innovation and for moving the world forward. We need people to question established norms. But for that to happen we need environments and cities that encourage it, or at the very least allow it.

    Here’s an excerpt:

    Restricting speech leads to restricting ideas and therefore restricted innovation—the most successful societies have generally been the most open ones.  Usually mainstream ideas are right and heterodox ideas are wrong, but the true and unpopular ideas are what drive the world forward.  Also, smart people tend to have an allergic reaction to the restriction of ideas, and I’m now seeing many of the smartest people I know move elsewhere.

    In San Francisco he is starting to feel that it is becoming increasingly difficult to have wacky ideas and to work on wacky startups. And for this reason, people are starting to leave the city in search of more open cultures. Openness used to be a hallmark of San Francisco. It was once the epicenter of counterculture. Has that changed?

    Here is a final excerpt:

    I don’t know who Satoshi is, but I’m skeptical that he, she, or they would have been able to come up with the idea for bitcoin immersed in the current culture of San Francisco—it would have seemed too crazy and too dangerous, with too many ways to go wrong.  If SpaceX started in San Francisco in 2017, I assume they would have been attacked for focusing on problems of the 1%, or for doing something the government had already decided was too hard.  I can picture Galileo looking up at the sky and whispering “E pur si muove” here today.

    Click here to read the full post.

  • New York is the only US city with an urban core growing faster than the suburbs

    The latest data from the American Community Survey (2012 to 2016) has placed the suburban and exurban share of the US population (53 major metropolitan areas) at 85.5%. Back in 2000 this number was thought to be around 83.5%.

    Since 2010, automobile oriented suburbs and exurbs have also accounted for 90.5% of population growth. The US – and Canada would be no different – is by and large a suburban nation. And the data suggests this isn’t about to change.

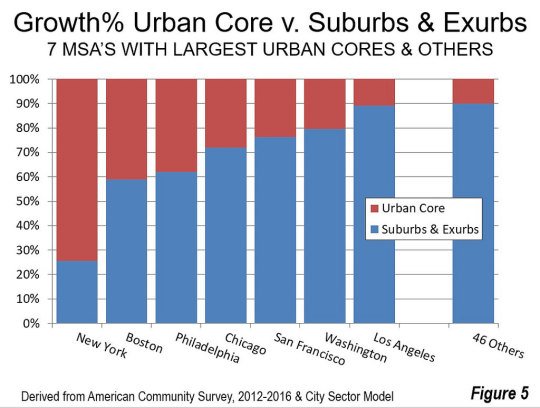
    The one exception is the New York metro area. From 2012 to 2016, 74% of its growth happened in the urban core. No other major metropolitan area in the US comes close to this sort of urbanity. Below is a chart from New Geography that shows you how NYC compares.

    All of the data for this post was also taken from New Geography.

  • Constructing the tallest building in San Francisco

    Alexis C. Madrigal recently published a piece about the Salesforce Tower in San Francisco called: The Tower at the Heart of the Tech Boom. At 61 floors and 1,070 feet, it is now the tallest building in San Francisco and the second tallest building west of the Mississippi River after the Wilshire Grand Center in Los Angeles.

    Hines and Boston Properties are the developers of the building. Pelli Clarke Pelli is the architect. And Salesforce is the anchor tenant. In April 2014, it was announced that they had leased 714,000 sf on floors 1, 3-30, and 61. (Get that top floor.) So almost half of the building.

    Perhaps not surprisingly, Madrigal calls the Salesforce Tower the “the most visible monument to the industry [tech] in the region and the country.” It is a demonstration of the power and reach of Silicon Valley. San Francisco has a new symbol. The TransAmerica Pyramid now feels inadequate.

    Though interesting, this is actually not what I want to talk about today. I’d like to talk about what it took to build such a tall building in a seismically active city like San Francisco. Unfortunately, this feels timely given that the sinking Millennium Tower is getting so much attention right now.

    The structural engineer for the Salesforce tower is Seattle-based Magnusson Klemencic Associates (MKA). They are a world-renowned structural and civil engineering firm that have been around since the 1920s. Other projects they are currently working on include the third tallest building in Chicago.

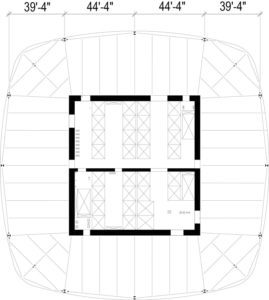
    The tower’s seismic force-resisting system is made up of reinforced concrete shear walls that surround the central elevator and exit stair core. These walls are 24 to 48 inches thick. Here is a plan taken from a STRUCTURE Magazine post written by Ron Klemencic of MKA:

    image

    The tower’s foundations have been well documented, or at least frequently mentioned, because of how deep they had to go down. The site has poor soil conditions (fill, sand, San Francisco “old bay clay”, and weak bedrock), and so given the weight of the tower the only option was to go down to bedrock – approximately 250 feet below grade.

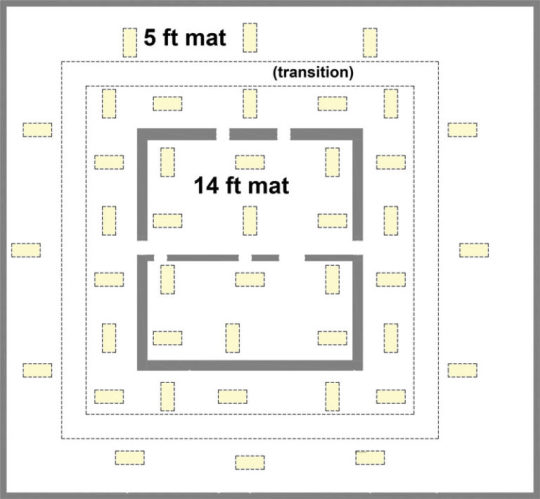
    The foundation system they ended up going with uses something called Load-Bearing Elements (LBEs). The typical LBE measures 5′ x 10.5′. The entire foundation system uses 42 LBEs and a mat foundation that varies in thickness from 14′ around the core to 5′ around the perimeter. (See image below.) The LBEs were brought down to rock. And in some cases, they went down more than 310 feet below grade.

    image

    As a condition of buying the site, the Transbay Joint Powers Authority required proof that any future tall building would not negatively impact the surrounding structures – including the adjacent Transbay Transit Center – and that it would perform under a Maximum Considered Earthquake (MCE) event.

    So while the tower itself may be a symbol for the new world, its structural system also achieves many firsts in terms of how to build a supertall in a seismically active region.

    Please keep in mind that I am not a structural engineer. I just pretend to be an architect sometimes. If you’re interested in more of the details, check out the post by Ron Klemencic. All of the above information was taken from there.

  • Geography is no longer destiny

    image

    The Q3 2017 Moneytree Report from PwC and CB Insights was recently released. It tracks venture capital trends in the US and globally. 

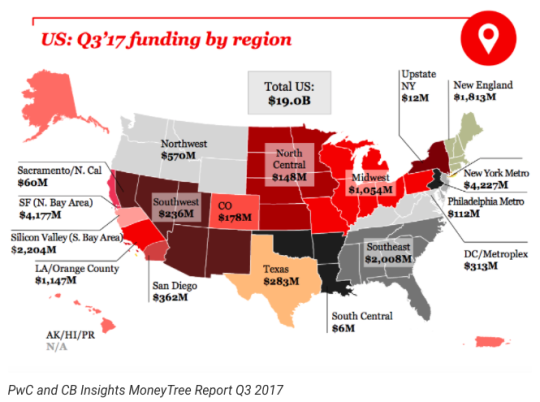
    Last quarter, US venture capital-backed companies saw $19 billion in total funding across 1,207 deals. Perhaps most notably for the US, funding in the NY metro area rose 57% to $4.227 billion and inched out the San Francisco Bay Area ($4.177 billion).

    But this was really because of two epic rounds to WeWork (NYC HQ) totalling around $2.5 billion. Also, Silicon Valley ($2.2 billion) is tracked separately to the San Francisco Bay Area in the report.

    Still, there’s a real sense that the New York tech ecosystem is on the rise and that it is probably furthest ahead in the US in terms of being able to catch up to California.

    Last week, MongoDB (NASDAQ: MDB) went public. Albert Wenger, who is an investor in the company, argued on his blog that this is an important milestone for technology companies based in New York. 

    It’s the first core technology company (instead of applied technology company) to go public in the city and it’s a big step forward in terms of demonstrating that “geography is no longer destiny.” 

    You don’t have to move to the Bay Area to win in tech.

  • How Trump’s tax plan would impact the mortgage interest deduction

    image

    In the US you can reduce your taxable income by deducting the mortgage interest you pay toward your principal residence. You can’t do this in Canada, at least not on the property where you live.

    However, there are limitations. It is capped at loans up to $500,000 or up to $1M if you’re married and you file jointly. On the other end of the spectrum, you also need a loan big enough such that an itemized deduction will save you more money than the standard deduction.

    Not surprisingly, the MID is popular among homeowners. And from a public policy standpoint, one of its selling features is that it’s supposed to stimulate homeownership. But many have argued that it doesn’t actually do this – it unequally benefits people with larger mortgages. (Canada has a higher homeownership rate than the US.)

    Right now it looks like you need to buying a home worth at least $305,000 in order for the mortgage interest deduction to make economic sense for you. Again, if your loan isn’t big enough, you’re simply going to opt for the standard deduction. 

    In 2015, about 22% of all US taxpayers opted to take advantage of the MID. According to Zillow, only about 29% of all homes in the US are valuable enough for the MID to actually make sense. Though in some cities, like San Francisco, it’s pretty much all of the homes. Of course.

    Zillow also recently looked at what the recent tax reforms put forward by the Trump Administration would mean for the MID and the real estate market

    One of proposed changes is a doubling of the standard deduction. What this means, based on Zillow’s math, is that you would need to be buying a home worth at least $801,000 today for the MID to make sense. This also means that the deduction would now only benefit about 5% of all homes in the US.

    This would seem to only exacerbate the criticism that the MID does not in fact stimulate homeownership in the segment of the market that needs it the most. But perhaps this is the only politically palatable way of removing it – gradually.

    Photo by Erol Ahmed on Unsplash

  • Superstar or bubble?

    “The term “bubble” refers to a substantial and sustained mispricing of an asset, the existence of which cannot be proved unless it bursts.” – UBS

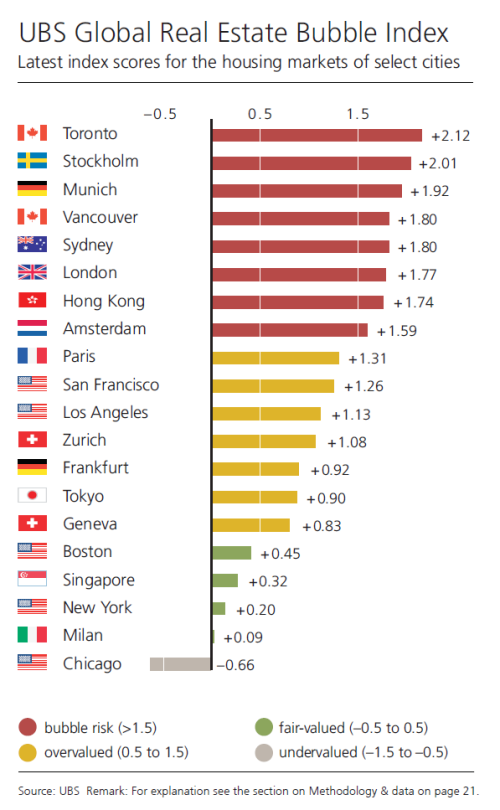
    Last week UBS released its 2017 Global Real Estate Bubble Index. At the top of the list was none other than Toronto, followed by Stockholm, Munich, Vancouver and Sydney. And at the bottom of the list was Chicago – a city that UBS feels is undervalued.

    Here is the full list of index scores:

    image

    The UBS index is a weighted average of the following five sub-indices:

    1. Price-to-income
    2. Price-to-rent (fundamental valuation)
    3. Change in mortgage-to-GDP ratio
    4. Change in construction-to-GDP ratio (economic distortion)
    5. Relative price-city-to-country indicator

    If you look at their price-to-income benchmark in isolation, Toronto drops down to the middle of the pack along with Geneva and San Francisco. Hong Kong, London and Paris sit at the top with the most unaffordable housing. 

    Still, UBS credits “an overly loose monetary policy”, foreign demand, tight zoning, and rental market regulations for the eroding housing affordability in Toronto and Vancouver.

    One of the challenges, of course, is that the capital flowing into real estate is not all local – it’s also global. And many cities around the world are seeing high price-to-income multiples, perhaps because of that. 

    So exactly how much decoupling from local fundamentals should now be considered reasonable in our globalized world? And to what extent is this a result of “superstar economics?”

    Here’s an excerpt from the UBS report:

    The economics of Superstars explains why, in some professions, show business for instance, “small numbers of people earn enormous amounts of money and dominate the activities in which they engage.” By analogous reasoning, prices in the most attractive cities are expected to outperform average cities or rural areas in the long run. Hong Kong, London and San Francisco are exemplars of this theory.

    The intuition is that the national and global growth of high-wealth households creates continued excess demand for the best locations. So, as long as supply cannot increase rapidly, prices in the so-called “Superstar cities” are supposed to decouple from rents, incomes and the respective countrywide price level.

    I guess this is one of the reasons why bubbles are proven after the fact. If you would like to download a copy of the full UBS report, click here.

  • The public life data protocol

    The Gehl Institute has just launched (in beta) something called the Public Life Data Protocol. It was developed by the Institute, as well as by Gehl (the practice), the Municipality of Copenhagen, the City of San Francisco, and Seattle’s Department of Transportation.

    The goal of the protocol is to improve the way in which we collect, share, and compare public space information. It is about improving public life in public spaces.

    To do this, they have proposed a series of metrics that measure everything from “posture within the space” to “objects brought into the space.” They also propose spatial metrics that help to analyze public life in relation to its physical context.

    Gehl is a real leader in this space. I commend them on opening up their methodology and working to create “a common language for people data.” Great data will only help us to build more human-centered cities.

    To download a full PDF of the protocol, click here

    Photo by Thaddaeus Lim on Unsplash

  • Why I write about tech on my city building blog

    I had a friend ask me this week about how I decide what to write on this blog. His comment was that I tend to write about a variety of different topics. He wondered: Isn’t it better to focus on one particular niche?

    The simple answer is that I write about what interests me. And secondary to that is any concern around what will get the most clicks. In fact, I try not to fall into the trap of worrying about the latter. Sometimes it can be paralyzing to fixate on what will appeal most to the tens of thousands of people who read this blog on a regular basis.

    The reality is that my interests are much broader than, say, just design and real estate; though these two topics are clearly central. 

    I learned a long time ago while studying architecture and art history that what we make as a society is generally a product of the cultural milieu at the time. In other words, the built environment doesn’t happen in a vacuum. It is the physical manifestation of what we believe to be true at a particular moment.

    Today, it’s pretty hard to ignore the importance of tech. Think of some of the most valuable companies in the world right now: Apple, Google, Amazon, Facebook, and so on. Now, technology has always shaped our cities, but what makes this moment different is the decisive shift toward software.

    It’s arguably no longer about who can build the best mousetrap. It’s about who can build the best software layer on top of that mousetrap.

    In 2011, venture capitalist Marc Andreessen (previously the co-founder of Netscape) published a widely shared essay called, “Why Software Is Eating the World.” And over the past 6 years he has been proven to be very right.

    The 3 main points he aimed to make with that essay are as follows:

    1. Every product or service that can become software will become software.
    2. Every company will have to become a software company.
    3. The winning companies will be the best software companies.

    Depending on your industry, this may sound ludicrous to you. Certainly in 2011 it probably seemed that way. 

    But a perfect example of this phenomenon is the iPhone. The phone itself is manufactured in China, albeit where a lot of great hardware innovation is taking place. 

    But at this point, phones have become fairly commoditized. The profits that Apple makes from the iPhone disproportionately come from the software layer and the app ecosystem it has developed.

    You could make a similar argument with Tesla. Autonomous navigation – which most of us can agree will have a profound impact on cities – is largely a software challenge. 

    And so if you believe that autonomous vehicles will be a fundamental part of the future of mobility, then it’s not that hard to believe in point number three: the winning car company will also have to be the best car software company.

    Some industries have been less touched by tech and software – real estate being one of them. But if Andreessen is right and it’s not a question of if, but a question of when, then it behooves all of us to think about the potential impacts.

    I love how Andreessen ends this podcast discussion with Barry Ritholtz of Bloomberg and so I’m going to repeat it here to close out this post. He says: “There are no bad ideas. There are only early ideas.” 

    And that’s why I write about tech on my city building blog.

    Photo by Michal Pechardo on Unsplash

  • North America’s second city?

    image

    Over the weekend Richard Florida sent out a tweetstorm that compared Toronto and New York City, and made the argument that Toronto’s “incredible diversity, density, and industry mix” is making the city feel a lot more like New York and London compared to any other North American city. 

    He even went so far as to say that, even though it may not be the bigger metro in terms of raw population, Toronto increasingly feels like North America’s second city after NYC. I’m obviously incredibly biased in this discussion, so I would be curious to get your thoughts in the comment section below.

    If you can’t see the embedded tweetstorm below, click here. Regardless, you’ll likely need to click through to see the entire thread.

    //platform.twitter.com/widgets.js

  • International and domestic migration in the US

    In response to President Trump’s proposed immigration bill, Brookings recently analyzed census data from earlier this year to demonstrate the importance of immigration for growth within much of the United States. 

    I’d like to share three tables from their analysis.

    The first two look at international migration grains and domestic migration gains over the last 3 decades (the last decade isn’t quite a decade).

    Here you can see that New York, Los Angeles, and Miami (all port cities) have dominated international migration to the US since 1990. But at the same time, international migration has become less geographically concentrated. From 1990-2000 the top 5 cities received almost half of all immigrants moving to the US. More recently, that number has dropped to 34%.

    Domestic migration is different in that it’s a zero sum game. When one US city gains, another US city loses. Here there is a very clear migration trend toward cities in the southwest – arguably because of weather, job growth, cheaper housing, and probably a bunch of other factors.

    If we look at actual international and domestic migration numbers over the last 6 years, the 12 largest metropolitan areas look like this:

    The key takeaways here are that 8 of these cities are losing people to domestic migration and only 7 of these cities have a positive net migration number – meaning their population is actually growing.

    What is clear is that the international migration column is a pretty important one if you believe that growth is valuable. 

    If you’re Dallas, Houston or Atlanta, maybe you care a little less about that column. But for most of the other cities, international migration is either the only way you’re growing (look at Miami go) or keeping your population losses in check (see Philadelphia).