Daily insights for city builders, delivered every morning at 6 AM ET. I’m Brandon Donnelly — a Toronto-based real estate developer and founder of Globizen. I’ve been writing here since 2013.

Tag: population density

  • Invisible walls

    image

    This is an interesting working paper by a team of researchers at NYU’s Marron Institute of Urban Management. The paper examines the relationship between urban density and organized violence, first in Colombia and then within a sample of 200 global cities.

    The finding is that organized violence actually increases the population density of the surrounding areas within a city because it creates a kind of “invisible wall” – effectively a no-go zone.

    This makes perfect intuitive sense, but it’s not something I ever considered. Geography and other natural constraints typically drive density. Think about the island of Manhattan. But so too can invisible walls.

    For the full working paper, click here.

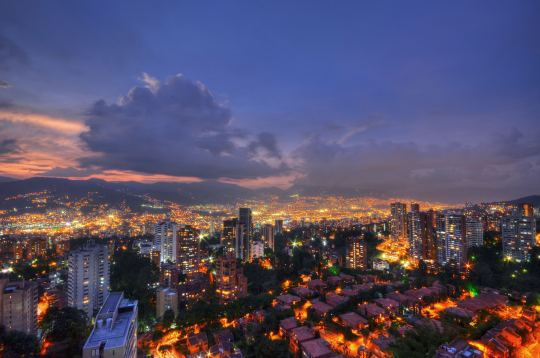
    Photo by Joel Duncan on Unsplash
  • New York and Toronto population densities compared

    Today I came across this Reddit talking about how few census tracts there are in the United States with a population density greater than 150,000 people per square mile. 

    Basically, there’s a bunch in New York, one in San Francisco (Tenderloin), and one in Chicago that doesn’t really count because it’s an unusually small tract. Most other American cities don’t even come close.

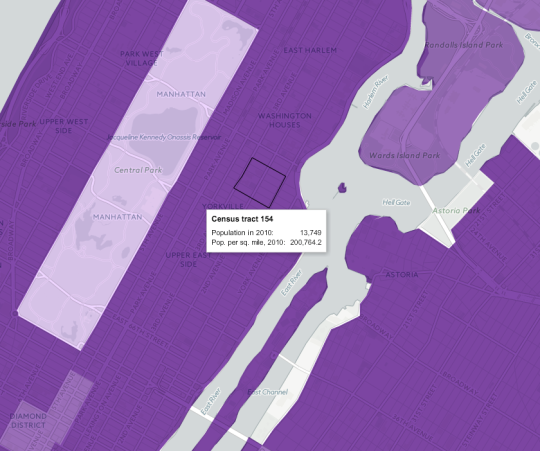
    Looking at this New York Times mapping of the 2010 US census data, it turns out there are neighborhoods in NYC that go well beyond 150,000 people per square mile. Here’s one census tract (#154) at just over 200,000 ppsm:

    If you convert 200,764 into the globally accepted standard for measuring distances and areas, you get approximately 77,515 people per square kilometer. Pretty dense.

    As a comparison, I thought I would see how this number stacks up against what is commonly referred to as the densest neighborhood in Canada: St. James Town

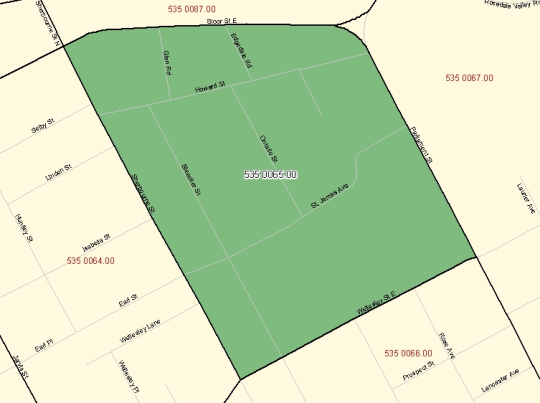
    If you pull up that geographic code in the 2011 Canadian census data (#5350065.00 in case you’re that nerdy), you’ll see a map boundary that looks like this:

    And you’ll also find a 2011 population density of approximately 60,915 people per square kilometer. Also pretty dense – though the population did decline from 2006.

    Now obviously St. Jamestown is only one example. The rest of the city is, by and large, far less dense. But maybe when our 2016 census data gets released next year, we’ll find that we’ve become even denser. I suspect we will.

  • Residential population densities compared

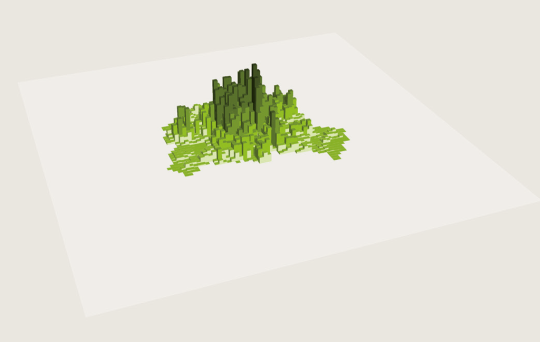
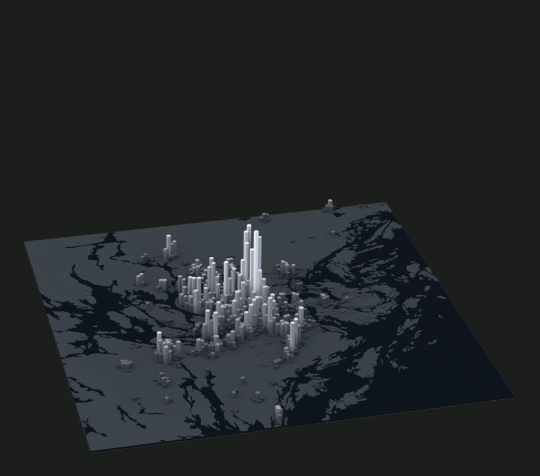
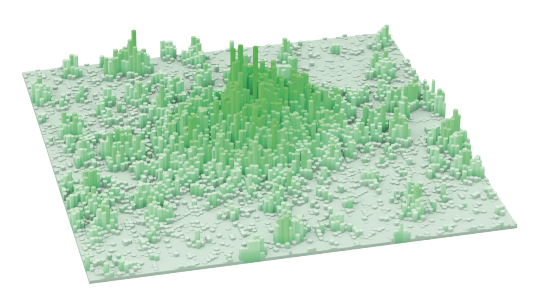
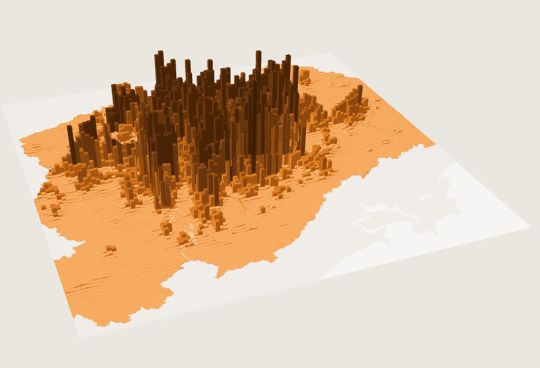
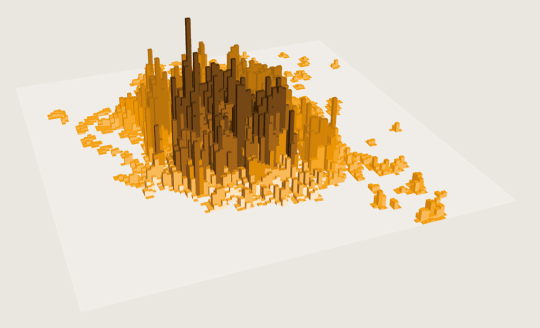
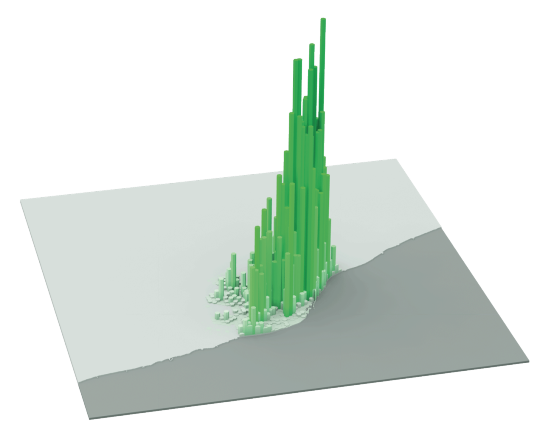
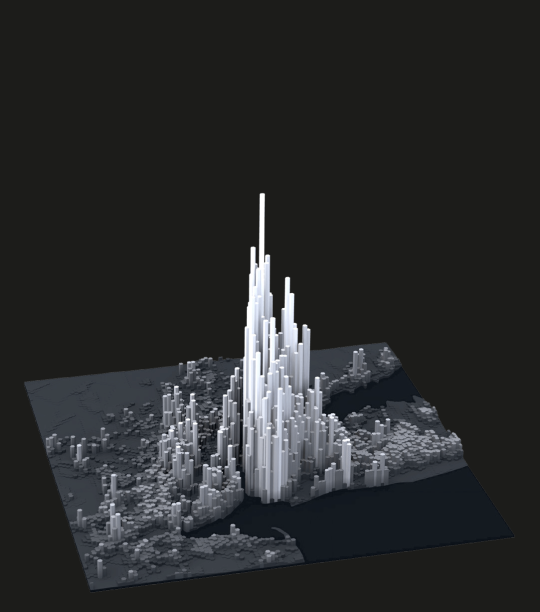
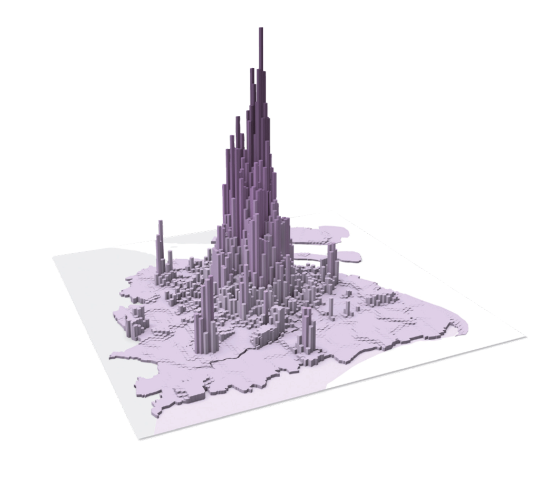
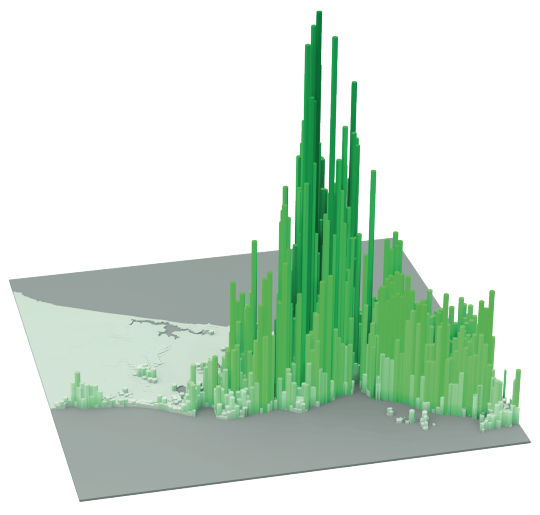
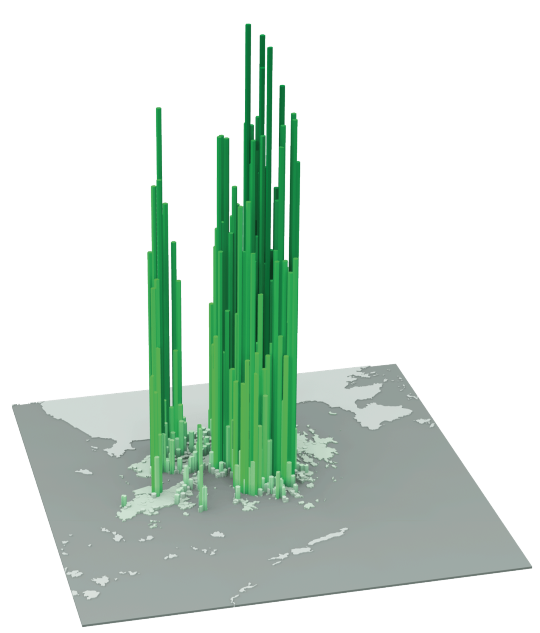
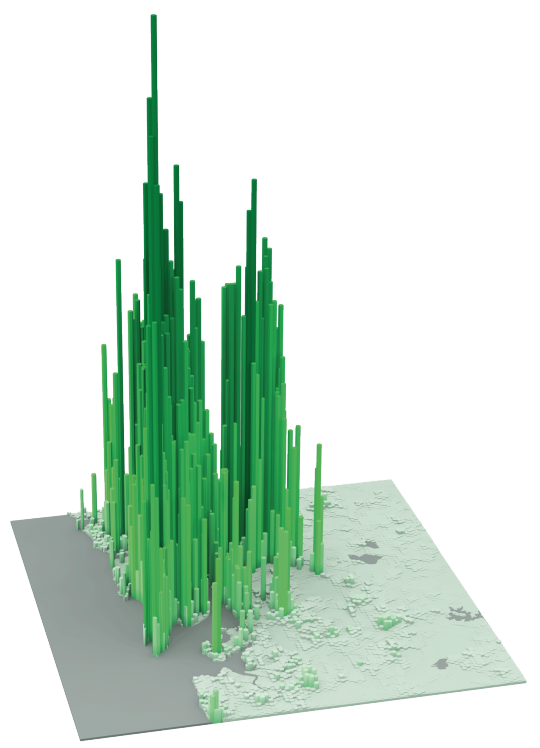
    The following diagrams were taken from LSE’s Urban Age website. I’ve sorted them from lowest to highest peak residential population density. In each case I’ve also included the year of the dataset. 

    It’s amazing how much these simple extrusion diagrams can tell you about the city. It also shows you that high population densities don’t necessarily need to equate to tall buildings. Barcelona, in particular, stands out for me.

    Berlin (Peak residential density: 21,700 people/km2, 2009)

    image

    Stockholm (Peak residential density: 24,900 people/km2, 2012)

    image

    London (Peak residential density: 27,100 people/km2, 2013)

    image

    São Paulo (Peak residential density: 29,380 people/km2, 2009)

    image

    Mexico City (Peak residential density: 48,300 people/km2, 2009)

    image

    Barcelona (Peak residential density: 56,800 people/km2, 2013)

    image

    New York (Peak residential density: 59,150 people/km2, 2012)

    image

    Shanghai (Peak residential density: 74,370 people/km2, 2011)

    image

    Istanbul (Peak residential density: 77,300 people/km2, 2013)

    image

    Hong Kong (Peak residential density: 111,100 people/km2, 2013)

    image

    Mumbai (Peak residential density: 121,300 people/km2, 2013)

    image

  • The future of Vancouver’s West End

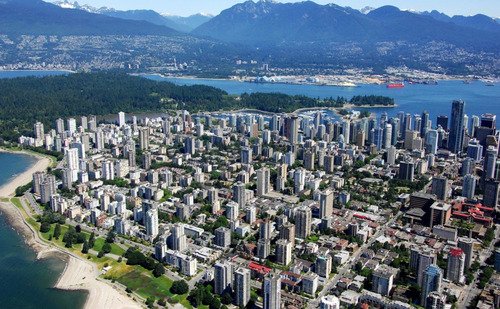
    Spacing Vancouver recently published an interesting look at Vancouver’s West End neighborhood. And it led me into a deep dive of the neighborhood’s recently adopted Community Plan (November 2013). So today I’d like to talk a bit about the neighborhood and also their plans for managing growth over the next 30 years.

    Officially established in 1969, the West End spent the next 3 decades as the most densely populated area of Vancouver. But starting in the 2000s with the development of high-rise condo towers in neighbouring areas such as Downtown South to the southeast and Triangle West and Coal Harbour to the northeast, the West End lost this position. Today it’s the 4th most densely populated neighborhood in the city.

    The bulk of the housing (77%) is in the form of apartments with 5 or more storeys. And 81% of residents are renters. This is well above the city average of 52% and is likely a reflection of the neighborhood’s younger demographic (25-29 years old is the largest segment) and its position as a landing ground for new Vancouverites.

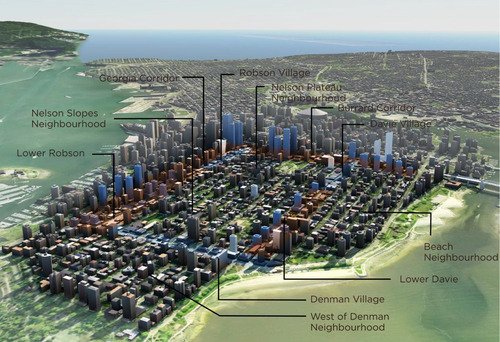
    But as a large central area with exceptional access to natural amenities, I would imagine that development pressures are and will continue to be significant. To plan for this growth, the city wants to intensify the central areas of the neighborhood with low-rise and mid-rise form and the periphery with high-rise towers. And already this is happening with developments such as the 62-storey Shangri-La Hotel.

    Here’s an image depicting their 30 year vision:

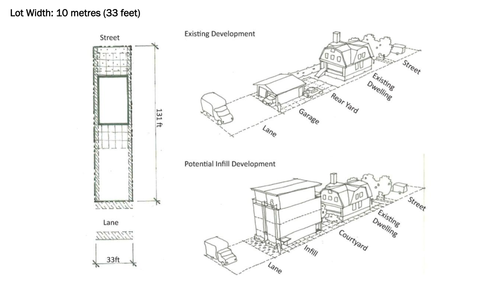
    But what stands out for me in the Plan is Vancouver’s continued commitment to laneway intensification. The Plan refers to it as “Laneway 2.0” and they specifically mention the opportunity to redevelop the West End’s wide laneways with “ground oriented infill housing.” Below is an example of how this could be done on a small residential lot, but the Plan also includes images for how the same might be accomplished on underutilized apartment building sites.

    Laneway housing is a topic I’ve written about extensively on ATC. Toronto is absolutely behind on this. And as I’ve argued before, we need to be looking at urban intensification across all scales, from low-rise to high-rise, if we want to create inclusive and vibrant cities. With the West End Community Plan, Vancouver seems to be doing just that.

  • Pick one or the other

    Two days ago I posted a neat interactive map of carbon footprints across America. It was taken from an Atlantic Cities article. But in the same post, I questioned the (Atlantic Cities) article’s headline and main assertion that increasing population density won’t help to curb greenhouse gas emissions.

    This didn’t make sense to me.

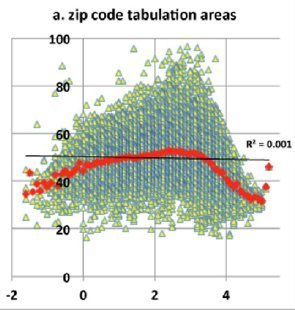
    Well it turns out that the supporting research data was slightly misinterpreted. According to the Per Square Mile blog, the UC Berkeley study associated with the interactive map reveals a more nuanced relationship between population density and carbon emissions. It turns out that people who live in the middle of nowhere (rural residents) actually have fairly low carbon footprints. Even though they’re reliant on cars, they tend to drive and consume relatively little.

    And so initially, as population densities increase, so do carbon footprints. That is until it reaches about 3,000 people per square mile. At that point, carbon emissions start to drop off dramatically—roughly 35% on average from suburb to city.

    Below is a graph I found in the comment section of the original Atlantic Cities article that demonstrates this phenomenon. Population density is on the x-axis and carbon emissions are on the y-axis.

    image

    So here’s the big takeaway. If you’re looking to optimize around your carbon footprint, you need to pick a side: Either be urban or be rural. But don’t be somewhere in the middle. Don’t be suburban.