Daily insights for city builders, delivered every morning at 6 AM ET. I’m Brandon Donnelly — a Toronto-based real estate developer and founder of Globizen. I’ve been writing here since 2013.

Tag: population density

  • Where the rich don’t drive — is density the new luxury?

    This data is from 2019, but I imagine that things would look pretty similar today and that it might even be a little more pronounced. The dataset from the above article looked at how many people have cars in a given area (a darker dot = fewer cars) and then plotted this against population density and income per capita.

    Here’s what that looks like for the regions of New York, Boston, Los Angeles, and Houston (data from 2013 to 2017):

    What is fascinating about these charts is that they show two different correlations. In dense and transit-rich cities such as New York and Boston, car usage is most closely linked with population density and not with income. The dark dots form a horizontal line near the top.

    However, in the case of Los Angeles and Houston, car usage is instead most closely linked with income and not with population density. The dark dots form a vertical line near the left — the lowest income per capita.

    So what does this tell us?

    It tells us that if you design a city to broadly require a car, then you are likely to sort people based on those that can afford a lot of car and those that cannot. On the other hand, if you design a city around transit, then you are likely to instead create a place where both the rich and poor get around in similar ways.

    There is also evidence that the latter is being increasingly viewed as more desirable. 2017 was the first year in the US where high-income young people (ages 26 to 33) drove less than low-income young people. Presumably these high-income people had choices, and so I tend to view this as a preference.

    As a whole, this is surely a good thing for our cities. But now I think we need to be careful not to allow density and walkability to become the new luxury that only the rich can afford.

  • We’re running out of land — or are we?

    The headline, here, is that “the US is running short of land for housing.” But if you read the article, you’ll see that the headline should probably read, “the US has land-use restrictions in place that make it unnecessarily difficult to build enough new housing.” Here’s an excerpt:

    Asking prices for homes in these new communities [the exurbs of Tampa] go as high as $900,000, in part because the land underneath is so valuable. That has a lot to do with land-use regulations.

    Tampa’s zoning rules prevent developers from building anything larger than a single-family home in much of the city. When officials for Hillsborough County, which includes Tampa, adopted zoning regulations in 1950, they said the measures were necessary to prevent overcrowding and traffic jams and would preserve the neighborhood character, all “with a view to conserving the value of buildings,” according to the regulations.

    If all you can build are single-family homes, then you’re going to need a lot more land compared to if you were allowed to build a bit higher and/or a bit denser. But it is a good way to ensure that supply remains somewhat scarce and that one is faithfully “conserving the value of buildings.”

    It is, however, worth mentioning that we have invented ways to use land more efficiently. The population density of Hillsborough County is somewhere around 1,200 people per square mile. The population density of Paris, on the other hand, is over 50,000 people per square mile.

    Somehow people still enjoy Paris.

  • Cars make cities less compact

    The relationship between car ownership and urban density is a fairly intuitive one. Below are two charts from a study by Francis Ostermeijer, Hans Koster, Jos van Ommeren, and Victor Nielsen, showing how urban density is inversely correlated with car ownership. In other words, the more people with cars, the less dense that a particular place is likely to be.

    But there’s an interesting chicken-and-egg question here. Does Atlanta, which is near the bottom right in the above chart, have a lot of cars because it wasn’t dense enough to support other modes of transport, or did the prevalence of cars in Atlanta cause the city to spread out and become less dense? And that is exactly what the above researchers set out to determine.

    To do this, they started by looking at the presence of commercial car manufacturers in the above geographies in the 1920s. One of the things they found was that having a car manufacturer in your city at this time appears to have had no effect on population density. But over the long run, rising car ownership seems to have had a sizeable effect on reducing population densities in those places.

    The conclusion they draw from this is the title of this post: cars have made cities less compact, rather than low population densities causing people to go out and buy more cars. This makes some sense to me because cities were doing just fine before we invented cars. But like all transportation innovations that allow us to move faster over longer distances, the car encouraged decentralization.

    There are, of course, all sorts of possible implications for a finding like this. But the authors specifically mention developing countries where car ownership may still be relatively low. This is something to be mindful of because if you put most people into cars, history strongly suggests that it will impact the kind of city that you end up building.

    Chart: Cars make cities less compact

  • Spiky population density maps

    I rediscovered the maps and work of Alasdair Rae this morning. (He has appeared on this blog before in posts like this one here.) Alasdair works in the Department of Urban Studies and Planning at the University of Sheffield and is author of the blog, Stats, Maps n Pix. Recently, he’s been publishing maps showing population densities around the world. He also gets into the details of how they’re made. They are pretty cool to see.

    Here are the Great Lakes.

    And here is Brazil, as well as a map of the world (without any land shown). Canada and the United States barely register on this second one.

  • The anatomy of density

    Urban environments can be dense in many different ways. This is a topic that we have discussed on several occasions here on the blog. But this working paper by Solly Angel, Patrick Lamson-Hall, and Zeltia Gonzales Blanco — called The Anatomy of Density — is a more scientific way of looking at it. They have come up with six measurable factors that, when combined, define urban density.

    What this means is that cities achieve urban density through different kinds of built form. Hong Kong, for example, gets its density from height, even though only about 4% of its land area is occupied by residential buildings. Dhaka, on the other hand, does it through low building heights and high residential coverage. Homes occupy about 20% of the city’s area. Another dimension is crowding.

    But here’s something that may surprise you. Most cities are actually becoming less densely populated. And, despite our best efforts to encourage more sustainable forms of development, sprawl has continued to outpace densification in the vast majority of the urban agglomerations that were studied as part of this working paper. The wealthier we become, the more space we want to consume.

    Here’s a graph from The Economist that speaks to this trend:

    To download a copy of the working paper, click here.

    Image: The Economist

  • Eliminating single-family zoning

    There is something happening in many North American cities right now. We are starting to question the supremacy of zoning for only single-family homes.

    This past summer, the state of Oregon passed policy requiring cities of 25,000 people or more to allow duplexes, triplexes, and fourplexes within their single-family home neighborhoods. Minneapolis is poised to do something similar with its Minneapolis 2040 plan (though it has been contentious). And, of course, here in Toronto we recently rolled out laneway suites all across the city. Small scale multi-family dwellings are also already permissible in some areas (though few are being built).

    Some are calling this a YIMBY movement. But however you want to define it, it’s an acknowledgement that, if the goal is to built up instead of out, perhaps it’s time we look at the parts of our cities with the lowest population densities. I would also add that following my recent post on Paris vs. Vancouver, many seemed to gravitate (in the comments) toward the Parisian model — even if it did result in over 50,000 people per square kilometer. Density, it would appear, is okay.

    While positive, it remains to be seen whether these policy changes will result in a meaningful increase in housing supply. And a lot of that will come down to the details. As I have said before on the blog, the math can be challenging on these sorts of smaller projects, which is why you have smart people proposing things like an “inverse density” rule to help encourage more smaller scale development.

    But as the saying goes, sometimes you need to crawl before you can walk. And, if nothing else, there’s certainly symbolic value to what seems to be taking hold across North America right now.

  • Paris and Vancouver population densities compared

    In this January 2018 report from the Fraser Institute, they pegged the average population density of Paris to be about 21,067 inhabitants per square kilometer (2014 population year). It is the second densest city in their report after Hong Kong, but the densest in Europe. By comparison, Vancouver sits at around 5,493 inhabitants per square kilometer (2016 population year).

    Now, these are of course city averages. Some neighborhoods will be higher and some will be lower. According to a January 2018 study by Alasdair Rae — who is a works in the Department of Urban Studies and Planning at the University of Sheffield — these are the most densely populated square kilometers across Europe (or at least within the 39 countries that he looked at).

    Paris, once again, comes in near the top with a peak density somewhere around 52,218 inhabitants per 1km square. The square in question is in the neighborhood of Goutte D’Or. And the only square within the study to come in denser is one from the L’Hospitalet de Llobegrat in Greater Barcelona (53,119 inhabitants per square kilometer).

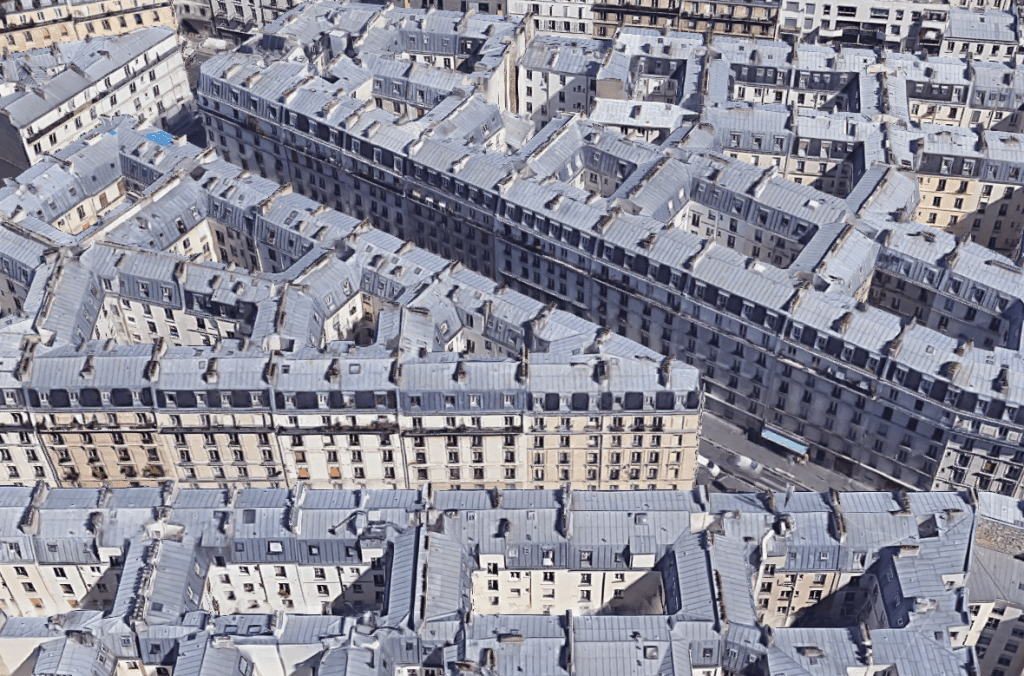
    Now let’s take a look at how these sorts of densities actually manifest themselves. Below is an aerial capture from Google Maps showing a section of Goutte D’Or in Paris. The buildings are all pretty much 7 storeys (mid-rise), but the blocks are mostly filled in. Lots of interior courtyard apartments. This is one way to get to over 50,000 people per square kilometer.

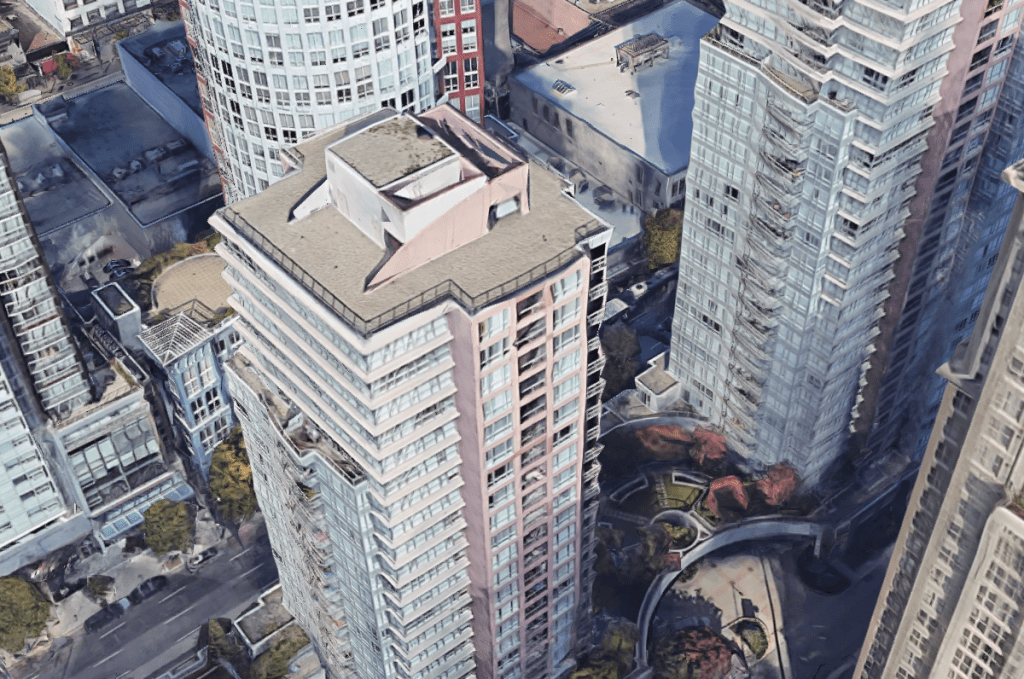
    Returning to Vancouver as a point of comparison, below is an aerial capture from downtown Vancouver at exactly the same scale as the Paris capture. I couldn’t find a density map of downtown, but it’s probably safe to assume that it’s greater than 5,493 and a lot less than 52,218 residents per square kilometer.

    What you see here is typical Vancouverism. Lots of slender point towers, careful tower positioning and spacing, and generally low podiums. It is a perfect demonstration that height and density do not necessarily correlate. It is possible to have low buildings and high density, which is something that Europe obviously does very well.

    But here’s the important question: In which of these two examples would you rather live? Please leave a comment below.

  • Transit investment & density (in San Francisco)

    This recent Streetsblog article about the possibility of turning the M Ocean View line in San Francisco into a kind of subway is a good reminder about the always important connection between transit investment and density. The question I always pose to myself is, “If I were a private company deciding where to spend the money on a new and expensive subway line, what would I look for?” Most of us recognize that population and employment densities would be near, if not at, the top of the list.

    Of course, if the company were fully private, then we would run the risk of low-density / unprofitable areas of the city not being serviced by transit. For a variety of reasons, that’s not an ideal outcome, which is why transit operators are mostly subsidized. The challenge is that the way we plan transit in most — or all? — cities has become so highly politicized today. That’s how we end up with the wrong transit technologies in areas that don’t have the density to properly support them.

    Now, I don’t know the specifics of the M Ocean View line. (Maybe some of you do and will provide those thoughts in the comments below.) So this is not a post about what may or may not be appropriate in this particular instance. But it is a commentary on the importance of fiscal prudence and sound transportation planning.

    Photo by Lance Anderson on Unsplash

  • European-style height, but not density

    As I wrote about last month in this pithy post, the relationship between building height and density are often misunderstood. They mean different things and so the implications for our cities can also be vastly different.

    I woke up this morning to a couple of tweets by John Michael McGrath that I think hit the nail on the end with respect to this duality. If you can’t see them below, click here.

    https://twitter.com/jm_mcgrath/status/1105500872979742720

    Paris is known, and largely celebrated, for its “European-scaled” mid-rise buildings. But as John points out, these buildings often line narrow streets (see above). They are typically also built across large blocks with compact internal courtyards and with few setbacks and/or stepbacks. The combined result is that Paris is one of the densest cities in Europe. It has mid-rise at scale.

    The North American context is quite different. The large majority of our land is usually reserved for low density housing. (Here in Toronto this land has been nicknamed the “Yellowbelt.”) We have a policy context that only allows intensification in select places, and that can create pressures to build up. It’s a bit like squeezing a closed tube of toothpaste.

    In 2012, Eurostat ranked Paris as the densest city in Europe with an average population density of approximately 21,516 people per square kilometer. Whereas, according to Wikipedia, the population density of metro Toronto was around 5,905 people per square kilometer in 2016.

    What is it, again, that we love so much about Paris?

  • The disappearing urban advantage

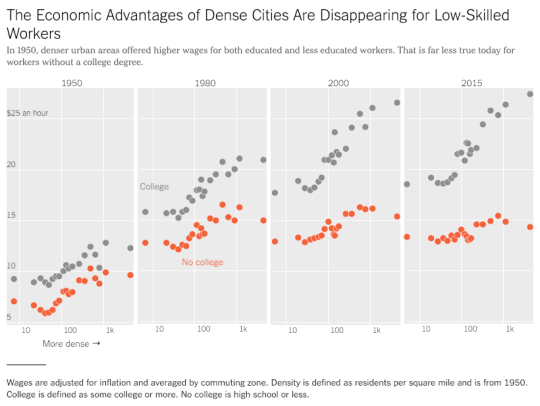
    The New York Times has a recent article up talking about the disappearing “urban advantage” for low-skilled workers. It is based on the work of MIT economist David Autor.

    Here is a chart from the article plotting wages against population density from 1950 to 2015:

    image

    The clear takeaway is that dense urban centers remain a place where wealth is created – but you probably need a college degree.

    The economic advantages of dense cities for those without one appears to be disappearing. The labor market has diverged.

    Interestingly enough, David’s research also suggests that college graduates may be starting to abstain from the suburbs – even when they have kids.

    And that’s because the returns to being in the city are so great.

    For the full NY Times article, click here