Daily insights for city builders, delivered every morning at 6 AM ET. I’m Brandon Donnelly — a Toronto-based real estate developer and founder of Globizen. I’ve been writing here since 2013.

Tag: new york

  • A brief history of Times Square

    From 1899 to 1902, the north side of 42nd Street, between 7th Avenue and Broadway in Manhattan, was occupied by the Pabst Hotel. At the time, this neighborhood was called Longacre Square.

    Owned by the Pabst Brewing Company of Milwaukee, the building was part of a growing network of hotels and restaurants that the company used to promote its beer. Note the cool rooftop sign.

    The portico you see in the above picture was highly controversial. I guess some things never change. City officials were criticized for allowing such a structure to encroach over a public right-of-way. Curiously, the Times was one of its biggest critics. A judge ultimately ordered for it to be removed in 1901.

    The building also came down not long after. The introduction of New York City’s first subway — operated by the private Interborough Rapid Transit (IRT) Company — began to spur new investment in the area. The first IRT line ran right through Longacre Square.

    Adolph S. Ochs was the owner of the The New York Times during this period and he believed that the new subway line would increase foot traffic in the area. Betting on transit is clearly not a new phenomenon. So in January 1905, the newspaper moved into a new headquarters on the site of the former Pabst Hotel; a building that it developed for itself.

    Today this building is known as One Times Square. Here is a photo of it under construction in 1903:

    And here is a photo of the completed building in 1919 (at this point, it was no longer occupied by the paper):

    At the time of its completion, it was one of the tallest buildings in New York City. And eventually, perhaps as a result of some encouragement on the part of Ochs, Longacre Square was renamed to commemorate this new building and the paper. It became known as Times Square.

    By 1913, the Times had outgrown the building and would move down the street. But not before it would introduce a now famous New Year’s Eve celebration in the Square. The Times would continue to own the building up until 1961.

    The area continued to evolve into an important theater district and transit hub. Everything connected through Times Square. Sadly, the Great Depression was not kind to the area and, either because of it or alongside it, Times Square declined into an area of vice filled with everything from burlesque shows to prostitution. This would come to define the area for almost the balance of the 20th century.

    It would take many attempts starting in the 1980s to try and redirect Times Square’s now entrenched reputation. In 1982, the Department of City Planning created the Special Midtown Zoning District, which attempted to attract developers with tax breaks and other subsidies. It didn’t really work.

    The City eventually looked to eminent domain to try and tidy up the area. But property owners — many of whom owned the adult businesses in the district — objected via a group known as the Coalition for Free Expression.

    It would take a few other mayors, many legal battles, and interim ordinances such as the 60/40 rule — which allowed adult businesses to continue operating as long as no more than 40% of their floor area were allocated to sex — before things would really change.

    Today, or at least as of 2015-2016, Times Square represents 15% of New York City’s total economic output. And it does this via 0.1% of the city’s total land area and 7% of its total employment.

    Real estate in the district is estimated to be worth over $7 billion, with the Square generating about $2.5 billion in municipal tax revenue and about $2.3 billion in state revenue. A lot has changed in more than a century. But perhaps most importantly, the portico came down.

    For more on Times Square, check out the Times Square Alliance.

    Archive Photos: Wikipedia

  • Only the rich can afford this much nothing

    Joshua Levine’s recent (WSJ Magazine) piece on John Pawson, — the architect who “elevated nothingness to an art” — is a good read.

    It’s mostly about the country retreat that he recently completed for himself and his wife in the English countryside, but there’s also lots about his minimalist architecture, his career, his work with hotelier/developer Ian Schrager, and his passion for photography.

    I like this bit about architectural simplicity. The great irony of minimalism, and the reason why brands such as Calvin Klein and Jil Sander began working with John Pawson to leverage his aesthetic, is that it’s often more difficult to do less. Getting the details right costs money. Hence this great line from the New Yorker:

    As the New Yorker cartoon put it, “Only the rich can afford this much nothing.” Don’t expect a rebuttal from Pawson. “It is big, and it is expensive, you know. It’s sophisticated architectural simplicity. This isn’t a religious thing, and it isn’t as simple as you can go. You can go a lot simpler than this.”

    I also like what the following says about labels and what it means to be defined as something:

    Slowing down for Pawson isn’t all that slow. He takes photos constantly and has always used the camera as his third eye. In 2017, Phaidon published Spectrum, a book of his photos, many of them first posted on his Instagram (“I said, ‘Well, I’m not a photographer,’ and they said, ‘You are a photographer,’ so now I’m a photographer”).

    Click here for the rest of the article from WSJ Magazine. And if you aren’t familiar with John Pawson, here is his minimal website.

    Photo: Max Gleeson (Armonia Apartments designed by John Pawson)

  • Using tweets to measure social connectedness in cities

    This recent study used geotagged tweets to measure social connectedness within American cities. There are two measures: (1) concentrated mobility and (2) equitable mobility. The first measures the extent to which social connections (geotagged tweets) are concentrated in a set of places within the city. And the second looks at the degree in which people move between neighborhoods in roughly similar proportions. These measures are the y-axis and the x-axis, respectively, in this graph:

    So how do you read this chart?

    Well if you look at New York, you’ll see that it is relatively high in concentrated mobility, but the lowest in terms of equitable mobility. This means that social connections are highly concentrated and that there’s low connectedness to other neighborhoods within the city. Miami, on the other hand, is the opposite. It’s also an outlier. Few hubs. But its social connections appear to cross neighborhoods and spread across the city.

    Perhaps not surprisingly, the study found that the size of a city seems to have the biggest impact on social connectedness. Which makes sense — it becomes harder to get around and so people start to localize. I am reminded of this whenever my friends in Los Angeles tell me they never go to the beach because it’s simply too difficult and too time consuming to get across the city.

    This also became clear to me after I started playing around with the Moves App back in 2015. The app no longer exists, but it was an activity tracker that allowed you to map where you, well, moved. And the more time you spent in one place, the more concentrated the activity would become. They depicted this through larger and larger circles. Example maps, here. My maps revealed that I need to branch out into different neighborhoods more often.

    To download a full copy of the study, click here.

    Chart: CityLab

  • Fees on homes

    A colleague of mine sent me this Bloomberg article today and said, “Here’s an article about things you already know.” The article cites a recent report by Altus Group that compared government-related fees on new housing across Canada and the U.S. What they discovered will not surprise any of you who are in the industry: Toronto has some of the highest government-imposed charges on new homes.

    For new condo apartments, the report found that government charges can add up to as much as C$124,582 per unit. That’s about 50% higher than the average unit in the U.S. and about 30% higher than the average unit in Canada (see above chart for the list of cities). While all of us in the industry can appreciate this, I don’t think most homeowners and tenants understand this. Hopefully they’re reading this post.

    Chart: Bloomberg

  • Fall architecture preview

    The New York Times’ fall architecture preview is centered around a pretty important and relevant theme, namely the relationship between the built environment and the natural one.

    Some of the projects that they profile include Dock 72 at the Brooklyn Navy Yard, which was raised up in order to lift it out of a floodplain; the “solar carve” tower by Studio Gang, which was designed to prevent shadows from casting along the adjacent High Line (pictured above); and the recently completed Casablanca Finance Tower by Morphosis.

    This last one, pictured below, uses thick aluminum beams to shade the building. That’s a pretty important feature in North Africa.

    Photos by Nic Lehoux and Hakim Wiseman Joundy (via the New York Times)

  • Prime residential pricing in 10 global cities

    The below graphs are taken from a recent (June 2019) report by Knight Frank on “prime” residential pricing across the world. They define “prime” as generally being the top 5% of each market by value. What these graphs show are the spread between the average price of a prime property and the top price achieved in that market.

    The most expensive market is Hong Kong. The average price of a prime property in 2018 was USD 4,251 per square foot (or USD 45,760 per square meter) and the top price achieved was in 2016 at USD 28,154 per square foot (or USD 303,051 per square meter).

    Using the 2018 average, a 350 square foot studio apartment would run nearly USD 1.5 million (or almost CAD 2 million), assuming there are “prime” studios available in the market. Remember, we are talking about the top end of the market.

    If you’d like to download a copy of the full report, you can do that over here.

  • Building the perfect city

    Over the long weekend, and across a couple of flights, I read Perfect City by Joe Berridge. I thoroughly enjoyed it. Each chapter focuses on a different world city, starting with the one and only Toronto. From New York to Singapore and London to Belfast, Joe hones in on what is working and what is not working.

    No city is perfect.

    I found myself folding the top corner of the page on numerous occasions. I did this every time I came across an interesting takeaway or stat, such as this one here: “Angela Merkel, the German chancellor, recently observed that Europe has 7 per cent of the world’s population, 25 per cent of its GDP, and 50 per cent of its social expenditures.”

    However, the thread that really stood out to me is one about individuals. We all know that great things happen as a result of great teams. But as Joe profiles the various city building initiatives that he has come across throughout his work and travels, a common theme seems to emerge.

    From Jane Jacobs to Lee Kuan Yew, there’s often a determined individual who is set on making something happen, or set on stopping something from happening, as is the case with Jane Jacobs and Toronto’s (proposed) Spadina Expressway.

    This is not meant to discredit the value of teamwork. We all know that is essential. Instead, I think it speaks to the power of individual passion, conviction, and tenacity — all of which are ingredients required to build a perfect, or almost perfect, city. Wonderful things don’t just happen on their own.

    Photo by Fraser Cottrell on Unsplash

  • Zoned for detached single-family housing

    We are in West Virginia now, where the only kind of housing that we have come across is — not surprisingly — low-density, detached, and single-family.

    Indeed, approximately 75% of the residential land across the entire US is estimated to be zoned for detached single-family homes. Using data from UrbanFootprint, the NY Times recently published a series of city maps outlining the percentage of land dedicated exclusively to this housing type.

    In some cases, such as on residential corner lots in Portland, duplexes are allowed. But generally speaking, the pink corresponds to detached single-family housing. About 15% of residential land in New York City is zoned for this, compared to about 94% of the land in San Jose.

    Interestingly enough, none of the residential land in Manhattan is zoned to accommodate detached single-family housing.

  • Aman New York’s $180 million penthouse

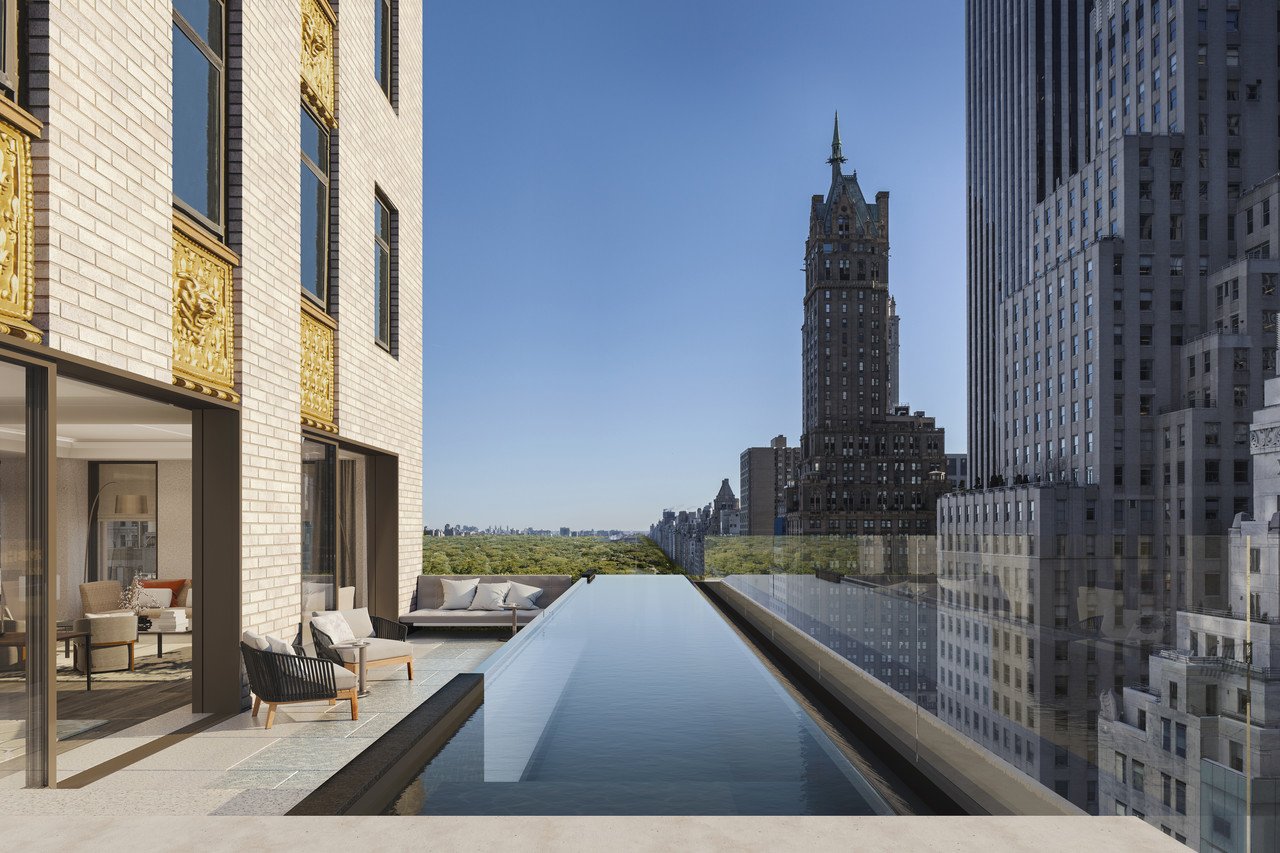
    This morning I was reading about Aman’s new condo and hotel project in New York, which is planned for the 100-year-old Crown Building at 730 Fifth Avenue. It will have 83 hotel rooms and just 22 homes, and be the first urban condominium for the resort company.

    Owned by OKO Group, the hospitality company is mostly known for their “sleek, minimalist hotels in secluded, far-flung destinations,” according to the WSJ. Rooms go for upwards of USD 2,500 per night and they, supposedly, have a rabid customer base known as “Amanjunkies.”

    What’s interesting about this project is that (among other things) it’s a bet the Aman brand will translate to an urban context and drive above-market pricing. And it will do it at a time when the ultra high-net-worth segment of the market in NYC has been cooling because of a new “mansion tax” and probably other factors.

    The five-storey penthouse, which will be built into the building’s “crown,” is asking USD 180 million. If/when it sells, it will break the record for the most expensive home ever sold in the city on a square foot basis at $14,358 psf.

    If you subscribe to the WSJ, you can read the full story here. I find it valuable to see how projects position themselves.

    Rendering: Aman

  • OMA’s first ground-up project in Manhattan finishes construction

    121 East 22nd — which is OMA’s first ground-up project in Manhattan — recently finished up construction at the corner of E 23rd St and Lexington Ave (the site continues through to E 22nd St, where there is basically a 2nd building). I wrote about the project over two years ago, here.

    Below is a photo by Laurian Ghinitoiu, via Dezeen, of it completed:

    The defining feature is its “prismatic corner”, which, I understand from this interview with David Von Spreckelsen (President of Toll Brothers City Living), was largely an outcome of the site’s restrictive zoning. There was a requirement to have constant street walls. That minimized what could be done architecturally on the project’s main elevations.

    The solution is two contextual street walls — the punched windows are designed to match the rhythm of their adjoining buildings — coming together and creating dramatic visual interest only at the point where they intersect. Below is a rolled out elevation from OMA. Note the gradient created by the windows as they converge toward the corner (center in the drawing below).

    The other interesting thing about this project is that it reminded me just how different the built form of Manhattan can be compared to Toronto. In the case of 121 East 22nd, the streetwalls rise 150 feet without any stepbacks. There is then a 10 foot stepback before the building rises another 60 feet — similarly without any additional breaks.

    I love the grandeur.