
The New Yorker recently published a “daily shout” on Instagram called, How You Know You’ve Made It, by City. It is essentially a series on city stereotypes, and it’s pretty funny. Sorry Cleveland. If you can’t see the embed below, click here.
Tag: new york
-
The power brokers
The Nib’s recent comic about Jane Jacobs vs. The Power Brokers (i.e. Robert Moses) is a good little overview of her lessons and legacy. But I don’t understand the claim that developers co-opted her ideals in order to exploit and gentrify urban neighborhoods. According to the comic, gentrification is always a top-down affair by developers, and never a spontaneous emergence as a result of other humans and/or industry wanting to be in a particular place.

I can think of many neighborhoods that have seen investment from groups other than traditional developers, including from individual homeowners. Take, for example, Cabbagetown in Toronto. There was never a top-down developer moment. It was individuals who saw beauty (and also opportunity) at a time when others were scared of the area. Is that acceptable? Perhaps more importantly, did these people wear black suits?
The other missing piece is the fact that desirable urban neighborhoods are, today, in incredibly short supply. During the reign of Robert Moses, Jane Jacobs had a view of cities that was in opposition to the planning zeitgeist of the time. But over time, she went from controversial to enlightened, and alongside this we saw a return to cities.
Combined with strict land use policies, this rising demand for Jacobian-style neighborhoods has meant that many/most dense urban centers operate with a perpetual housing supply deficit. There’s not enough cool urban housing to go around. Add in the current low interest rate environment, and you then have even more money searching for that perfect home in the West Village. That tends to do things to prices.
Image: The Nib
-
The most expensive city in the world in which to build
Using data from Turner & Townsend, Curbed recently reported that the most expensive city in the world in which to build is now San Francisco. On average, it costs USD 417 per square foot. San Francisco is followed by New York ($368 psf), London, Zurich, and Hong Kong. New York took the top spot last year, but San Francisco shot up this year because of, you know, tech.
This number was calculated using a blend of six different types of construction, everything from apartment high-rise and prestige office to general hospital and warehouse distribution centers.
Now, I’m not exactly sure what this number includes. But I’m assuming it is only direct construction costs and doesn’t include (contractor) general conditions, land, or any soft costs, which are all significant. Once you add in these other cost inputs, I am sure that you can start to see how things — including the cost of new housing — can quickly escalate.
-
A comparative analysis of global cities
Since 2005, LSE Cities (London School of Economics) has been collecting comparative data on how global cities perform in terms of key spatial, socioeconomic, and environmental indicators.
This is their latest data matrix:

To be clear, it is not a ranking of cities. It is intended to help us better understand how different cities around the world are performing.
Depending on how you’re consuming this post, the text may be difficult to read. So here’s what each column represents, moving from left to right:
- Current population in the administrative city (millions)
- Current population in the urban agglomeration (millions)
- Average hourly population growth of urban agglomeration 2015 to 2030 (people per hour)
- Administrative city area (km2)
- Average density of built-up administrative area (people/km2)
- GDP per capita in urban area ($, PPP)
- Percentage of country’s GDP produced by the metro region
- Population under 20 (%)
- Murder rate (homicides per 100,000 inhabitants)
- Percentage of daily trips made by public transport
- Percentage of daily trips made by walking & cycling
- Car ownership rate (per 1,000 inhabitants)
- CO2 emissions (tonnes per capita)
If you’d prefer to download a full PDF of the chart, click here.
-
An all-women development team
My good friend Taya Cook (of Urban Capital) and her development partner Sherry Larjani were featured in the New York Times today as a result of their Reina project and their remarkable efforts to gender balance the male-dominated commercial real estate industry. I am thrilled that their work is getting the attention that it deserves.
Here’s an excerpt:
That’s because, despite progress in many other professional realms, women remain severely underrepresented in real estate development and investment, particularly in senior roles.
Women held just 4 percent of senior investment roles at major real estate firms, according to a widely circulated 2011 study, and their numbers have improved only “marginally” since, said the study’s author, Nori Gerardo Lietz, who is a senior lecturer at Harvard Business School and a longtime real estate investor.
Ms. Lietz reviewed the senior ranks of 82 major real estate investment firms for the study, as well as many more private equity and venture capital firms, and found that women were noticeably absent from the most highly paid, “touch the money” jobs.
For the full article, click here. And for more on Reina Condos, click here.
-
The anatomy of density
Urban environments can be dense in many different ways. This is a topic that we have discussed on several occasions here on the blog. But this working paper by Solly Angel, Patrick Lamson-Hall, and Zeltia Gonzales Blanco — called The Anatomy of Density — is a more scientific way of looking at it. They have come up with six measurable factors that, when combined, define urban density.
What this means is that cities achieve urban density through different kinds of built form. Hong Kong, for example, gets its density from height, even though only about 4% of its land area is occupied by residential buildings. Dhaka, on the other hand, does it through low building heights and high residential coverage. Homes occupy about 20% of the city’s area. Another dimension is crowding.
But here’s something that may surprise you. Most cities are actually becoming less densely populated. And, despite our best efforts to encourage more sustainable forms of development, sprawl has continued to outpace densification in the vast majority of the urban agglomerations that were studied as part of this working paper. The wealthier we become, the more space we want to consume.
Here’s a graph from The Economist that speaks to this trend:

To download a copy of the working paper, click here.
Image: The Economist
-
Gentrification in New York, San Francisco, and Chicago is not as it would seem

Matthew L. Schuerman has a new book out called, Newcomers: Gentrification and Its Discontents. I haven’t read it. But in it, he argues that “gentrification is all around us.” Hence the title. Will Stancil has an interesting rebuttal to this position as part of his book review in the Washington Monthly. Here’s an excerpt:
Schuerman settles on what he admits is a simple definition of gentrification: the process by which a neighborhood goes from having below-average to above-average incomes for its region. But he never really applies it. While he frequently asserts or implies that gentrification is exploding across cities, he doesn’t say how many neighborhoods actually meet his definition.
As a demographic researcher, I decided to check. Using U.S. Census data, I looked at the share of people in New York, San Francisco, and Chicago living in places that met Schuerman’s definition of having gentrified between 2000 and 2016. In New York, it’s 3.1 percent of residents. In San Francisco, the number is 4.4 percent. In Chicago, it’s 4.8 percent. Needless to say, this does not represent a vast swath. Although the numbers might increase if the time frame were extended, change at a generational pace is far less disruptive than change that takes place over a few years. Using Newcomers’ own definition, the story of urban America is not a tidal wave of gentrification but creeping racial and economic transition.
In fact, this aligns with the growing academic consensus that gentrification is much rarer than is commonly believed. This year alone, there have been no fewer than three national studies into the prevalence and location of gentrifying neighborhoods. (Disclosure: I authored one of these studies, for the University of Minnesota.) Despite using very different methods, all three studies roughly appear to agree that about 10 percent of neighborhoods in metro areas were gentrifying. Research has also tended to show that no matter how you measure gentrification in the urban core, it’s almost always more common to find neighborhoods afflicted by intensifying poverty. Out of the fifty biggest American regions, forty-four have core cities where the population in poverty has grown faster than the overall population since 2000. The only exceptions are New York City, Los Angeles, D.C., New Orleans, Atlanta, and Providence.
This issue of concentrated poverty has come up before on the blog through posts like this one about Detroit. The data is pretty clear: The number of high poverty Census tracts in the US is increasing faster than the number of gentrifying Census tracts (i.e. Census tracts that are becoming wealthier).
So could it be that the problem isn’t actually gentrification? It is that, paradoxically, gentrification isn’t happening enough and more broadly, and that it is leading to rising inequality across our cities. That strikes me as being the greater issue.
Photo by Hardik Pandya on Unsplash
-
The world’s cities by 2030
This UN report (2018) on urbanization trends is a fascinating way to understand how our world is growing and changing. So today’s post is about some of my takeaways. If you have others, feel free to add them to the comment section below.
But first, some definitions.
The UN report considers 3 ways to measure the size of a city, all of which we have used before on this blog. The first is the “city proper.” That is the current administrative boundary of a city. The second is the “urban agglomeration” area, which is a city’s contiguous built-up area. And the third is the “metropolitan area,” which is the approximate area of economic and social interconnectedness.

Above is what these 3 boundaries might look like for Toronto (which is the example they use in their report). About the only one that isn’t debatable is the “city proper” boundary; but it really doesn’t capture the full extent of a city. Wherever possible, the UN report relies on the city’s urban agglomeration area. They also define a “megacity” as a city of over 10 million people.
The largest city in the world is currently Tokyo. However, from 2018 to 2030 it is expected to decline by almost 900,000 people. Whereas, the city in 2nd position — Delhi — is expected to add more than 10 million inhabitants during this same time period. By 2030, these are expected to be the largest cities in the world:

Most current megacities are located in what the UN refers to as the “Global South.” And 9 out of the 10 cities projected to become megacities by 2030 are located in developing countries. The one exception is London. Though all regions in the world are becoming more urban, the real population growth is happening in Asia and Africa.

Most cities — 59% of cities with 500,000 or more people — are at risk of at least one natural disaster. And 3 megacities — namely Manila, Osaka, and Tokyo — are high risk for 3 or more types of natural disaster.

Going through the report’s data charts, it’s also interesting to note that Toronto is not projected to become a megacity by 2030. However, the Toronto area already represents over 20% of Canada’s entire urban population.
In the United States, Chicago’s urban agglomeration is projected to continuing growing and does come close to megacity status by 2030. The Miami region is similarly expected to grow and is actually right on top of Toronto in terms of population. But the fastest growing regions are, of course, expected to be the city’s that can more easily sprawl (Las Vegas, Phoenix, and so on).
Bogotá, Colombia is already a megacity and is expected to add almost 2 million people by 2030. It currently represents about 26.5% of the country’s entire urban population. São Paulo remains one of the top 10 largest cities in the world and is similarly projected to add over 2 million people in the same time period, but to a much larger base.
In Europe, it’s London, Paris, and Moscow, with the latter two already in possession of megacity status.
Now quantity isn’t everything. Despite not ranking in the top 10 in terms of population, both New York and London are widely considered to be the world’s preeminent global cities. At the same time, we do know that the size of a city does create certain socioeconomic benefits. Urban agglomerations create agglomeration economies.
If you’d like to download a copy of the World’s Cities in 2018 (United Nations), click here.
Charts/Maps: United Nations
-
Qantas pilots new 20 hour ultra long haul flight from New York to Sydney
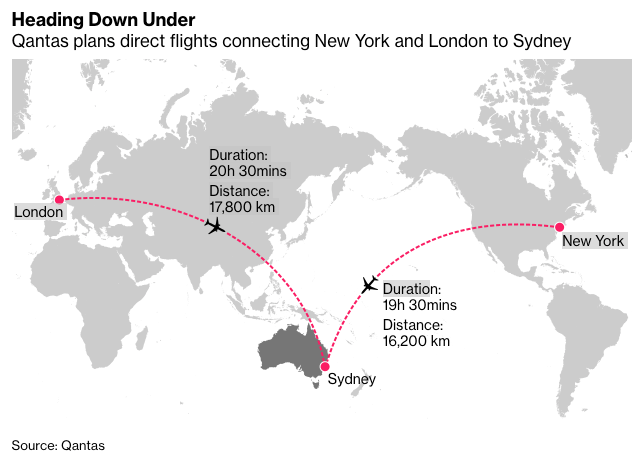
Over the weekend, Qantas Airways set a new record with a nonstop ultra long haul flight from New York to Sydney. At a distance of 16,200 kilometers and a duration of 19 and a half hours, this is now the world’s longest flight. Though, this was still a test voyage. It remains to be seen whether this will be a commercially viable route. The company also plans to offer a similar ultra long haul from London.
It’s fascinating to think about the logistics that go into a flight like this. The flight took off with its fuel tanks maxed out at 101 tons. But according to Wired, the loss factor on each additional ton of fuel is about 60% simply because of the additional weight. In other words, most of the incremental fuel to get all the way to Sydney just gets cannibalized by the heavier load. Wow. That doesn’t feel all that sustainable.
Similarly, every ten passengers roughly equates to one ton (200 pounds per person). So there’s a balancing act between reducing weight (optimizing fuel consumption) and maximizing revenue (adding lots of people). There’s also a question of how best to price discriminate across economy, premium economy, and first class.
Initially these ultra long haul flights were imagined to be flying hotels, where people could sleep, workout, and do all sorts of other things while they traveled halfway around the world. But the economics didn’t work. Too much wasted space on non-revenue generating items.
The other interesting thing about these ultra long haul flights is how much work goes into passenger comfort, specifically around our body’s natural rhythms. Angus Whitley of Bloomberg was onboard this maiden voyage and he talks about how the food they served — spiced with things like chili and lime — was designed to fire up your clock when you shouldn’t be sleeping.
And this isn’t new a feature of ultra long hauls. Qantas already employs things like hot chocolate laced with tryptophan in order to help people sleep onboard. I’m not great at sleeping on planes, generally because I don’t fit in the seats very well. But maybe it’s because I’ve been passing on the hot chocolate.
Image: Qantas via Bloomberg
-
Rules for location data
The CEO of Foursquare — Jeff Glueck — published an interesting op-ed in the New York Times today, calling on Congress to regulate the location data industry. Currently, there are no formal rules in place.
In case you’re not aware, Foursquare is one of the largest independent companies operating in this space. I have written about them many times before on the blog.
Here’s an excerpt from Jeff’s op-ed explaining why this matters:
But location data can also be abused. Bounty hunters were able to buy the current location of a cellphone for $300, Vice reported, because telecom companies sold the real-time location of phones to shady companies. And apps that track location data may turn around and sell that data, revealing someone’s every movement — whether it is to a retail store, an abortion clinic or a gay bar. Bloomberg Businessweek recently reported on a company with thousands of cameras selling car locations to debt collectors and others; there is no “opt-in” involved, and it’s illegal in all states to cover your license plate.
I am writing about this today because I think it’s relevant to city building. Location data is inherently spatial. It is how we exist in cities. So it shouldn’t come as a surprise to any of you that this is valuable information — hence why it is being abused.
Here we have a company advocating for more, not less, regulation. They, of course, want it to be sensible. But I still think it says things about the current location data environment. To learn about the specifics of what Jeff is proposing, click here.