Daily insights for city builders, delivered every morning at 6 AM ET. I’m Brandon Donnelly — a Toronto-based real estate developer and founder of Globizen. I’ve been writing here since 2013.

Tag: new york

  • The coldest and hottest global cities

    Below is a list of the 44 cities found in the 2018 Global Power City Index by the Mori Memorial Foundation’s Institute for Urban Strategies.

    The index ranks the major cities of the world according to their “magnetism”, which they generally define as a city’s ability to attract people, capital, and businesses from around the world.

    As with all rankings, the output depends entirely on the methodology that you use. The GPCI seems to have the right executive committee in place. It includes global city authorities like Saskia Sassen. But that’s not really the point of today’s post.

    Beside each city, I have added the average highs and lows (in celsius) for both the coldest and hottest months of the year. For cities in the northern hemisphere, these are typically January and July/August, respectively.

    I have also added the spread between the hottest and coldest months to get a sense of variability. I always find it interesting to see how cities like Singapore, Kuala Lumpur, Jakarta, and Mumbai basically stay the same temperature all year round.

    When you look at this list, remember that you can ski in Dubai.

    All weather data taken from the NOAA (National Oceanic and Atmospheric Administration).

  • Uber Movement introduces new Speeds product

    Since we’re on the topic of large-scale data collection, I thought some of you may be interested in Uber Movement‘s new “Speeds” product.

    First launched in 2017, Uber Movement aggregates anonymized data from their ride-sharing business to create data sets and tools that can help cities make better transportation decisions.

    Below is a (hex cluster) map of Toronto showing average travel times from downtown. I dropped the pin at Toronto City Hall. What is shown is the average for all days of the week during the month of January 2018.

    Uber Movement’s new Speeds product looks at how specific streets are performing relative to their “free-flow speed.” Uber defines this as “the average speed of traffic in the absence of congestion or other adverse conditions.” (The 85th percentile of all speed values.)

    As of right now, Speeds is only available in 5 cities: New York City, Seattle, Cincinnati, Nairobi, and London. Here is a snapshot of London during the same time period as above, January 2018:

    In comparison to what we were talking about yesterday, I have few concerns with the fact that my Uber rides around town have likely contributed to these mappings. With these use cases, the value really only emerges once you aggregate the data.

  • Equinox to open its first hotel this summer

    Equinox Holdings operates, among other things, 99 fitness clubs in the US, the UK, and Canada. And this June, the first Equinox Hotel will open in a 92-storey tower in New York’s Hudson Yards. It will occupy floors 24 to 38. Below it will be Equinox’s corporate headquarters. And above it will be residential condominiums.

    Supposedly, the brand emerged out of a trend that the company saw over a decade ago: Its fitness club members were choosing to stay in hotels based on their proximity to an Equinox. They simply weren’t satisfied with the gym offerings at other luxury hotels.

    The full back story, which can be found here in WSJ. Magazine, is a good read. I think their ambition of trying to “own sleep” is a clever one. They are pitching their rooms as dark, quiet, and cool. I am sure other hospitality brands have tried to do this, but Equinox is clearly taking this directive very seriously. They even sponsored a sleep study with UCLA.

    This feels like a natural extension of their existing brand. Equinox is focused on regeneration. What better way to accomplish that than through a good night’s sleep?

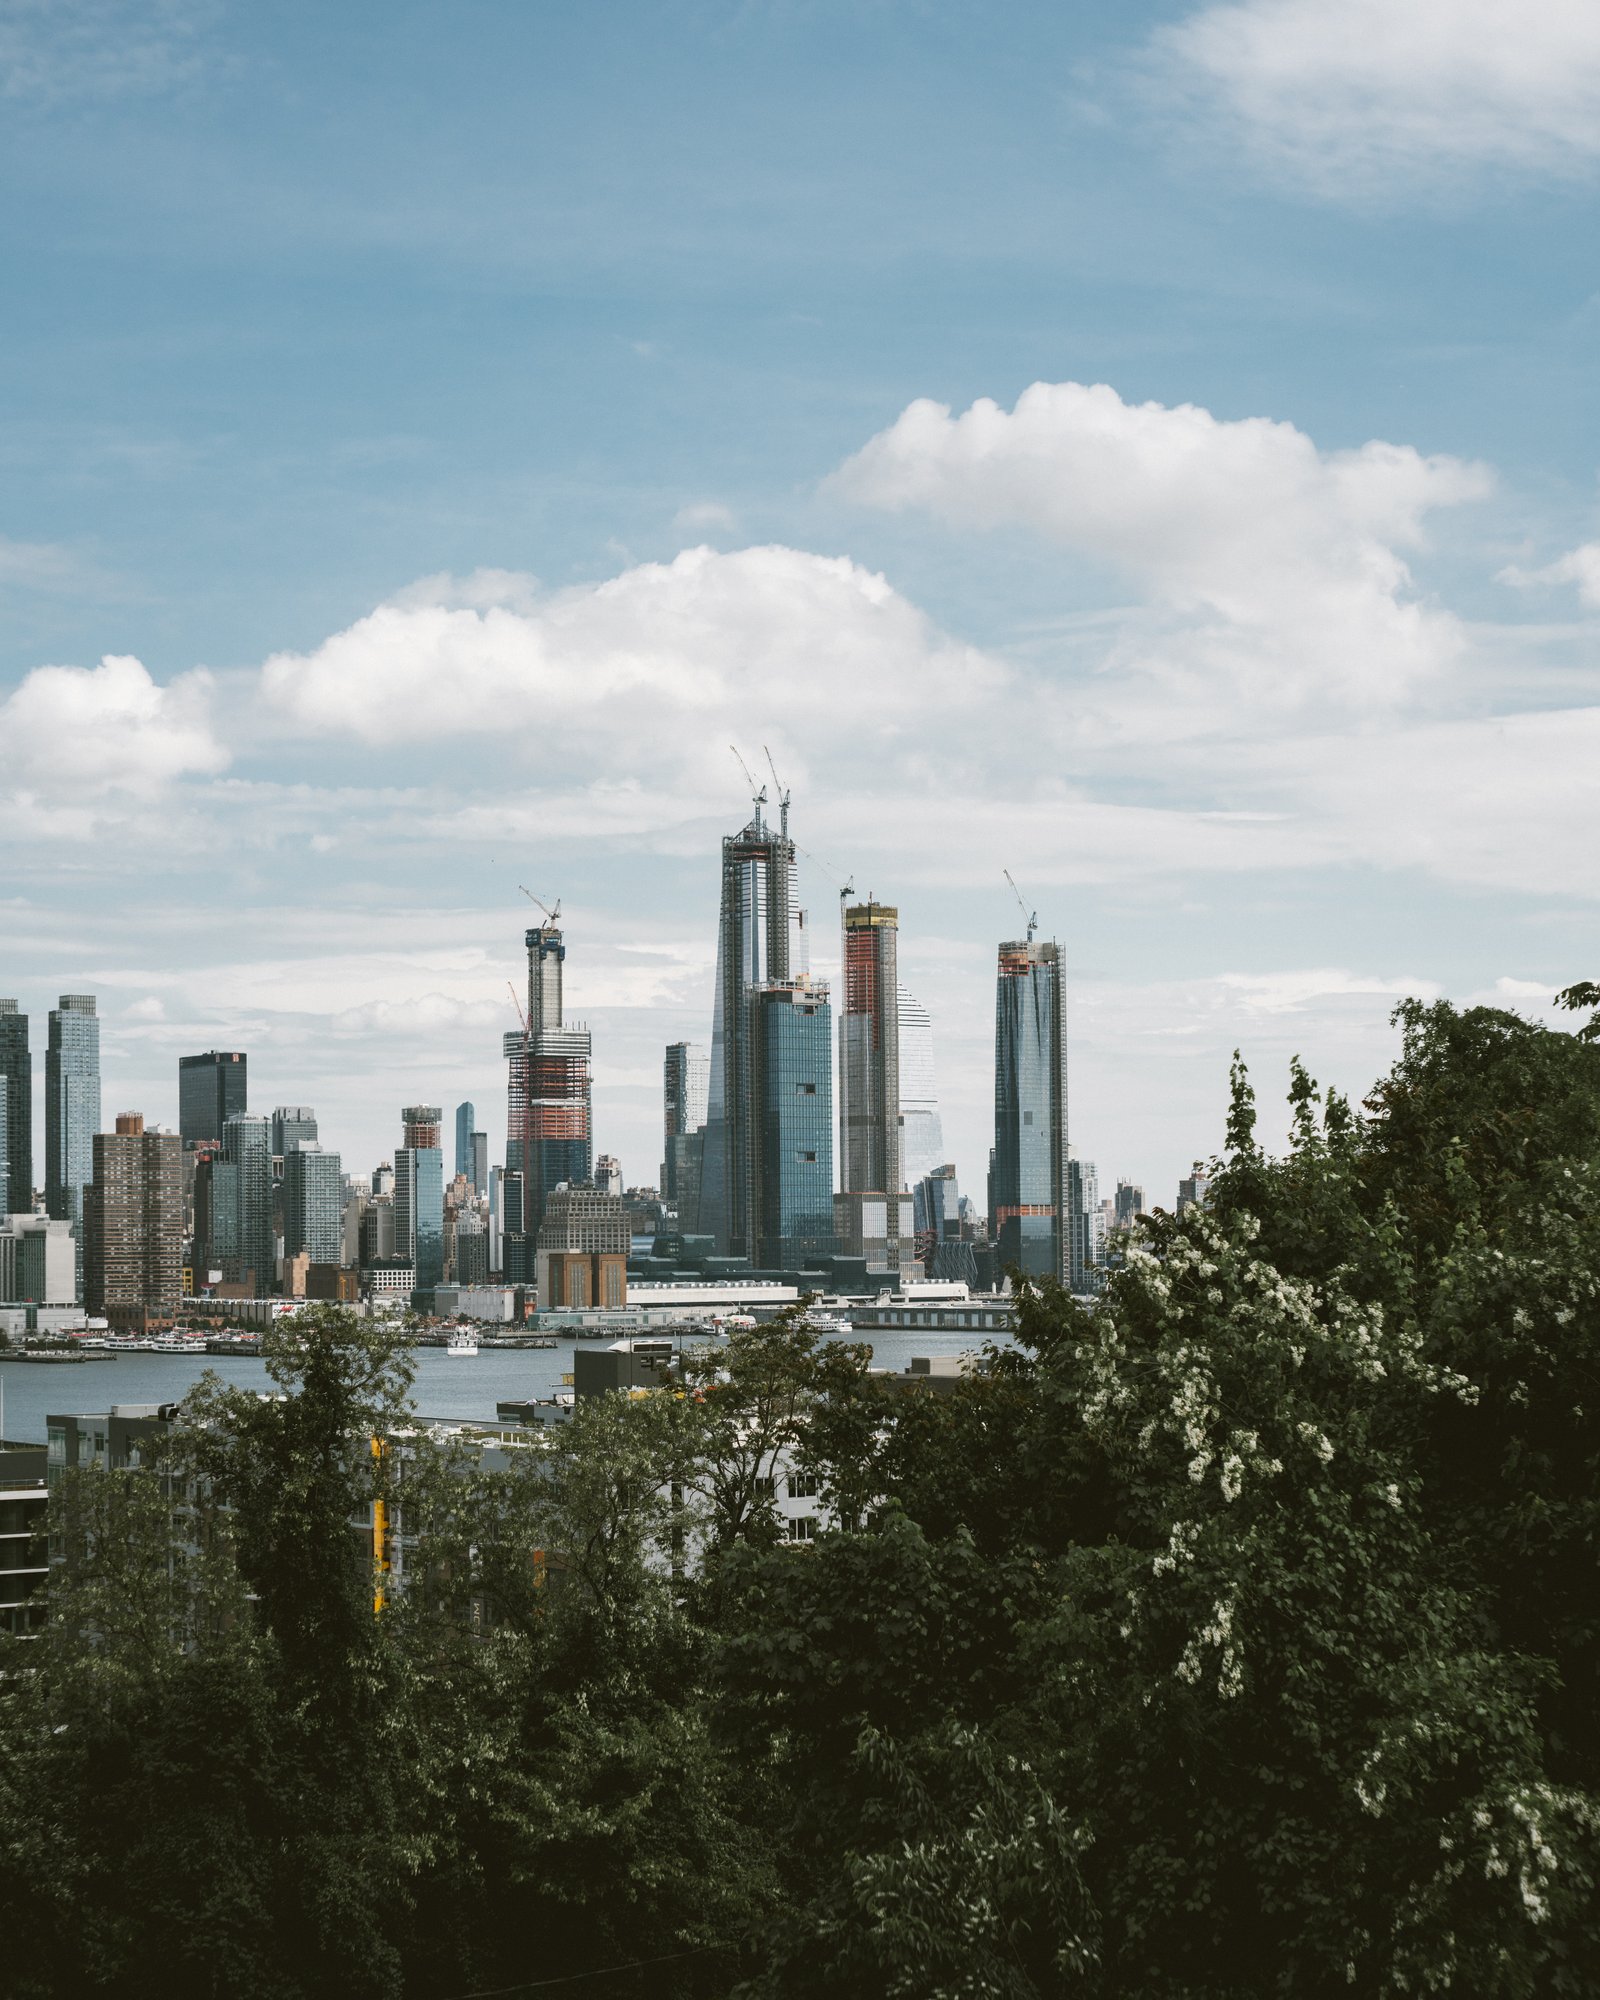
    Image: 35 Hudson Yards via Related-Oxford

  • The story of Florence Casler

    Curbed has a section on their website dedicated to “deep dives on cities, architecture, design, real estate, and urban planning.” It is called Longform. And they have some great stories, including this one on “the female powerhouse [Florence Casler] who developed 1920s Downtown LA.”

    Florence was born in 1869 in Welland, Ontario, about 25 kilometers south of Niagara Falls. She married an American — a plumber — and eventually settled in Buffalo, New York. After her husband left to pursue riches in the gold mines, she became a licensed plumber and took over the business.

    Eventually this love of plumbing grew into a love of building, and somehow she found herself, with her daughters, in Los Angeles at the beginning of the 20th century.

    By the 1920s, she had become a dominant force in the real estate business. Some 60 buildings are credited to Florence and she is thought to be largely responsible for ushering in a new era of multifamily apartments in Los Angeles. Unfortunately, many of her buildings have since been demolished.

    As one of the first women in Los Angeles to head a development and/or construction business, I think this is a wonderful story worth telling. For the full Curbed article, click here.

  • How Japan increased its housing supply

    River Davis’ recent article in the Wall Street Journal about Tokyo’s generally flat home prices had me, again, wondering about demographics. I mean, aren’t their demographics working in reverse? They have an aging population, low immigration, and a low birthrate. But Tokyo, which represents about 11% of Japan’s total population, is still growing. And their home price index looks like this compared to San Francisco and New York:

    Davis’ argument, which of course has been made by others before, is that deregulation has allowed housing supply to actually keep up with demand. Land use policies were relaxed to allow taller and denser buildings to be built and some degree of decision making (I’m not sure how much) was moved to the central government in order to counteract the NIMBY problem that invariably attaches itself to local politics.

    The result is housing numbers that look and compare like this:

    In Tokyo last year, housing starts came in around 145,000, according to Japan’s land ministry. This figure is on par with the total number of new housing units authorized last year in New York, Los Angeles, Boston and Houston combined, based on the U.S. Census Bureau data. The same feat was achieved in 2017.

    If we are to normalize against New York, it looks like this:

    And the belief seems to be that it is working:

    “A reason why housing prices in Japan are not rising as fast as in New York, for example, is the large number of housing starts,” says Masahiro Kobayashi, a director general at the Japan Housing Finance Agency, a state-run entity which supports the housing market by purchasing home loans.

    One sentence that really stood out for me in the article is this one here: “Private consultants were given permission to issue building permits to speed up construction.” If any of you have tried to pull a building permit for a large project in Toronto, you’ll know that it can take a very long time (understatement). Maybe it is the same in your city. Should we be looking at this?

    Charts: WSJ

  • Hudson Yards opens in New York

    Hudson Yards officially opened today on the west side of Manhattan. More specifically, the eastern half of Hudson Yards opened. There’s a second phase to come on the western yards. And the highly anticipated observation deck at 30 Hudson Yards — the highest outdoor observation deck in the Western Hemisphere — is also not quite ready. It is expected to open in early 2020.

    Considered the largest mixed-use private real estate project in American history by square footage, Hudson Yards has been in the works for many decades and was previously part of New York’s (failed) bid for the 2012 Olympic Games. Dan Doctoroff, who is now the CEO of Sidewalk Labs, led the bid under the Bloomberg administration.

    So today is a bit of a big deal.

    To commemorate the opening, the architecture critic for the New York Times, Michael Kimmelman, published this searing, but highly visual, piece about the project. I think it is fairly safe to assume that he isn’t a huge fan (he doesn’t seem to love developers either).

    Here’s an excerpt talking about Thomas Heatherwick’s Vessel:

    Purportedly inspired by ancient Indian stepwells (it’s about as much like them as Skull Mountain at Six Flags Great Adventure is like Chichen Itza) the object — I hesitate to call this a sculpture — is a 150-foot-high, $200 million, latticed, waste-basket-shaped stairway to nowhere, sheathed in a gaudy, copper-cladded steel.

    It preens along the critical axis between the High Line and the newish No. 7 subway station at Hudson Yards, hoping to drum up Instagram views and foot traffic for the mall, casting egregious shadows over what passes for public open space, ruinously manspreading beside the Shed, the most novel work of architecture on site, and the only building the private developers didn’t build.

    If any of you have formulated your own opinions about Hudson Yards, I would love to hear from you in the comments below. I’m looking forward to exploring the neighborhood in person sometime soon. If you’re interested in learning more about the project, Curbed also just published, The ultimate guide to Hudson Yards.

    Photo by Sandy Ching on Unsplash

  • New York’s “pied-à-terre tax” explained

    New York is close to implementing new “pied-à-terre tax.” If the bill passes, which the New York Times believes is likely, cities of a million or more people will be able to levy an additional property tax on non-primary residence homes worth $5 million or more. The additional tax would be based on the following sliding scale:

    So let’s say for argument sake that you own a pied-à-terre in New York City worth approximately $238 million. Based on the above, your additional tax would be $370,000 + [4% x ($238 million – ~$25 million)]. That’s almost $8.9 million. Most of the revenue from this tax is expected to come from this upper (and open-ended) valuation bracket.

    New York City estimates that the tax could bring in about $650 million annually. The state in turn believes it could then raise $9 billion in bonds. And the intent is that these additional funds could be used to fund things like transit and housing. I am curious how elastic the demand is for trophy real estate in New York.

    Another thing I noticed while reading up on this bill is that the New York State Senate has made it pretty easy to voice your opinion on proposed legislation. On the sidebar of every bill making its way through the system is a box that looks like this:

    This is probably the clearest engagement tool I have ever seen on a government website. Do you think something like this could work for new housing?

  • The top 30 cities for tech and startup companies

    The third edition of Savills’ annual Tech Cities report is now out. Savills is a global real estate company headquartered in London and a few years ago they started looking and what makes a successful “tech city.” As always, you should take these rankings with a healthy dose of scepticism. But this one is based on over 100 individual metrics across 6 main categories:

    • Business environment (such as the size of the financial services industry)
    • Tech environment (such as the amount of inward VC investment)
    • City buzz and wellness (is it a cool place to live?)
    • Talent Pool (is the city creating and attracting young/smart talent?)
    • Real estate costs
    • Urban mobility

    Here are the top 30 cities for tech and startup companies:

    New York takes the top spot, supposedly because of its deep talent pool and position as one of if not the capital the world. But my friends in the Bay Area tell me that their housing shortage is also starting to impact SF’s tech dominance.

    Generally, the report finds that the above “tech cities” should see their GDP rise by 36% over the next decade, compared to 19% for other developed cities. I’m not sure how much of this has to do with tech, but the above list does differ from what you’d see in a more conventional global cities index. Here you have Austin ahead of global cities such as Hong Kong. And you have Toronto ahead of cities like Tokyo and Paris.

    One takeaway that shouldn’t come as a surprise to readers of this blog is the rise of Chinese cities in the index. Beijing is ahead of New York, London, and San Francisco by a wide margin in terms of annual VC investment. And Chinese cities as a whole are starting to take a greater share of global VC dollars (second chart below).

    If you’d like to download a PDF of the full report, you can do that here.

    Image: Photo by Jason Briscoe on Unsplash

  • Tallest buildings completed in 2018

    image

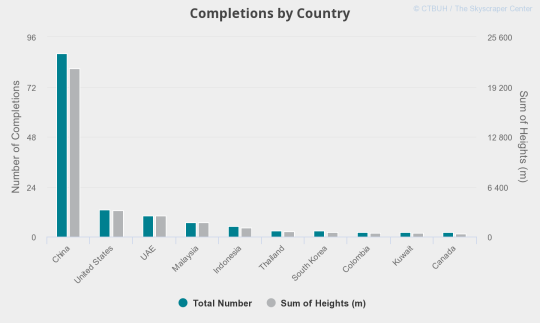
    The Council on Tall Buildings and Urban Habitat (CTBUH) recently published their annual study looking at all of the 200+ meter tall buildings completed over the last year.

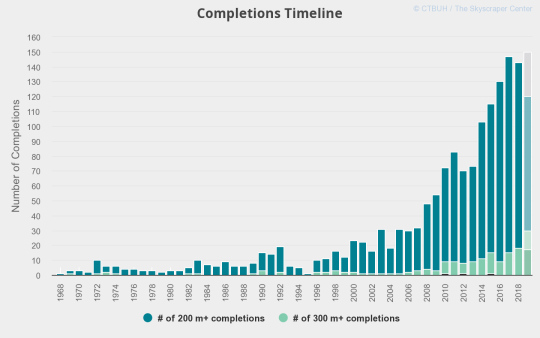
    143 were completed around the world. The all-time record was 147, which was in 2017. Last year, 18 “supertalls” were also completed. A supertall building is generally defined as having a height of 300m or more.

    The tallest building completed in 2018 was China Zun in Beijing. Pictured above. It is 527.7m tall (to tip), but the occupied height is 513.5m. 

    It was designed by Kohn Pedersen Fox Associates and looks like a Chinese finger trap. All iconic buildings deserve an endearing nickname, right?

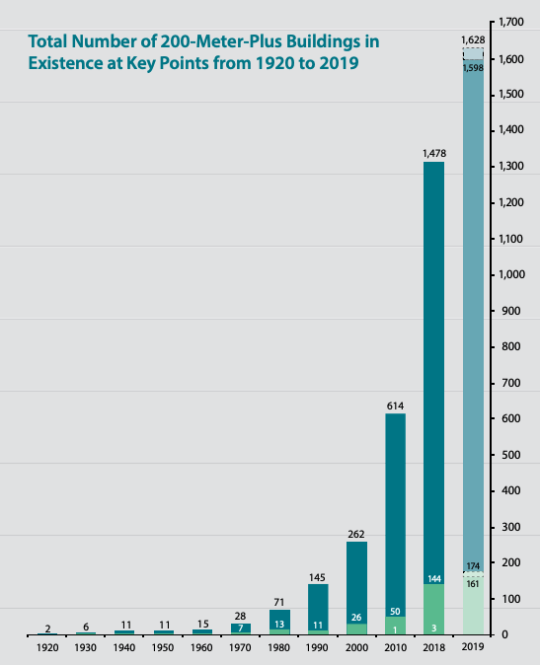
    Below are a few interesting charts from the report. The first is the total number of tall buildings over 200m from 1920 to 2019. At whatever point they chose in the 1920s, there were only 2. Things sure changed starting in the 1980s.

    image

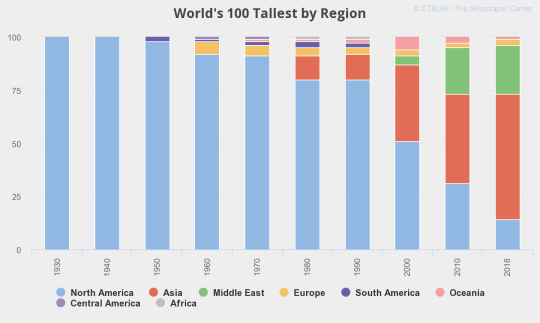
    That exponential growth happens to coincide with tall building growth in Asia and in particular China. The next few charts show (1) the handover from North America to Asia; (2) completions per year (broken down by talls and supertalls); and (3) completions by China, I mean country, last year.

    imageimageimage

    The full 2018 year in review report can be found here.

    Image: CTBUH

  • Maple Valley? No.

    At this time of year, I am always amazed by the number of mass emails that I receive from unknown people and companies. They have my email address, clearly, and yet I only receive one email a year from them – a happy holidays email. I am not opposed to holiday cheer. I love Christmas. But if you’re looking to build any sort of meaningful rapport with an audience, my sense is that you ought to send more than one email a year.

    In other news, the Economist published an article this past week talking about how Toronto is attracting disaffected (Indian) tech workers from the US and, more particularly, Silicon Valley. It is largely a story of immigration and diversity. But at the end of it, the Economist also reports that some people are now calling Toronto, Maple Valley. Toronto immediately reacted to this moniker – negatively.

    Nobody refers to Toronto as Maple Valley. And these sorts of names are stupid. In the 1990s, the Flatiron District in Manhattan started being called Silicon Alley (at least by some). That name was also stupid. New York is New York. And Toronto is Toronto. If you’re going to assign a nickname, it should not be derivative. And in the case of Toronto, you probably also want to avoid kitschy Canadian stereotypes.