Daily insights for city builders, delivered every morning at 6 AM ET. I’m Brandon Donnelly — a Toronto-based real estate developer and founder of Globizen. I’ve been writing here since 2013.

Tag: new york city

  • Archival street life footage

    Guy Jones is a videographer who specializes in archival footage, or at least that is what his YouTube account suggests. He edits old videos and makes them more watchable by doing things like adding sound and slowing them down to a natural rate. 

    (Older films often appear sped up because they were recorded at less than 24 frames per second and then later played at 24 or more frames per second.)

    I’ve blogged about one of his videos before. This one of New York City in 1911. But he has so many other fascinating films on his channel – including a frozen Ottawa from 1942 – that I figured I would share it in its entirety today

    For the city builders in the room, here are some street life videos of Paris in la Belle Époque (1896-1900), New York City in 1927, and London in 1967. Among other things, it is fascinating to see how quickly the car crept its way into our cities.

    The video of Paris is all horses and moving walkways. The video of New York City (1927) is all cars. And if you look at the other video of New York from 1911, you’ll see a city in the midst of that transition.
  • Non-load-bearing curtain wall

    image

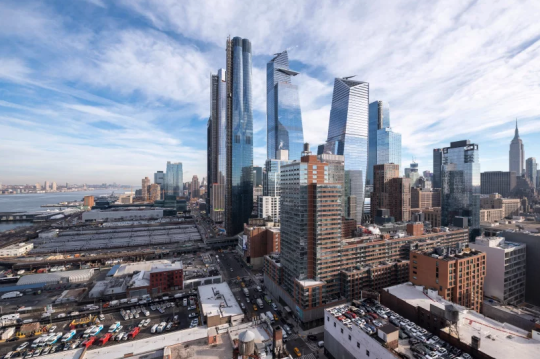
    Liz Diller of Diller Scofidio + Renfro was recently asked by designboom about how her firm approached the design of Fifteen Hudson Yards (the first residential tower in New York’s Hudson Yards).

    The firm had never designed a high-rise before. So while their typical approach would be to analyze program, here they were heavily informed by the views – both in and out from the site – as you move up the tower.

    The 88 storey tower transitions between two footprints. The base matches the street grid of the city, but as you move up the tower it transforms into a cloverleaf – allowing panoramic views of the city.

    It is a somewhat similar approach to what has been proposed by Studio Gang for One Delisle. Except for the transformation here is to a multifaceted cylindrical shape (a hexadecagon is what has been drawn).

    From the late 19th century when Chicago began to pioneer the modern skyscraper, architects and engineers have been thinking about how you treat a tall building as you move from top to bottom.

    Chicago architect Louis Sullivan responded to this challenge with his tripartite approach to design. He believed that tall buildings should be characterized by three main divisions: a base (bottom), a shaft (middle), and a cap (top).

    The technological innovation that allowed this thinking to flourish was the non-load-bearing curtain wall. Once the exterior walls of a tower no longer supported the actual building, architects then had the freedom to really experiment.

    This remains true to this day, but we no longer need to confine ourselves to only three parts. New technologies now allow for more.

    Today we have parametric modeling and other design tools that allow us to create new geometries and transitions; forms that would have been pretty complex to draw up in the past. 

    In the case of Fifteen Hudson Yards, every floor plate from 20 something and up is slightly different. I wonder what Louis would think of this.

    Image: Timothy Schenck via designboom

  • Documenting a city

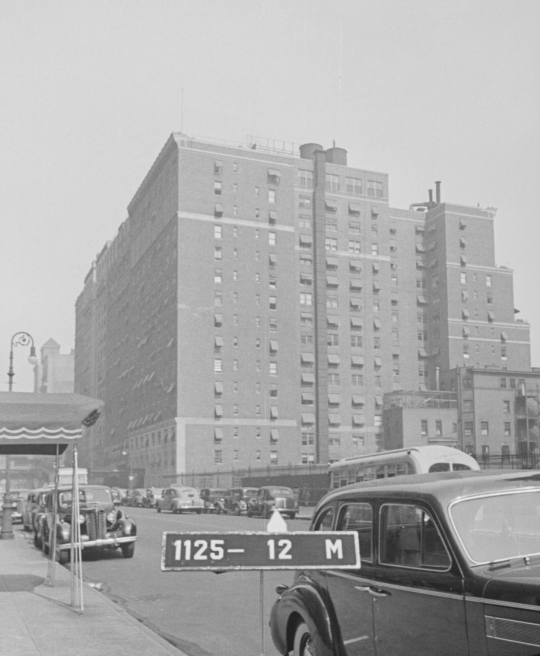
    Starting in the late 1930s, New York City began hiring photographers to document each and every building in the city. It did this to improve the accuracy of its tax assessments, and so every photo was taken with a sign board indicating the building’s block and lot number. The photos looked like this (taken from here):

    image

    The initiative produced over 700,000 black and white photos, all of which have been recently digitized according to the New York Times. The Times also recently published this interactive piece where they go back to these archival photos to see how the city has and hasn’t changed. 

    In the late 1930s and early 1940s, documenting a city and its buildings was clearly a manual endeavor. Today we have Google Street View (launched in 2007), which has now photographed much of the world. Many countries, including all of North America, are reported as having “mostly full coverage.”

    But already autonomous vehicles (and their supporting services) are starting to scan and map our cities in new ways. So it will be interesting to see what ends up getting built on top of this data. I am certain it will empower much more than just better tax assessments.

    Happy New Year, friends. Thanks for reading over the last year.

  • Maple Valley? No.

    At this time of year, I am always amazed by the number of mass emails that I receive from unknown people and companies. They have my email address, clearly, and yet I only receive one email a year from them – a happy holidays email. I am not opposed to holiday cheer. I love Christmas. But if you’re looking to build any sort of meaningful rapport with an audience, my sense is that you ought to send more than one email a year.

    In other news, the Economist published an article this past week talking about how Toronto is attracting disaffected (Indian) tech workers from the US and, more particularly, Silicon Valley. It is largely a story of immigration and diversity. But at the end of it, the Economist also reports that some people are now calling Toronto, Maple Valley. Toronto immediately reacted to this moniker – negatively.

    Nobody refers to Toronto as Maple Valley. And these sorts of names are stupid. In the 1990s, the Flatiron District in Manhattan started being called Silicon Alley (at least by some). That name was also stupid. New York is New York. And Toronto is Toronto. If you’re going to assign a nickname, it should not be derivative. And in the case of Toronto, you probably also want to avoid kitschy Canadian stereotypes.

  • US cities with the highest construction costs

    BuildZoom, which is a tool to help people find local contractors, recently looked at construction costs across the US.

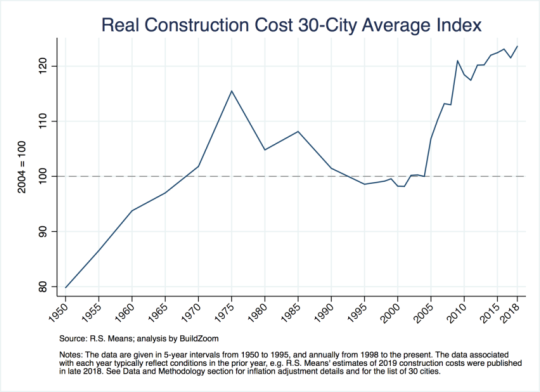
    Here is their 30-city average index running from 1950 to roughly today:

    image

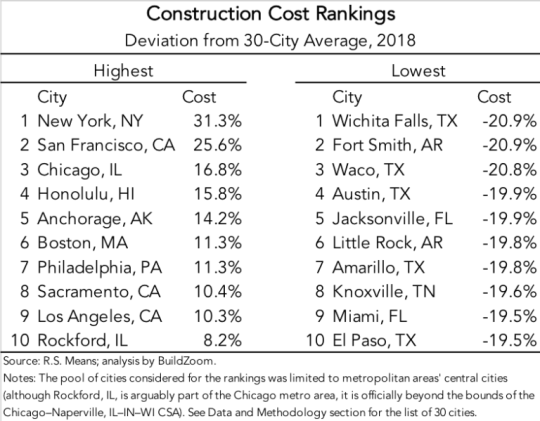
    Here is a chart showing the most and least expensive cities (that is, the cities that deviate the most from their 30-city average):

    image

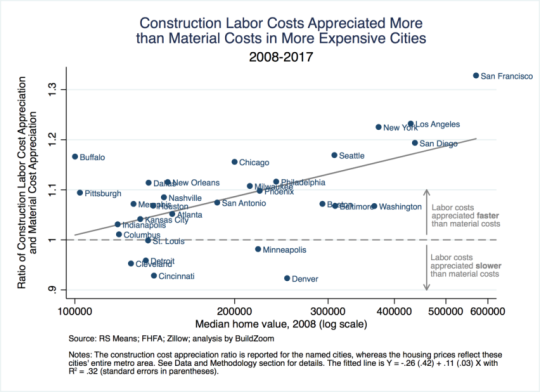
    And here is a chart that compares labor cost appreciation to material costs:

    image

    Labor costs account for the bulk of the geographic variation in construction costs and the most expensive cities to build in also tend to have the highest median home prices.

    The way to read the above chart is that any city with a y-axis value greater than 1 means that labor costs have appreciated faster than material costs from 2008 to 2017.

    In the case of San Francisco, labor costs have appreciated 32.8% (> 1.3) faster than material costs. 

    Part of this likely has to do with the fact that San Francisco is an expensive city in which to live. People have to be paid more if they’re going to work there.

    Full blog post from BuildZoom, here.

  • Fixing the MTA

    Fred Wilson wrote a great post on his blog today about New York City’s “transit mess.” 

    In it he talks about congestion pricing (which, as you all know, I support); the mess that is the Metropolitan Transportation Authority (MTA); and this 37-page report on how to improve the MTA.

    Here is an excerpt from his post that I liked, but that won’t be popular with everyone:

    That is an idea [congestion pricing] that has been proposed a number of times over the years, most notably by Mayor Bloomberg during his tenure. It is a good idea and long overdue. A dense urban environment should have excellent mass transit and incentives to use it and should have disincentives to drive cars. Taxing cars in Manhattan and using the revenues to maintain and improve our subways seems like an obvious thing to do.

    I would encourage you to give his post a read. The New York Times also reported on this topic (and the above recommendations) this week. They called it, 7 ways to fix the MTA (which needs a $60 billion overhaul).

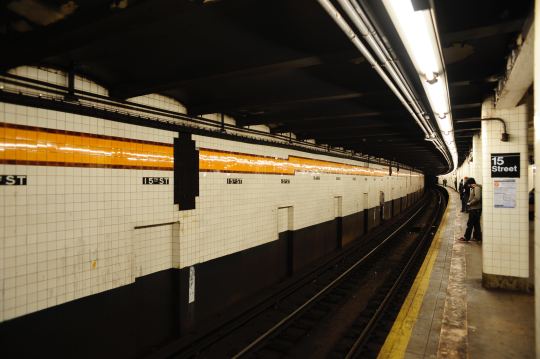
    Photo by Joren on Unsplash 

  • Average January temperatures by global city

    In Edward Glaeser’s book, Triumph of the City, he argues that the average temperature in January is the single best variable to predict which U.S. cities have grown the most over the last century. Indeed, from July 2015 to July 2016, 10 of the 15 fastest growing large metro areas in the U.S. were in the south. Follow the sun and sprawl.

    Given this phenomenon, I thought it would be interesting to look at the world’s most influential cities (i.e. global cities) through this lens. Because let’s face it, New York and London aren’t all that warm in January. 

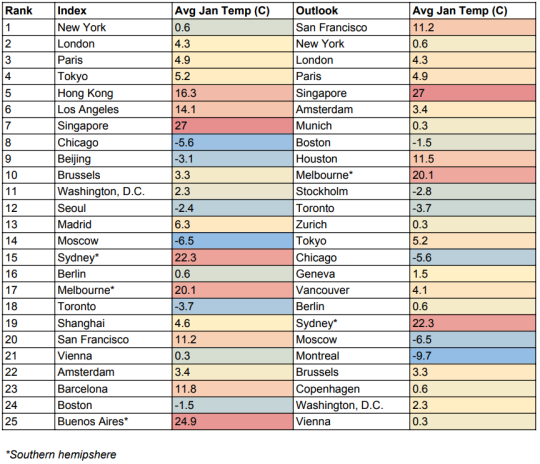
    Below are the top 25 global cities (taken from A.T. Kearney’s 2018 Global Cities Report), along with their average January temperature (taken from here). Note, there are two rankings. On the left is their global cities index. And on the right is their global cities outlook, which evaluates current potential. Cities that improved their economics & governance made the biggest leap on the right.

    image

    First of all, it’s interesting to see San Francisco jump so significantly in their outlook ranking. This has everything to do with tech and innovation. It’s also important to note that a handful of the above cities are located in the southern hemisphere, so “average January temperature” doesn’t mean the same thing (probably should have normalized to their winter).

    Montreal wins the award for the coldest city in this ranking. And there’s really only one city, Singapore, with a tropical climate. Though there are others, such as Hong Kong and Sydney, that would fall under subtropical. All of this isn’t enough for us to start inferring anything, but perhaps colder and more temperate climates aren’t such a bad thing for economic growth.

  • US cities with the most corporate HQs

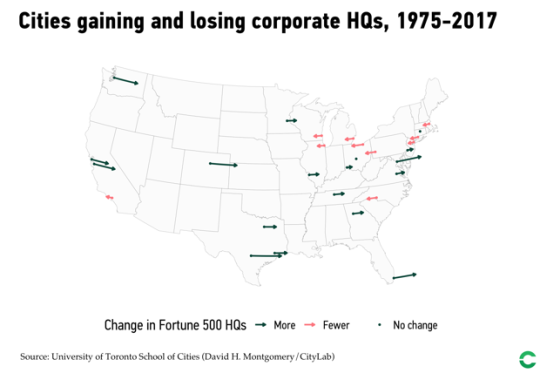
    The University of Toronto School of Cities recently looked at the changing economic geography of Fortune 500 companies across the US from 1975 to 2017. Here is a diagram of the results taken from CityLab:

    New York sits at the top with 70 corporate headquarters as of 2017. But the San Francisco Bay Area is now the second largest center with 35 headquarters – a testament to tech.

    The study does, however, omit service firms, as these weren’t tracked in Fortune’s list back in 1975.

    Also noteworthy is the specialization that has taken place across specific cities and regions. Here is another excerpt from CityLab:

    America’s headquarters geography reflects the substantial variation and specialization of the U.S. economy. New York leads in finance and business services, consumer services, and goods and materials. But Houston leads in energy, San Jose in tech, and Chicago in retail and wholesale. Chicago also ranks second in consumer services, and goods and materials, and Dallas takes third in energy. Other cities like Nashville and Minneapolis take third in consumer services, and goods and materials, respectively.

    The full article can be found, here.

  • City-states and superstar cities

    During the recent election here in Toronto, mayoral candidate Jennifer Keesmaat raised the idea of this city region, maybe, becoming its own province. It wasn’t the first time this idea has been floated, but it once again didn’t stick.

    Earlier this week, Richard Florida spoke at the Urban Land Institute’s Toronto symposium and he brought up a similar issue: Toronto is a ‘city state’ and needs to start acting like it. Here is an excerpt from a recent Star article about his talk:

    He also noted that in terms of total economic output, the GTA [Greater Toronto Area] — he included the Golden Horseshoe — is responsible for about “$700 billion” (U.S) in economic output.

    “Which means our … region is equivalent to that of Sweden. So we are a city state, a mega region.”

    He later added: “we are a powerful global city with lots of assets to build on,” he said.

    But he went on to say that despite all of these successes there’s a “sense that something is amiss, something is wrong.”

    I have long supported the notion that city regions need to see and think of themselves as one united and contiguous economic landscape. In our case, it is not about, for instance, Hamilton vs. Toronto. This is about our entire region vs. New York or Singapore (a city-state) or the Pearl River Delta megalopolis.

    The headlines coming out of Amazon’s recent announcement are clear: In Superstar Cities, the Rich Get Richer, and They Get Amazon. This is winner-take-all urbanism where you need to be a “superstar” in order to compete. 

  • HQ2 isn’t coming to Toronto

    So I was wrong. Amazon didn’t pick Toronto for HQ2. It instead picked Crystal City, Virginia (Washington) and Long Island City, NY (New York City). More on that, here, in the NY Times. Confession: My prognostication was at least partially about trying to create a self-fulfilling prophecy.

    In any event, it’s interesting to consider the locations that they did pick – as well as the fact that they ended up picking multiple cities. This was not part of their RFP. Though, many have convincingly argued that this process was over before it even began. HQ2 was always going to end up on the east coast, near one of Bezos’ homes.

    Nevertheless, urbanists such as Aaron Renn took the announcement as a direct repudiation of the American heartland. He believed that Amazon would be far more cost conscious in their decision making and ultimately elect for a lower cost locale in the middle of the country. Instead, the coastal hegemony won out. 

    Joe Cortright of City Observatory correctly predicted that Amazon would, for a few reasons, parlay their HQ2 search into multiple smaller locations (HQ2, HQ3, and so on). One of the reasons for this is that it gives the company more leverage when it comes negotiating subsidies on a go-forward basis. If NYC doesn’t want our next round of hires, we’ll take them to Washington.

    Looking at the locations, one of the first things I noticed is that both are just outside of their respective “downtowns” (across a body of water), as well as adjacent or on the way to an international airport. Crystal City is across the street from DCA and Long Island City is a 15 minute drive from LGA. Both are situated on top of higher order transit. Makes sense to me.

    Now, who wants HQ4?