Daily insights for city builders, delivered every morning at 6 AM ET. I’m Brandon Donnelly — a Toronto-based real estate developer and founder of Globizen. I’ve been writing here since 2013.

Tag: los angeles

  • The third Los Angeles

    I just stumbled upon an interview with Christopher Hawthorne (architecture critic for the Los Angeles Times) talking about a “third Los Angeles.” 

    His argument is that the first Los Angeles ran from about 1880 to World War II, and was characterized by a form of urbanism that most of, today, do not associate with LA. It was a city of streetcars, innovative multi-family housing, and local landscapes.

    The second Los Angeles was the second half of the 20th century. And it is the LA that probably comes to mind for most people when they think of LA. It is the city of freeways, single-family homes, and sprawl.

    The third Los Angeles is the city’s most recent iteration and started sometime around 2000. Like many things in life, it is in some ways a return to the past: namely the first LA. It is about urban intensification, transit, and more drought resistant landscapes. It is a city that senses its geographic limits.

    I like how he talks about some of the challenges associated with intensification and this third LA:

    “People in very good conscience who live in Santa Monica or San Francisco think of a moratorium on development as a progressive thing to support rather than reactionary or conservative or just in their own political self-interest. I don’t have a problem with somebody who bought a house at a certain point saying, “I bought into a certain place, you know, I want it to stay this way, and I’m going to use whatever resources I can to keep it that way.” They have every right to say that, even if I disagree. I have a problem with people saying that’s consistent with a progressive agenda about cities or a forward-looking attitude about the environment or about resources. It’s not.”
  • World’s best city brands

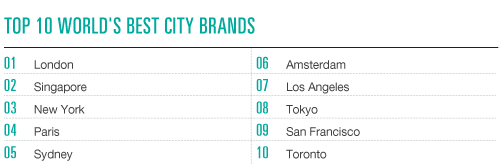
    Resonance Consultancy – they do brands and strategies for places and products – has just released a new report called: World’s Best City Brands – A Global Ranking of Place Equity.

    With all of these sorts of rankings, it really depends on the research methodology being used and the rigor in which it is being applied. In this case, they evaluated each city based on “six pillars of equity”:

    1. Place: Perceived quality of a city’s natural and built environment
    2. Product: A city’s key institutions, attraction and infrastructure
    3. Programming: The arts, culture and entertainment in a city
    4. People: Immigration and diversity of a city
    5. Prosperity: Employment, GDP per capita entertainment in a city and corporate head offices
    6. Promotion: Quantity of articles, references of a city and recommendations online

    What’s perhaps unique about this study is that it combines measurable statistics with “visitor perception metrics” – data that they mined from social media. Here’s an excerpt from the methodology page:

    “Our team became interested in the way visitors and citizens themselves influence the identity and perception of cities. Increasingly, they do it through their evaluation of experiences on social media and via the comments, images and reviews they share with family, friends and people around the world. These opinions and attitudes, much more than traditional marketing, influence the way people perceive places today.”

    This is a fascinating shift for city brands and is something that we have discussed before on this blog. All of us are now involved in telling the story of the places in which we live and visit.

    The entire report is well done and worth a read. It’s also a free download (you’ll need to enter your contact info). But below are the top 10 world’s best city brands. Not really any surprises for me. What about for you?

    image

  • The rise of paradiplomacy

    In the words of Mike Bloomberg, then mayor of New York: “We’re the level of government closest to the majority of the world’s people. We’re directly responsible for their well-being and their futures. So while nations talk, but too often drag their heels, cities act”. Whereas diplomacy is carried out for the state, paradiplomacy is executed for the population.

    Rodrigo Tavares has an interesting article up at the World Economic Forum talking about the rise of foreign policy and international relations at the local level. The argument is that as cities rise (and they are certainly rising) paradiplomacy is inevitable.

    He admits that the diplomatic networks tend to be stronger for regions who have “flirted with sovereignty.” Regions such as Quebec, Catalonia, and Scotland are given as examples. However, this shift is by no means exclusive to them. Lots of examples in his article.

    It is also manifesting itself very differently compared to at the national level. And that’s part of the advantage. One example is London & Partners, which is an arm of the City of London that sells consulting services to other cities and nations who want to replicate its successes. Do nations do this?

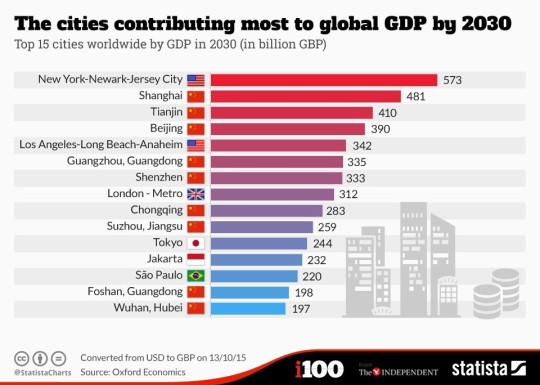
    I have argued before on this blog that our governance structures do not accurately reflect today’s urban reality. Rodrigo’s article is a reminder that we continue to underestimate the role of cities in the global economy.

    I’ll end with this chart from his article:

    image

  • Sign me up for Spectacles

    image

    Snapchat just changed their company name to Snap Inc. and announced a new product called Spectacles. They are sunglasses with an integrated video camera that captures a 115 degree field of view. Compared to the camera on your phone, this is more similar to what our eyes see.

    Here’s their announcement video:

    [youtube https://www.youtube.com/watch?v=XqkOFLBSJR8?rel=0&w=560&h=315]

    Some of you are probably thinking that Google already tried something like this and failed. But that doesn’t mean that Snap won’t be successful. I think Spectacles will be a huge success. 

    Evan Spiegel is calling them a fun toy right now, but lots of meaningful products start out that way (including Snapchat itself). Regardless, it strikes me as absolutely the right move for a company like Snap.

    What differentiates Snapchat is that, relative to other social platforms, the content that gets shared is far more natural and unfiltered. It empowers a different kind of conversation and a different kind of content creation.

    Still, there is something about pulling out your phone that takes you out of the moment. And Snapchat is all about sharing that moment. That’s where Spectacles come on. They are further minimizing the barriers to sharing.

    But here’s the other thing: Snap made them look cool. Google Glass looked positively dorky. I already want to take a pair of Spectacles snowboarding and on tours around different cities. I can think of so many interesting/entertaining use cases. If I were GoPro, I’d be anxious right now.

    Snap, if you’d like to send me a pair to test out, please shoot me an email. Thanks 🙂

  • Mapping the creative soul of US cities

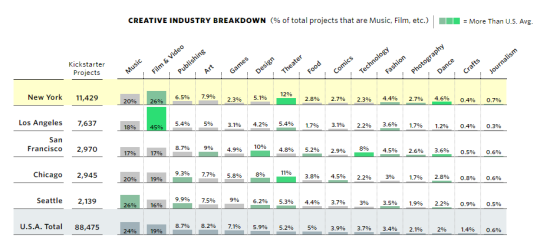
    Polygraph (visually-driven essays) has a great piece called, The Entire History of Kickstarter Projects, Broken Down by City. What they did was look at 88,475 Kickstarter projects to map the various creative communities across the US.

    Here’s a snapshot (you may need to zoom in):

    image

    In general, Kickstarter in the US sees a high concentration of music projects (24%) and film & video projects (19%). But where it gets interesting is to see which cities over-represent in certain categories.

    New York = film & video, theater, and dance

    Los Angeles = film & video (not surprisingly 45% of all projects)

    San Francisco = design and tech

    Chicago = theater

    Detroit = music

    Nashville = music (76% of all projects!)

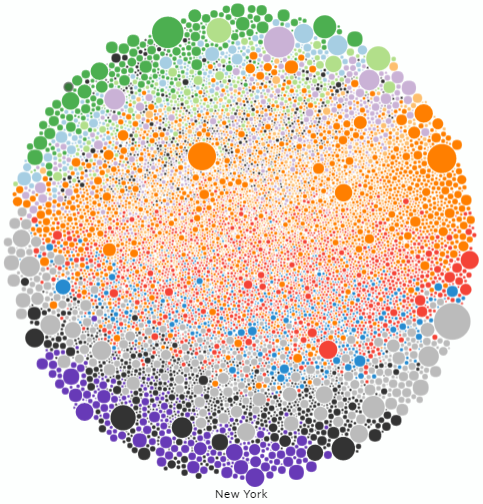
    They also measured the size of each project (number of backers) and created these neat bubble diagrams:

    image

    Above is New York. Red is music. Orange is film. And yellow is theater.

    I also like their explanation for why they did this project:

    Pretty much all existing attempts to map creative communities use census and jobs data. But creative efforts are often side-hustles. They’re garage/basement/cottage industries that will not appear in a census.

    It’s true. This data should be a much better capture of each city’s creative soul.

  • Should the Olympic Games be held in the same place every 4 years?

    I have argued before that hosting major events, such as the Olympics, can serve as a catalyst for completing meaningful public projects. But there is also an argument to be made that it’s not entirely worth it. The economic legacy is weak. The ROI simply isn’t there.

    Recently Harvard Business Review interviewed a gentleman named Chris Dempsey. Dempsey was a former Bain & Company consultant and the cofounder of the No Boston Olympics organization. He played a big part in Boston withdrawing their bid to host the 2024 Summer Games. Los Angeles ending up taking its place.

    His rationale is as follows.

    The International Olympic Committee was founded on June 23, 1894 by a Frenchman by the name of Pierre de Coubertin. At the time of its creation, the World’s Fair had already pioneered the rotational model of traveling to different cities.

    The most famous of these exhibitions was arguably “The Great Exhibition” held in London in 1851. Indeed, the plate-glass Crystal Palace structure which actually hosted the event was later seen as an important turning point in the history of architecture. It was designed by Joseph Paxton, who was an English gardener and architect.

    Of course, the world was a different place at the end of the 19th century.

    The events weren’t being broadcasted around the world in HD. We didn’t have social media. And transportation costs were high (economist Edward Glaeser reminds us of this in the talk I posted yesterday). So rather than ask people to spend weeks traveling the world by boat, it was decided that the show should travel to them. It should rotate places.

    This made sense then, but does it make sense now? I would love to hear your thoughts on this in the comment section below.

  • 70 years of LA

    The New Yorker recently published an interesting split-screen video tour of the same streets in downtown LA in the 1940s and today. 

    They have done a great job pairing up the same views and also panning in such a way that the middle divider seems to magically transport you 70 years.

    Here it is:

    [youtube https://www.youtube.com/watch?v=WIHfmisMLOY?rel=0&w=560&h=315]

    If you can’t see the video above, click here.

    In some cases (okay, many cases), I couldn’t help but feel like 1940s LA was far more urban and engaging. What did you think?

  • Journeys by walking

    Arup, the global consulting firm, has an interesting publication out called Cities Alive: Towards a walking world. The report highlights 50 benefits of walking and then 40 actions that city leaders can take today to transform their cities. The entire study was informed by examining 80 international case studies.

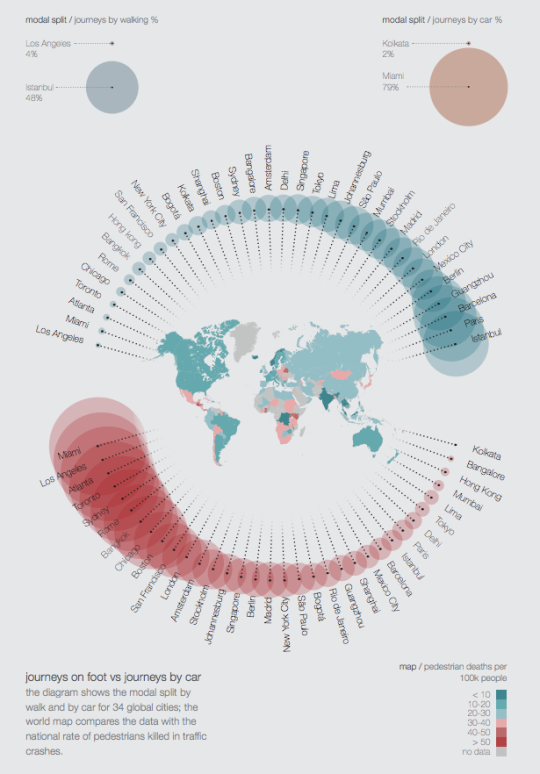
    As I was going through the report, the following diagram caught my attention. It compares journeys on foot vs. journeys by car for a collection of global cities.

    The turquoise circles represent % of journeys by walking. On the left is Los Angeles at 4%. And on the right is Istanbul at 48%.

    The red circles represent % of journeys by car. On the left is Miami at 79% (with Los Angeles right beside it). And on the right is Kolkata at 2%.

    The map in the middle of the circles represents pedestrians killed in traffic crashes per 100,000 people.

    I’m not sure where the data was drawn from, but it’s not all that surprising to see a few North American cities clustered towards the left (less walking; more driving). Still, I wonder how “journey” is defined.

    To view the full report, click here. Arup also produces a lot of other great content that you can download for free, here.

  • America needs a new map

    image

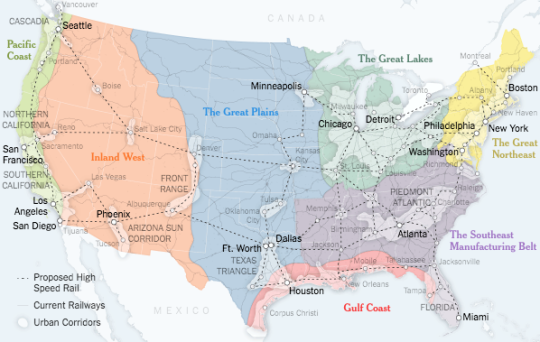
    Parag Khanna recently published an article in the New York Times calling for a new map for America

    Here’s why:

    “The problem is that while the economic reality goes one way, the 50-state model means that federal and state resources are concentrated in a state capital — often a small, isolated city itself — and allocated with little sense of the larger whole. Not only does this keep back our largest cities, but smaller American cities are increasingly cut off from the national agenda, destined to become low-cost immigrant and retirement colonies, or simply to be abandoned.”

    This is something that I’ve been writing about for awhile on this blog. As we continue to transition to an urban-based information economy, it strikes me that, here in North America, we’re going to need to refocus our governance structures around cities. We’re going to need to place our metropolitan regions at the fore if we want to continue competing with rising powers like China – which, by the way, seem to be adopting a megacity model.

    Here’s another snippet from the article:

    “While Detroit’s population has fallen below a million, the Detroit-Windsor region is the largest United States-Canada cross-border area, with nearly six million people (and one of the largest border populations in the world).

    Detroit’s destiny seems almost obvious if we are brave enough to build it: a midpoint of the Chicago-Toronto corridor in an emerging North American Union.”

    I’ve argued for this before and I continue to believe that it makes a lot of sense.

    Image: New York Times

  • Population growth across North American cities

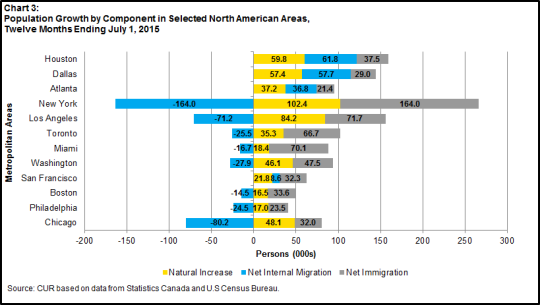
    The Centre for Urban Research and Land Development at Ryerson University recently published the following chart on their blog:

    It’s a look at population growth across a few North American cities, broken down according to natural increases, net internal migration from other parts of the respective country, and net immigration from outside of the respective country.

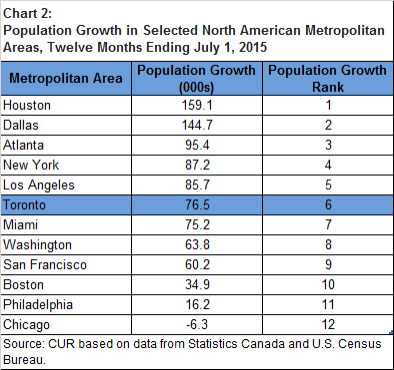
    When you sum up the pluses and minuses shown above, you get to population growth numbers that look like this:

    Houston, Dallas, and Atlanta are monsters in terms of population growth. They’re obviously smaller than New York and Los Angeles, and so on a percentage basis they are really adding a lot of people. Much of this has to do with the ease in which housing can be added in those cities and their relative affordability.

    Toronto is competitive with New York and Los Angeles in terms of an absolute number, but again our base is smaller so on a percentage basis we are growing faster. The big story with Toronto is our dependence on immigration to grow.

    The one city on this list that might surprise some of you is Chicago. Toronto and Chicago share many similarities and are often compared. But when you look at how the Chicago metropolitan area is shedding people, you see that, at least in this regard, it’s in structural decline.