Daily insights for city builders, delivered every morning at 6 AM ET. I’m Brandon Donnelly — a Toronto-based real estate developer and founder of Globizen. I’ve been writing here since 2013.

Tag: housing

  • Laneway housing represents 19% of all new single family and two family dwellings in Vancouver

    One of the criticisms surrounding laneway housing is that – while great – there is no way for this housing typology to have a meaningful impact on the overall housing supply equation.

    I’ve previously written about the impact of laneway housing in Vancouver. But I wanted to revisit some of the data following this tweet by GRIDS Vancouver, where they link to a spreadsheet they prepared using the City of Vancouver’s building permit data.

    Laneway housing was first allowed in Vancouver in 2009. In that first year, only 18 building permits were issued. But since then the number has grown steadily. In 2014, they hit 377. And in 2015 (up to September), they hit 360. So for the full year, it is highly likely they will show yet another year-over-year increase.

    Since laneway houses became permissible (and up to September 2015), a total of 1,885 building permits have been issued. During this same time period, 8,239 permits were issued for other low-rise housing, up to and including duplexes. This includes single family dwellings, single family dwellings with a secondary suite, and two family dwellings.

    So for a period of almost 8 years, laneway houses have represented on average 19% of all new single family and two family dwellings in Vancouver. If you include low-rise multifamily product into this equation (more than 2 units, but 3 storeys or less ), the percentage is still slightly above 17%. This is something. It’s not everything, but it is certainly something. 

    More conventional low-rise housing still represents a greater number and, of course, most of the new supply is coming in the form of condos, apartments and other higher density housing. But 17-19% are still meaningful numbers when part of the affordability problem is clearly a lack of supply.

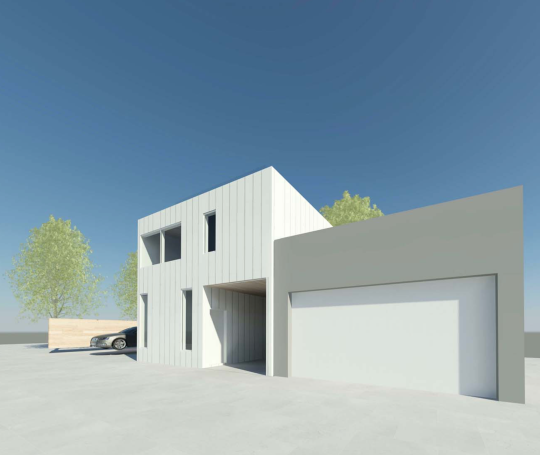
    It is for reasons such as these that I, along with many others, want to bring laneway housing Toronto. If you feel similarly, please consider supporting my prototype project by signing your name here.

    Update: A previous version of this post stated that 19% of all new low-rise housing in Vancouver had become laneway housing. This number was calculated on all low-rise housing up to and including duplexes, but excluded low-rise multifamily product. The above post has been updated to lend more precision to my understanding of the data.

  • Toward larger condo units

    One of the things that I’ve been following over the years (and writing about a lot on this blog) is average condo/apartment sizes, specifically in Toronto. I’m interested in this topic because I think it tells you a lot about what’s going on in the market and who is buying/renting.

    Developers are often criticized here for building tiny “shoebox condos.” It wouldn’t be unusual to see a building with an average unit size somewhere in the range of 600-700 square feet.

    But it’s important to keep in mind that the pull toward smaller units is largely because of one important reason: affordability. All things being equal, I’m sure that most people would gladly take an expansive 2,000 sf apartment. But how many people can actually afford a place that large? And for those who can afford it, many seem to opt for ground-related housing instead. So for the most part, the market has said: not many.

    But I’ve suspected for awhile that it was only a matter of time before we saw unit sizes start to creep upward. And indeed today there seems to be a trend toward larger units. I can’t tell you the exact percentage increase for average unit sizes across the city, but you don’t have to look very hard to find a proposed project with average unit sizes in the range of 1,000 to 1,500 sf. I spent this morning looking many of them up and going through their data sheets. If any of you have a larger sample size, please share it in the comment section below.

    To me this feels like a maturation of the market. More of us are deciding to move up, instead of out, which is absolutely what we need to do. Affordability, perhaps more than ever, is still a concern. But the confluence of a couple of factors seem to be expanding the multi-family market in this direction.

    One, empty nesters are starting to cash out of their large houses and they still want/need space. Two, the price of low-rise housing has increased so dramatically that it’s now out of reach for many and/or it no longer feels cost competitive on a per square foot basis. Three, Toronto’s status as a global city continues to increase and this is making it more of a magnet for foreign capital. And four, central and transit-adjacent housing is incredibly desirable for a large segment of the population. Horrible traffic is probably helping this one.

    If there’s any truth to my logic, then I wonder if we won’t see a bit of a bifurcation in the market, if we aren’t already. On the one end, there will still be the pull to shrink unit sizes and maximize affordability. See micro-units. But on the other end, there will be a product segment that now acts as a substitute for low-rise housing.

    I’ve said this before, but I’ll say it again: I think more families in condos and apartments would be a positive thing for the city.

  • Follow the sun and sprawl

    image

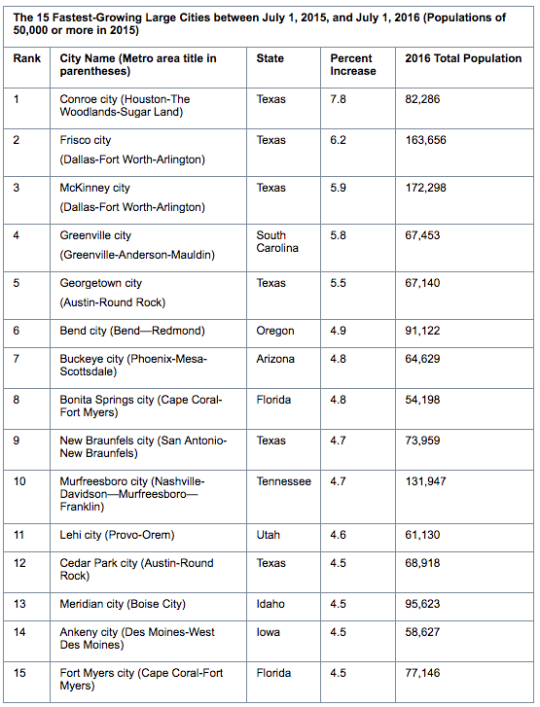
    The U.S. Census Bureau recently released it’s 2016 city and town population estimates. The press release can be found here.

    The headline isn’t a new one. Southern cities continue to grow quickly. This is not a new trend. Humans seem to like warm weather and the housing supply in southern cities tends to be more elastic. This keeps home prices relatively in check and allows the cities to more easily accommodate growth.

    From July 2015 to July 2016, 10 of the 15 fastest growing large U.S. cities were in the south (based on % growth). 4 of the top 5 were in Texas. 

    From 2010 to 2016, the population in large southern cities grew an average of 9.4%. Cities in the west clocked in at 7.3%. And cities in the northeast and midwest were at 1.8% and 3.0%, respectively.

    Two outliers near the top are Seattle and Denver. Since 2010, the population of these two cities grew 15.39% and 14.87%, respectively. I’m going to say it’s because of the skiing and snowboarding. Half-joking. For the top 25 large cities ranked by 2010-2016 growth rate, click here.

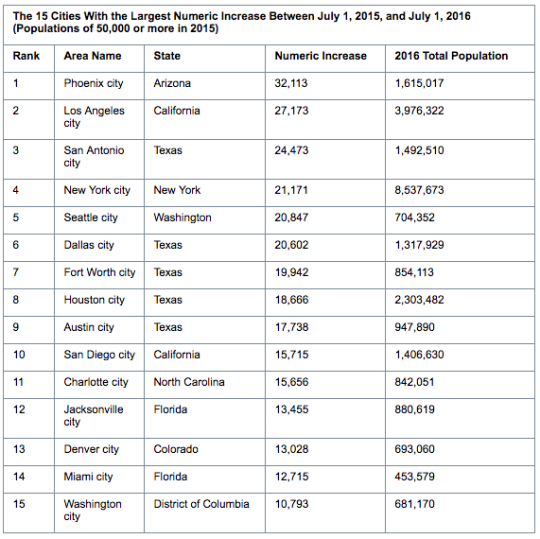
    In terms of absolute humans, Phoenix had the largest numeric increase between 2015 and 2016: 32,113 or about 88 people per day. After Phoenix it’s Los Angeles (27,173), San Antonio (24,473), New York (21,171), and Seattle (20,847). These are all city proper figures.

    It’s also worth noting which large cities aren’t growing. From 2015 to 2016, Chicago fell -0.32% and Detroit fell -0.52%. Philadelphia was only slightly positive at 0.19%. Going back to 2010, Chicago is still flat at 0.27% and Detroit is even more negative at -5.39%. Philadelphia is 2.5%.

    Follow the sun and the sprawl.

    The below charts are from the United States Census Bureau.

    imageimage

  • The 0.1%

    City Observatory recently published a post called, The 0.1 percent solution: Inclusionary zoning’s fatal scale problem

    I recognize the political attractiveness of this land use policy, but I’ve always been skeptical about its effectiveness. 

    Here’s an excerpt from the post:

    “While inclusionary zoning gets top mention as a preferred policy by many affordable housing advocates, there’s precious little evidence that its ever had more than a token effect on the size of the housing affordability problem in any city. In addition, because inclusionary zoning requirements essentially shift the cost of housing subsidies onto new development, they raise its cost, and likely reduce the number of units that get built–which tends to aggravate housing shortages and further accelerate prices.”

    Sadly, I think that many housing policies tend to be more about optics, than about impact. There’s rarely such thing as a free lunch.

  • HOT, HOT HOUSES

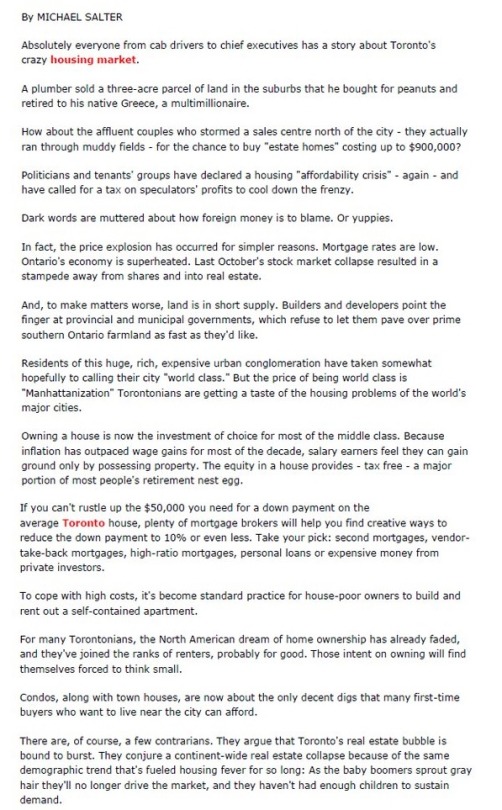
    Below is a piece by Michael Salter from the Globe and Mail. It’s all about Toronto’s HOT, HOT housing market. Michael’s message: Here are the real reasons why home prices are skyrocketing and why they are going to remain high.

    Did you find yourself agreeing with this article or did you notice that something was off? If you noticed something, it may be because this article was originally published on Friday, July 15, 1988. And by that time, the North American dream of home ownership had already died in Toronto.

    Here’s the header I cut out from above:

    Thank you to Tamsin McMahon for tweeting this out last weekend.

  • Toronto real estate is out of control

    You can’t have an Easter dinner in Toronto right now without somebody bringing up the topic of our “crazy” real estate market. 

    Below is a chart from Bloomberg showing the year-over-year change in home prices in the Greater Toronto Area since 1990. It also shows the historical average (in blue) and how in March 2017 we hit 4 standard deviations above that. Home prices rose 33% in March compared to a year earlier.

    If I were a realtor, I’d probably tell you that the market is hot hot hot. Now is the time to sell because you’ll get some absurd number above your asking price and now is the time to buy because prices are going nowhere but up. Don’t miss out. 

    I would like to try and be a bit more nuanced than that. Here are 3 thoughts:

    1)

    There’s no question that low rates / cheap money is one of the root causes of the real estate valuations we are seeing today. But frankly I have no idea when or if that will change. There is an interesting argument out there that capital is no longer scarce. Our economy is going through a fundamental shift, which is why real estate is not the only asset class seeing these sorts of valuations and growth figures.

    2)

    There are a number of global factors which are helping to cement Toronto’s position as an alpha global city and destination for human capital. Think Trump, Brexit, and so on. I agree with Richard Florida’s argument that our real estate market will see more – not less – pressure going forward. Here is a snippet from a recent interview with Florida in Toronto Life:

    I think Toronto is going to get an even bigger influx of the creative class. With the rise of Trumpism, more and more people who might otherwise have gone to the United States are going to come to Canada. We’re going to see American tech companies invest more and more in Toronto. And if we think the housing affordability and economic divide we see today is bad, it’s going to grow ever more gaping. 

    3)

    I believe that there are always opportunities in the real estate space, but that you have to be disciplined, focused on fundamentals, and willing to do things that others won’t. What bothers me is when I hear people say things like: “Real estate only goes up. You can never go wrong.” I started my career pre-2008 and lived in both the United States and Ireland. I saw what down looks like.

  • Peach skin

    I am fascinated by the way the Japanese think about housing. It is very different than the way we think about housing here in North America. Below is a small house tour that reinforces that. If you can’t see it below, click here.

    [youtube https://www.youtube.com/watch?v=4fEeh-8OFT8?rel=0&w=560&h=315]

  • Housing is a bitch

    I just discovered Steve Randy Waldman’s blog called Interfluidity and, more specifically, a post he wrote called: “Home is where the cartel is.” I am now following him.

    He starts off by saying that housing is a bitch, which is just him saying that urban housing is a difficult problem to solve. A truism for this audience.

    He doesn’t profess to have all of the answers, but he does write a thoughtful piece that covers, among other things: the “market urbanist” (supply-side) solution to solving housing affordability, the reasons why the “housing cartel” will never approve of this, and the inherent contradiction between housing as an investment and housing as a sustainably affordable good.

    He also offers up Singapore and Germany as examples of two very different housing markets. It reminded me of a tweet I retweeted this morning which shows Germany as having the 2nd lowest homeownership rate (45%) among OECD countries.

  • Important things

    image

    Last weekend I watched Minimalism: A Documentary About The Important Things. I’ve been reading the blog for awhile now (I blogged about it) and so the movie has been on my to-do list since it came out.

    Now, I am not a minimalist to the same extent as Joshua and Ryan, and some of the people featured in the film. I have not reduced all of my personal belongings to 51 things and I have not renounced any sort of permanent residency. I own some stuff.

    But I am very much attracted to the philosophy that less can be more. That less can make us happier. That quality is more important than quantity. And that we actually need far less stuff than we think we do, especially in a consumerist society like ours.

    One word that comes up a lot in the documentary is: deliberate. In other words, we should be more deliberate about the choices we make, the things we buy, and so on. Will it create value in my life?

    And that’s one of the reasons I like this notion of minimalism: It’s a challenge. You have to think. Because if you don’t, you will be told what to do and what to buy, and you will accumulate things without even knowing. It’s essentially a constant battle against excess.

    Perhaps the biggest potential for excess happens with our choice of housing, which is why small homes feature so prominently in the film. A tiny house isn’t going to be for everyone, but many people have certainly come to the realization that square footage alone does not equate to more happiness.

  • The long and narrow of property affordability

    image

    Lots sizes and dimensions vary from city to city, as well as from neighborhood to neighborhood. They come in many different shapes and sizes from long and narrow (common in Toronto) to rectangular or even wide and shallow. Charlie Gardner wrote a terrific post on this last year where he used Bing Maps to illustrate some of these differences. Tokyo, for instance, is shown as having more rectangular lots (32′ x 38′), whereas Buffalo is shown as having more long and narrow lots (30′ x 175′). Charlie then asks: why the prevalence of inefficient long and narrow lots? These dimensions obviously produce long and skinny houses.

    As he rightly points out in his post, there are economic reasons for this. Assuming you’re starting with deep blocks and lots, then there’s going to be a natural tendency toward subdividing and going long and skinny. That’s because the key dimension is frontage onto the street. The more frontages you create, the more front doors can be built, the more lots with access to the Mississippi can be created, etc. And that’s how you end up with 10-12′ wide row homes, which also helps to address overall housing affordability. This is not a new phenomenon.

    To further demonstrate this point, let’s look at how this phenomenon has translated into the condo market – specifically the mid-rise condo market here in Toronto. In this case street frontage morphs into window frontage (access to light). That’s now the guiding dimension. In a 1 bedroom apartment, that dimension might be something around 6-7m. That allows you to have both a bedroom and a living room with a window. So it makes for a great 1 bedroom or 1 bedroom + den apartment. (I’m ignoring corner suites for this thought exercise.)

    However, a tension often arises when you begin to look at larger suites, such as 2 bedrooms and 3 bedrooms. The obvious response would be to simply give over more window frontage. So instead of 6-7m, the suite may get 10m. This would allow you to create a split 2 bedroom apartment (both rooms get windows) with a living room in the middle. This would be considered a highly desirable floor plan.

    But up until now we’ve been ignoring the depth of the apartment. And as is the case with lot dimensions, this can have an impact on the amount of street/window frontage that gets designed. We’ve talked a lot about mid-rise buildings before on this blog and one of the challenges here in Toronto is that the 45 degree angular plane guideline produces deep floors on the bottom of the building and narrow floors on the top. Given this, it would not be unheard of to end up with 12m apartment depths on some of the lower floors.

    The counter argument would be that nobody is forcing these larger floor plates. Simply carve the building back. But the economic reality is that the margins are so thin on mid-rise buildings, that it would be inconceivable to give up this floor area. You have to max out the envelope.

    Why does this matter? Well let’s assume that the average downtown Toronto condo will cost you $857 per square foot. Using back of the envelope math, that means that the above 6m x 12m apartment (1 bedroom) could cost around $663,000 (774 square feet x $857 psf). And that the above 10m x 12m apartment (2 bedroom) could cost around $1,106,000 (1,291 square feet x $857). 

    These are obviously big numbers. Question becomes: Who will be able to afford these?

    So naturally the design exercise becomes about reducing the size of the apartments and often this means reducing the amount of window frontage. Of course when you do this, it means that one or more of the bedrooms will need to be pulled back from the front windows, which is how you end up with inset / recessed bedrooms (indirect light) and long and narrow apartments. These are often pejoratively referred to as “bowling alley suites”, but they are driven by a push for greater affordability.

    Again, this is not a new phenomenon. It is simply a trade-off that gets made. It’s the long and narrow of property affordability.