Daily insights for city builders, delivered every morning at 6 AM ET. I’m Brandon Donnelly — a Toronto-based real estate developer and founder of Globizen. I’ve been writing here since 2013.

Tag: housing

  • An even longer view on home prices — this time in Amsterdam

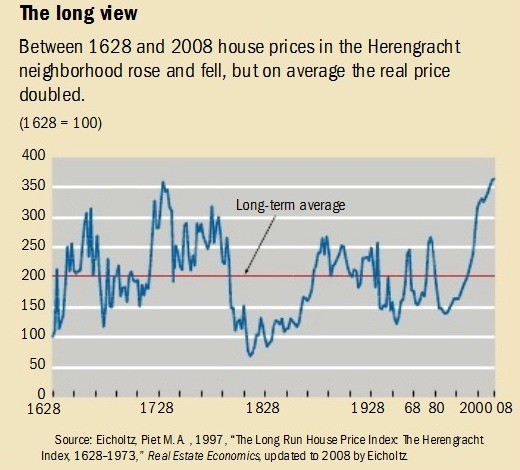
    In the comments of my recent post about Manhattan real estate prices during the Great Depression, a regular reader of this blog shared this terrific blog post (and corresponding research paper by Piet Eichholtz) about house prices along the Herengracht canal in Amsterdam from 1628 to 1973. Later it was updated to include up to 2008. It’s a long run house price index.

    Probably the first thing you’ll notice is that the index is highly volatile. Amsterdam enters its Golden Age, creates the world’s first stock exchange, and becomes the wealthiest city in the western world – house prices go way up. The tulip mania bubble pops – house prices go way down. It’s not until after World War II that prices sort of start to stabilize and increase, maybe, more consistently.

    In nominal dollars, the house price index increases 10x over the study period. But in real dollars most of that disappears. The biennial increase (that’s how the study was done) over the same period of time is just 0.5%. That translates into a doubling of house prices, which may seem quite good, except that remember it’s over a 380 year time period.

    image

    The Herengracht canal is a particularly good study because it was and has remained (or so I’m told) a desirable part of Amsterdam. This is an attempt to control for the variable that maybe some of the volatility could be explained by the area simply falling out of favor. (As a quick sidebar, the Herengracht was one of the first canals laid and dug out around the original city center of medieval Amsterdam during its Golden Age.)

    Generally, this finding is in line with one that economist Robert J. Shiller famously published a number of years ago where he argued that, when you correct for inflation, home prices actually look remarkably stable over long-run forecasts. In one study, he looked at 100 years of US home prices ending in 1990. Real home prices increased about 0.2% a year. What an outstanding hedge against inflation.

  • The Toronto and Vancouver housing markets

    CIBC World Markets recently published this report by Benjamin Tal talking about the Toronto and Vancouver housing markets. Here is an excerpt:

    “But when the fog
    clears it will become evident that the
    long-term trajectory of the market will
    show even tighter conditions. The supply
    issues facing centres such as Toronto and
    Vancouver will worsen and demand is
    routinely understated. Short of a significant
    change in housing policies and preferences,
    there is nothing in the pipeline to alleviate
    the pressure.”

    It’s a good read. Worth your time.

    One stat that stood out and directly relates to some of the topics that we frequently talk about on this blog is the shift in Toronto from low-rise to high-rise housing.

    In the report there’s a chart showing the “change in [housing unit] completions” in 2016 as compared to 2000. The switch from low-rise to high-rise is almost 1:1 in Toronto. In other words, we substituted high-rise housing for low-rise housing. 

    I think this speaks volumes about the fundamentals underpinning the Toronto condo/apartment market. We are continuing to build up because it is the future of housing in this city.

  • How Trump’s tax plan would impact the mortgage interest deduction

    image

    In the US you can reduce your taxable income by deducting the mortgage interest you pay toward your principal residence. You can’t do this in Canada, at least not on the property where you live.

    However, there are limitations. It is capped at loans up to $500,000 or up to $1M if you’re married and you file jointly. On the other end of the spectrum, you also need a loan big enough such that an itemized deduction will save you more money than the standard deduction.

    Not surprisingly, the MID is popular among homeowners. And from a public policy standpoint, one of its selling features is that it’s supposed to stimulate homeownership. But many have argued that it doesn’t actually do this – it unequally benefits people with larger mortgages. (Canada has a higher homeownership rate than the US.)

    Right now it looks like you need to buying a home worth at least $305,000 in order for the mortgage interest deduction to make economic sense for you. Again, if your loan isn’t big enough, you’re simply going to opt for the standard deduction. 

    In 2015, about 22% of all US taxpayers opted to take advantage of the MID. According to Zillow, only about 29% of all homes in the US are valuable enough for the MID to actually make sense. Though in some cities, like San Francisco, it’s pretty much all of the homes. Of course.

    Zillow also recently looked at what the recent tax reforms put forward by the Trump Administration would mean for the MID and the real estate market

    One of proposed changes is a doubling of the standard deduction. What this means, based on Zillow’s math, is that you would need to be buying a home worth at least $801,000 today for the MID to make sense. This also means that the deduction would now only benefit about 5% of all homes in the US.

    This would seem to only exacerbate the criticism that the MID does not in fact stimulate homeownership in the segment of the market that needs it the most. But perhaps this is the only politically palatable way of removing it – gradually.

    Photo by Erol Ahmed on Unsplash

  • Frontier city

    Opposition to new development is nothing new in this city. In fact, it’s the norm in almost all cities, regardless of how big or small the project might be.

    But the battle happening right now in Toronto with respect to the proposed 8 storey condominium project at 321 Davenport Road is certainly taking things to the next level. All over 16 units.

    Some of the most recognized names in this city have their hat in the ring and virtually every media outlet has covered the topic. See here, here, here, and here, for a small taste.

    Just this evening I saw that Shawn Micallef (yes camp) had sent a copy of his recent book to Margaret Atwood (no camp) in the hopes that she would read it and better appreciate why it behooves our neighborhoods to move past this “village mentality.”

    If you haven’t yet read it, it’s called Frontier City: Toronto on the Verge of Greatness. I’ve just moved it to the top of my reading pile. I hope more folks do the same.

  • The year of the condo

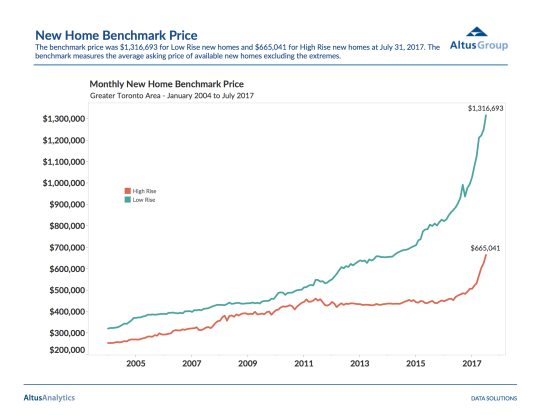
    Over the past 5 years or so, real estate headlines in the Greater Toronto Area have often focused on the rapid appreciation of low-rise housing. High-rise housing simply wasn’t appreciating at the same rate – at least in aggregate terms.

    But 2017 has brought a different story. 

    If you look at BILD’s “New Homes Monthly Market Report” (data provided by Altus Group as of July 2017), you can see that high-rise pricing is now on a similar trajectory to low-rise pricing.

    Here is that graph:

    image

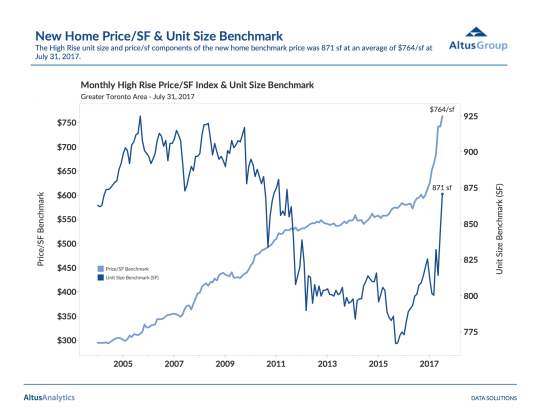
    This sharp uptick in pricing is also apparent when you look at the average price per square foot of new high-rise inventory. As of July, it was $764 psf across the GTA. See below.

    At the same time, average unit sizes have also jumped up to 871 square feet. So not only are new high-rise homes becoming more expensive on a normalized basis, they are also getting bigger, which further increases prices.

    image

    I recognize that we’re only seeing data up to the end of July, but, from the looks of it, 2017 is shaping up to be an extraordinary year for the condo.

    Of course, part of the reason this is happening is because remaining inventory for both low-rise and high-rise product is hitting 10-year lows. We’re back to the topic of supply.

    If you’re curious how some of these numbers have changed from the month prior (June 2017), check out this post.

  • Seattle vs. Vancouver

    A reader recently shared an article with me called: Why Seattle builds apartments, but Vancouver, BC, builds condos. Thanks for that.

    It’s a good summary of the differences between these two markets and why over the last five years less than 4% of all new residential units built in Seattle have been condos. The story is obviously very different in Vancouver.

    It’s also a good reminder that incentives matter. Capital has a funny way of flowing to where the returns are greatest.

    Chart: Sightline Institute

  • The city refused my laneway house

    image

    This afternoon I stood up at the Committee of Adjustment (Etobicoke York) to present the laneway house proposal that Gabriel Fain Architects and I have been working on for the past year and that I have been working on since 2009.

    But before I could start I was told that Councillor Palacio had just submitted a last minute letter to the Committee. I was given a few minutes to read it, but the big bold “REFUSE” was probably the only word I needed to read.

    I was then asked if I had read planning staff’s report. I acknowledged that I had read it and that I was aware that they were also recommending refusal of the application. I also noted that a number of my immediate neighbors sitting behind me were also opposed to the proposal.

    That’s how my presentation started. 

    At this point you might be wondering: why bother?

    I stood up today because, as most of you already know, laneway housing is something that I feel strongly about. This isn’t just about my individual project. I mean, why do all of this work for one small dwelling unit? For me, this is about city building and trying to affect positive change. (I would also love to live on a laneway.)

    I could go on here about how the proposal was shorter than other existing structures on the lane, how the FSI was in check, how we had carefully studied shadows, and how planning staff had already supported greater densities and multiple dwellings on lots of similar size in the area. 

    But that’s not what today was really about.

    Today I heard loud and clear that whether the proposal was a laneway tiki hut or a 2 storey laneway suite, the community did not want more people living in the area and they most certainly did not want more renters living in the area.

    My message to the Committee was that in my humble opinion this is inevitable. Look to Vancouver. Look to Edmonton. Look to many other cities. What we are debating today, or at least what we should be debating today, is what these laneway houses or suites or tiki huts are going to look like.

    Right or wrong, our proposal was an attempt to answer that question. We looked carefully at what others had done before us, including our friends at Lanescape and Evergreen, and we proposed something that we believed was sensitive to its context.

    We were unsuccessful.

    But here’s the silver lining. At the end of it all, and right before a motion was made to refuse the application, one of the committee members said something very impactful. He more or less said: “I agree with you. This is inevitable.”

    Sadly today was not that day.

    I would like to thank everyone who came out today and everyone who got up to speak in support of laneway housing. It meant a lot to me. Some of you are also readers of this blog and it was great to meet you in person. Thank you.

  • Less is more

    The Wall Street Journal recently asked: Venice Beach Is a Hot Place to Live, So Why Is Its Housing Supply Shrinking? 

    According to Issi Romem, chief economist at BuildZoom, it’s because Venice Beach is the toughest place in America to build housing.

    Here are some numbers from the WSJ:

    “The Venice Beach population is shrinking even as the local economy has boomed. The neighborhood had about 27,000 residents in 2015, about 3,800 fewer than in 2000, according to U.S. Census data. At the same time, the ZIP Code has added 4,000 new jobs, according to Jed Kolko, chief economist at employment website Indeed.”

    And here is a chart that speaks to the relationship between housing prices and housing supply:

    Housing supply, alone, isn’t going to solve all of our problems. But it certainly matters. Also, what’s up with Chicago?

  • Only 9% of new homes sold last month were low-rise single-family

    BILD (the Building Industry and Land Development Association) just released its June 2017 data for the Greater Toronto Area’s new housing market. You can read the full release here. But I would like to point out a couple of things:

    About 91 percent of the 6,046 new homes sold last month were multi-family condo apartments in high-rise and mid-rise buildings and stacked townhomes, while only nine percent were low-rise single-family homes.

    The average price of available new condo apartments continued to rise with an increase of more than $22,000 from May. June’s $627,000 average price marked a 34 percent increase from a year ago. The average available unit was 845 square feet with an average price per square foot of $742. A year ago, the average price per square foot was $587.

    From this, it’s once again clear that Toronto is in the midst of an incredible transformation from a low-rise city to a more vertical city. New supply on the low-rise side of the market is heavily constrained.

    I get the sense sometimes that many people in this city, and others, believe that access to a low-rise detached house should be a right. Go to school. Get a good job. And then buy that house with a backyard. 

    The data speaks to a very different reality.

    Photo by Victoria Heath on Unsplash

  • What land-use restrictions are doing to our cities

    I have Richard Florida’s recent book, The New Urban Crisis, sitting on my bedside table. I’m only about ¼ of the way through it, but I’m really enjoying it. I’ll write more once I’m done.

    What I instead want to talk about today is a recent (and related) article that Florida published in CityLab called: Did Land-Use Restrictions Save the Rust Belt? 

    In it, he leans on the research of two economists – Chang-Tai Hsieh of the University of Chicago and Enrico Moretti of the University of California at Berkeley – and makes 3 valuable points.

    They are:

    It is estimated that land-use restrictions (which limit development / supply) have reduced overall GDP in the U.S. by about 9% or approximately $1.5 trillion per year. It is also estimated that housing supply constraints alone lowered overall growth by more than half between 1964 and 2009.

    At the same time, these land-use restrictions may have benefited other regions – such as the Rust Belt – that would have otherwise lost more people and jobs to places like New York and San Francisco. The research found that without these land-use restrictions, employment growth between 1964 and 2009 would have been more than 1,000% higher in New York and almost 700% higher in San Francisco.

    The final takeaway is one that we’ve talked about before on this blog. One of the most effective things we can do to counteract geographic inequality is to build great transit; transit that connects both people and land to the most desirable areas of our city.

    And with that, Happy Canada Day weekend all.

    Photo by João Silas on Unsplash