Daily insights for city builders, delivered every morning at 6 AM ET. I’m Brandon Donnelly — a Toronto-based real estate developer and founder of Globizen. I’ve been writing here since 2013.

Tag: housing market

  • Why Millennial homeownership is so low

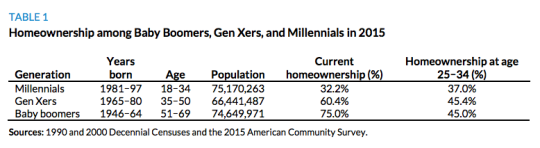
    The Urban Institute has a new study out that looks to explain why Millennial homeownership rates are lower than that of previous generations. The typical refrain is that Millennials have a lot more student debt and that the cost of housing in urban centers has risen faster than income levels. But this report tries to put some math behind those explanations. All data is for the US.

    Not surprisingly, marriage and kids are significant drivers, and Millennials appear to be delaying both. According to the study, being married increases the probability of owning a home by 18%. If marriage rates in 2015 were the same as they were in 1990 (this is the time period for the study), the Millennial homeownership rate would be 5% higher. Having a kid increases the probability by about 6.2%.

    There’s also a widening spread between the homeownership rates for more educated and less educated Millennials. Presumably the distinction is a 4 year university degree. Between 1990 and 2015, the spread between the two groups increased from 3.3% to 9.7%. This was identified as an area of “great concern” because of the possible long term implications.

    Combine this phenomenon with the stats that white households have a higher homeownership rate compared to all other racial groups and that having parents who are homeowners increases the likelihood of also owning a home (let’s ignore, for a second, the other intergenerational transfers of wealth), and you have a recipe for rising wealth disparities.

    Of course, some of you will undoubtedly argue that in this part of the world we are overly fixated on homeownership as a mechanism for wealth creation. I mean, there are many examples of very wealthy countries with homeownership rates that are far less than what they are here in Canada and the US. But that’s a discussion for a different blog post.

    If you’d like to go through the full Millennial Homeownership report, you can do that here.

  • Vancouver’s Empty Homes Tax

    In an effort to curb the much talked-about and much debated empty home situation in Vancouver (supposedly the number is ~20k vacant homes), the city, as many of you know, implemented an Empty Homes Tax.

    To enforce this, the City of Vancouver now requires that every year, every owner of residential property must file a status declaration. If you don’t file this by the deadline, the property is automatically deemed vacant and the tax (1% of assessed taxable value) and a penalty ($250) are applied.

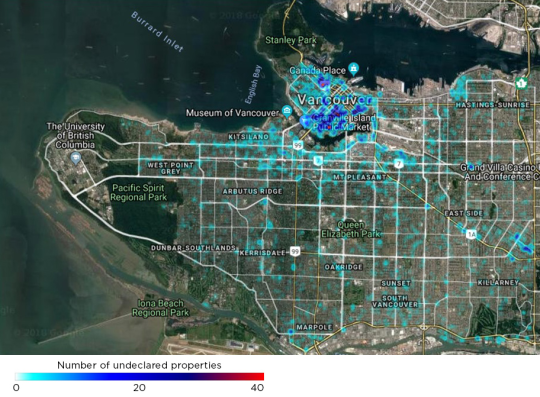
    Last month, 11 days before the 2017 deadline, the city published the below heat map showing the concentration of Vancouver property owners who hadn’t yet made their declaration. There were just under 4,000 undeclared properties.

    image

    But as Jens von Bergmann points out on his blog, Mountain Doodles (great data-driven blog), this was really just a map of where people live. Because if you also create a map of residential properties subject to the tax, which he did, it looks pretty similar to above.

  • New high-rise home prices up 39.5% year-over-year

    February data (2018) for the new home market in the Greater Toronto Area was released this past week by BILD and Altus. I seem to have gotten into the habit of writing about this every month.

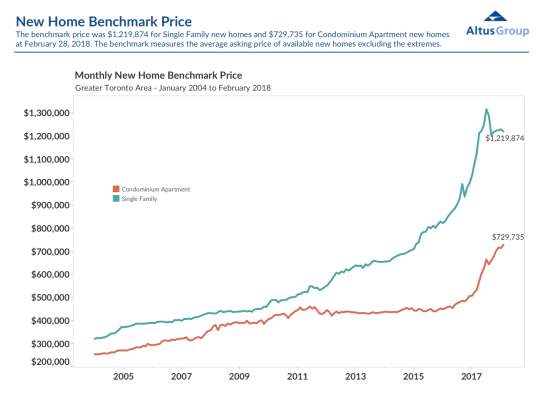
    The benchmark price for new low-rise single-family housing was down slightly from January to $1,219,874, but still up 12.8% from a year prior.

    The benchmark price for new high-rise housing was up a whopping 39.5% year-over-year to $729,735. But part of this is being driven by an equally dramatic increase in average unit sizes.

    Here is the relevant graph:

    image

    The story continues to be about tight supply, historically low developer inventories, and a lack of affordable low-rise product. 

    As I have argued many times before on this blog, I believe these factors — and in particular the last one — are, at least partly, driving this recent pop in high-rise pricing. People are priced out and now searching for substitutes.

    So my prediction continues to be that we will see a convergence (i.e. diminishing spread) between new low-rise and high-rise pricing.

    That will also bring about design and product changes on the high-rise side.

  • Thoughts on housing in the Bay Area

    I was out for drinks recently with a friend of mine who is a developer in California and she mentioned a few things to me that I thought were really interesting. 

    First, she talked about how virtually nothing gets built in the Bay Area “as of right.” And so the market is hugely supply constrained. She said, you’re lucky if you can get your entitlements in 2 years. It’s starting to take longer. I immediately said: “That’s Toronto.”

    Second, we talked about Proposition 13, which was timely given this recent post. One of the consequences of Prop 13, beyond helping golf clubs survive, is that longtime homeowners seem to be highly incentivized not to move. 

    Their property taxes are so below market that it can be more cost effective for them to stay put as opposed to downsize – even if they have too much house. This means far less turnover in the housing market.

    Third, there really does seem to be a feeling in the Bay Area that it’s at a breaking point in terms of affordability. When a successful software engineer making $200,000 a year can’t afford housing, people naturally start to look to other cities.

    We hear this refrain all the time in the media, but because I’m not active in that market, it was far more impactful hearing it from a friend.

  • One year of Inclusionary Housing in Portland

    image

    About a year ago, Portland enacted “Inclusionary Housing” policy requiring new apartment buildings of 20 units or more to offer up a portion of the units at below market rents.

    Developers are able to select from a few different options and the rents are calculated according to a percentage of the city’s median family income (30-80%). I’m not sure how this policy would apply to new condo buildings.

    This is an interesting account by The Portland Mercury of what this policy may be doing to the housing market. I say may because it’s only been a year and there could be other factors at play.

    Between 2013 and 2017, Portland typically built between 3,000 and 6,000 new units per year. Since the IH policy went into effect on February 1, 2017, 682 new units have applied for permit. 

    About half are coming from one developer who appears to be building the requisite affordable units in exchange for no parking minimums. They are now proposing buildings with zero parking.

    Again, in all fairness, it’s only been a year. But already Mayor Ted Wheeler is looking at other incentives to encourage more new construction in the central city. The biggest levers: height and density.

    All of this begins to speak to the very real impact of inclusionary zoning on development feasibility.

    Photo by Zach Savinar on Unsplash

  • 2017 was a record year for housing starts in Canada, but…

    According to Bloomberg (using data from CMHC), 2017 was a surprising record year for housing starts in Canada: 219,675 units. This is the most since 2007 and is up from 197,916 units in 2016.

    The explanation: job growth (nearly 400,000 new jobs) and population growth were both more robust than expected.

    Multiple unit project starts are also up significantly with 142,840 units starting in 2017. This is a 15% increase from the prior year. Of these units, 102,516 of them were “apartment-like homes.”

    But all of this is nationwide data. Look at what happened in Toronto and Vancouver:

    The increased activity mostly sidestepped land-constrained Toronto and Vancouver, the country’s two most expensive markets, but was robust in the suburbs and less pricey surrounding cities. Starts in Toronto fell 1 percent to 38,738 in 2017, while declining 6 percent in Vancouver to 26,204 units.

    This is not because of a lack of demand. It’s becoming systematically more difficult and more costly to build new housing in these two markets.

  • The impact of inclusionary zoning on development feasibility

    image

    After my recent post on inclusionary zoning in Ontario, I was asked to provide my comments on the draft regulation and on how inclusionary zoning could and will impact development feasibility. So I will endeavor to do that today.

    It’s important to first understand the costs and inputs that go into a development pro forma and how overall project feasibility is determined. For simplicity, let’s breakdown the costs as follows:

    – Land

    – Soft Costs

    – Financing Costs

    – Municipal Fees/Charges

    – Hard Costs

    All of these costs buckets are significant. For a project to be feasible, you obviously need the revenues of the project to be greater than the above costs. There also needs to be a remaining profit margin that is commensurate with the risk profile of the project and that meets your investor’s return expectations. Most developers rely on outside equity and debt to finance their projects.

    One of the misconceptions that I often hear is that people seem to think that the profit margin on projects is so great that developers could simply build affordable housing (or do many other things) if they weren’t so greedy. The reality is that development happens on the margin. It’s not easy to find sites and projects that make any sort of financial sense. More often than not they don’t.

    The other reality is that in a growing market all of the above costs are also continually increasing. If revenue (i.e. rents and condo prices) is also growing, as has been the case here in Toronto for many many years, then developers can generally absorb reasonable increases and continue building. But if revenue stops growing, grows at a slower pace or, worse, shrinks, then feasibility could disappear and development would stop.

    Now let’s talk specifically about inclusionary zoning. IZ is typically an incentivized or mandated requirement to provide a certain number of below-market housing units as part of new developments. Affordable housing is important. That’s why a number of cities already have inclusionary zoning policies – though it remains a fairly controversial tool.

    From a development feasibility standpoint, a mandatory inclusionary zoning requirement represents a decrease in revenue. There’s now a percentage of the units that can no longer be rented or sold at market prices. And so to maintain the project’s feasibility – because remember development happens on the margin – something has got to change.

    There are a few options.

    Option One: You could simply try and pay less for the land. As we have talked about many times on this blog, land is supposed to be the residual claimant. Work backwards from revenues and your other costs to determine what can be paid for the land. The problem with this option is that land prices tend to be sticky.

    Many or most landowners don’t give a shit about your development pro forma. They often have a number in mind and if you try and tell them that development charges just went up and you can’t pay as much for their land, they’ll simply sit on it and wait for someone else – even if that means waiting for the market to catch up (i.e. waiting for rents to go up).

    Option Two: Charge more for the remaining market units. If the market is sufficiently robust, perhaps this is an option. This is one of the reasons why inclusionary zoning often produces more units in markets where there’s already strong demand for new housing.

    But it’s also one of the reasons why IZ is controversial. You’re asking the other renters/buyers in the project to effectively subsidize the below market units. And there is research out there (previously posted on this blog) suggesting that in some instances IZ policies have created additional upward pressure on market rents and home prices.

    Option Three: Incentives are provided by the municipality to offset some or all of the additional burden placed on the project. This could come in the form of a density bonus, financial contribution, a waiving of other municipal charges/fees, and so on.

    Though I have questions about the details, this is something that was proposed in Ontario’s draft regulation (albeit not to the extent that the industry wanted). Now you know why I said and why I believe that these offsets are important to the industry and to overall housing affordability.

    My hope with this post was to provide the developer’s perspective, but also take a very matter of fact approach to inclusionary zoning. Most people recognize the importance of affordable and accessible housing. The question is how best to execute.

    Photo by Toa Heftiba on Unsplash

  • Inclusionary zoning is coming to Ontario

    On Monday the province of Ontario posted a draft regulation intended to establish a framework for inclusionary zoning. It builds on a bill that passed last year allowing municipalities – should they choose – to require affordable housing in new developments and redevelopments.

    Below are some, but not all, of the things that are being considered in the draft regulation. Some of these items were recommendations made by the development industry through the Ontario Home Builders’ Association (OHBA) and the Building Industry and Land Development Association (BILD).

    – The total number of affordable units or gross floor area dedicated to affordable housing units would not exceed 5% of the total units or 5% of the total gross floor area (excluding common areas). This number increase to 10% in high density transit station areas.

    – The affordable period would be a minimum of 20 years but no greater than 30 years.

    – There may be opportunities to provide the inclusionary zoning units off-site.

    – The policies would only apply to developments / redevelopments with 20 or more units.

    – The affordable component could not be used to determine community benefits under Section 37. Section 37 would also not apply if the proposed development (with IZ) is in a location where a development / community planning permit is used.

    – Municipalities would be required to offer incentives to help offset the IZ cost burden, but only if the development is not subject to a development / community planning permit. The incentives could include a waiver or reduction in application fees, parkland dedication fees, development charges, and so on. These offsets are very important to the industry and the affordability of the market rate units. But interestingly enough, increases in height and/or density are not being contemplated as a possible incentive or financial contribution.

    – The financial contribution would be based on the following formula: (A – B) x 0.4. A is the total sum of the average market price for all of the affordable housing units and B is the total sum of the affordable price for all of the IZ housing units. In other words, the intent is that municipalities would be required to offset 40% of the costs associated with providing the affordable units.

    Click here for the rest of the draft regulation. The OHBA also published this media release following the draft. They like the “partnership model” but were advocating for a 50/50 public/private cost share on all government-mandated units.

    If you’re looking for more reading on inclusionary zoning, check here, here, and here.

    Photo by Omair Khan on Unsplash

  • Federal court upholds decision that TREB’s housing sales data should be available online

    The Toronto Real Estate Board (Canada’s largest real estate board) and the Competition Bureau have been fighting for years over whether TREB’s housing market sales data, including realtor commissions, should be publicly available online.

    The Competition Bureau, as well as many forward thinking realtors, believe that gatekeeping historical sales data is stifling competition and innovation. It is. But TREB has been arguing – for a number of years I might add – that it is genuinely concerned about consumer privacy.

    Well on Friday the Federal Court of Appeal ruled that TREB cannot prevent its members from freely publishing data about what properties have sold for. This is a positive, albeit a small, step forward for open data and innovation.

    But perhaps not surprisingly, TREB has already said it would appeal the decision to the Supreme Court of Canada and apply for an order staying the release of the above data until this new appeal gets decided.

    So there’s still more fighting to take place. Nevertheless, I do have a few thoughts.

    The claim by TREB that they are deeply concerned about consumer privacy is nonsense. Call up any realtor in this city and they’ll tell you and send you whatever historical sales data you want. This is about maintaining an information asymmetry that forces more consumers to connect with agents.

    But as many sensible realtors have already explained publicly in the media, if gatekeeping information is such a critical component of the value that TREB members bring to clients – and the board is certainly clinging to it – then realtors and/or the industry have a serious problem on their hands. 

    Time to evolve.

    I would also argue that our current archaic setup distorts the market. There’s simply too much friction associated with accessing good sales records and so the result is greater opacity in the market. Say all you want about the efficacy of realtors, more friction = less engagement. Free the data and empower members to leverage and build on top of it.

    In my view, this is a positive step forward. But it still feels like a small one. I’m actually surprised by how long this status-quo battle has been going on. Hopefully it gets wrapped up soon so everyone can get on with what matters most: innovating.

    Photo by Fernando Reyes on Unsplash

  • The Toronto and Vancouver housing markets

    CIBC World Markets recently published this report by Benjamin Tal talking about the Toronto and Vancouver housing markets. Here is an excerpt:

    “But when the fog
    clears it will become evident that the
    long-term trajectory of the market will
    show even tighter conditions. The supply
    issues facing centres such as Toronto and
    Vancouver will worsen and demand is
    routinely understated. Short of a significant
    change in housing policies and preferences,
    there is nothing in the pipeline to alleviate
    the pressure.”

    It’s a good read. Worth your time.

    One stat that stood out and directly relates to some of the topics that we frequently talk about on this blog is the shift in Toronto from low-rise to high-rise housing.

    In the report there’s a chart showing the “change in [housing unit] completions” in 2016 as compared to 2000. The switch from low-rise to high-rise is almost 1:1 in Toronto. In other words, we substituted high-rise housing for low-rise housing. 

    I think this speaks volumes about the fundamentals underpinning the Toronto condo/apartment market. We are continuing to build up because it is the future of housing in this city.