Daily insights for city builders, delivered every morning at 6 AM ET. I’m Brandon Donnelly — a Toronto-based real estate developer and founder of Globizen. I’ve been writing here since 2013.

Tag: hong kong

  • Frenetic dim sum

    image

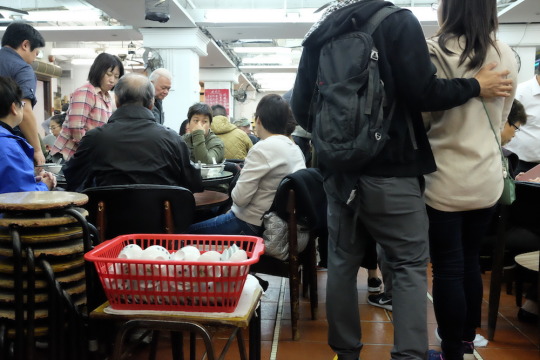
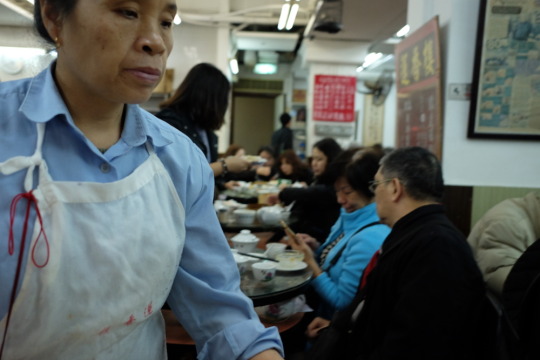
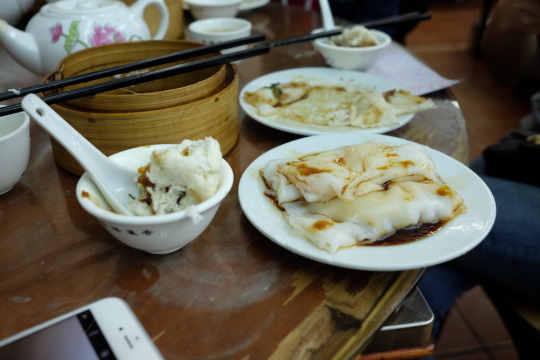
    We went for dim sum (breakfast) yesterday morning. We wanted an authentic experience and found a place in Monocle’s Hong Kong travel guide called Lin Heung Lau. It’s an “institution” in Central that has been around since 1926. Locals would later tell us that the place is good but they probably would have sent us elsewhere.

    image

    It was of course packed when we arrived and we quickly learned that you need to be aggressive in this place if you hope to get any food. There’s no line at the front and nobody is going to seat you. Instead, you circulate around the room and find your own spots. If nothing is available, you simply hover over a communal table until something opens up.

    image

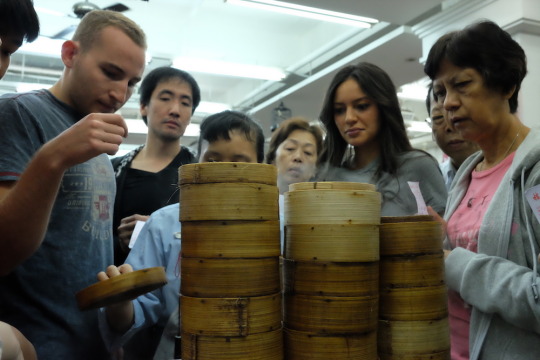
    This also means not waiting for the dim sum carts to come around to your table. If you do that, none of the good stuff will be left. Pull out your sharp elbows and go to work as soon as you see one come out of the kitchen. This is how most of Hong Kong seems to work. There’s too many people in too little of a space to be a polite Canadian.

    image

    I thought the whole experience was great. Although, I could have probably done without the laundry (underwear included) hanging up in the bathroom.

    image

  • Inside-outside

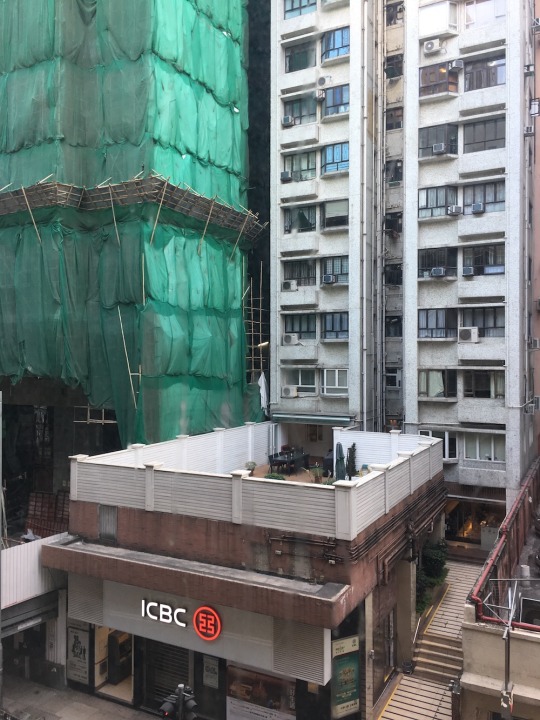
    Take a look at this photo from Central in Hong Kong and note the MEP (mechanical, electrical, and plumbing) systems running up the cutout in the middle of the tower. Also note the bamboo scaffolding next door and the epic terrace on top of the ground floor bank. The building on the opposite side put parking on top of its podium.

    image

    I was told that systems are commonly run on the outside of buildings here to maximize interior square footage. Again, space is a precious commodity in this city. But it also speaks to not having to worry about freeze-thaw cycles. Winter in Hong Kong has so far equaled me walking around in a t-shirt.

    These exposed systems look ugly as all hell, but I suppose they also mean not having to break open drywall when you have a problem.

    I am fascinated by the relationship that buildings have between interior and exterior space. In cold cities like Toronto we are forced to hermetically seal off our buildings from the elements. We have to worry about thermal bridging and about heat tracing cold spots.

    But in a city like Hong Kong I would imagine that the greater concern is stifling heat and humidity. All of this comes through in the built form.

  • Inverted podium

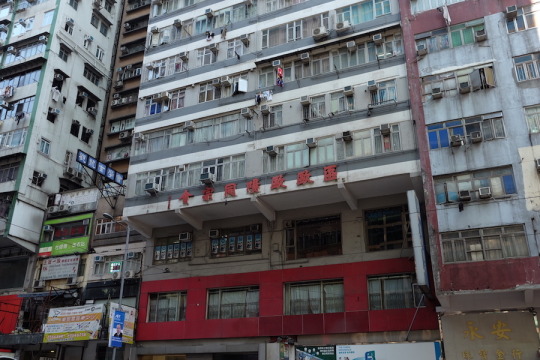
    One of the things that I noticed yesterday morning on my walkabout from Wan Chai to Causeway Bay is that some/many of the buildings in Hong Kong actually step-in, as opposed to step-back, once you get above the base or “podium.” In many cases the step-in comes out almost to the curb line.

    (Note how the reference point is the public realm. You step back from it or you step into it.)

    Here is an example:

    image

    Setbacks and step-backs are longstanding urban design tools because they can allow more light to reach the street and they can visually break-up the mass of a building and establish clear datum lines, among other things.

    We’re obsessed with them in Toronto because everyone is always trying to hide building height. But in Hong Kong, space is such a rare commodity that it seems to be about filling in every available inch.

    I posted this remark on Twitter yesterday and it was suggested that some of these step-ins may have been the result of additions made after the fact. They seemed original to me, but whatever the case may be, they are an existing condition that I have started calling the inverted podium.

  • Good morning Hong Kong

    image

    It’s about 6:30 am on new year’s eve day and I’ve been awake since around 4:00 am because of jet lag. I initially resisted, but now I am up and starting my day. 

    The coffee shop downstairs doesn’t open for another hour so this is coming to you live from my surprisingly spacious hotel room. (I’ve been in far smaller both here in Hong Kong and in New York.) There’s a wide array of teas available in this room, but sadly no coffee. I could go for a coffee right now.

    I took the express train in from the airport last night, which is what I did the last time I was in Hong Kong over a decade ago. It takes just over 20 minutes and it is a great way to get into Central. It immediately signals to you that this city thinks and cares about efficiency.

    The experience of landing and getting into a city is an important, but often neglected, consideration. For many people this is their first impression of a place and so it only makes sense to pay attention to it. 

    Think of it like fine dining. Most nice restaurants will greet you at the front, take your coat, and show you to your table. Few expect you to come in the backdoor and wander bewildered through the kitchen. But that’s what some cities ask you to do after you land.

    Come to think of it, I left Toronto aboard our own airport express train. That’s standard practice for me. And so I started and ended my 2-day journey on efficient rail. I’m good with that.

    Before signing off for today, I would like to apologize for missing yesterday’s post. I was in the air for over 19 hours without internet. I also didn’t have much to say. As always, you should expect me to show up here every day. But expect more travel-related posts over the next week to go along with my Instagram posts.

    I would also like to point you toward this tweet storm by Shawn Micallef (discovered during jet lag haze). Please do me a favor and check it out. It is a hilariously accurate satire about many of the city building challenges that cities face today, told by way of a miniature “Dickens Village.”

    https://platform.twitter.com/widgets.js

    And with that, I wish you all a happy new year. See you on the other side. Bring on 2018.

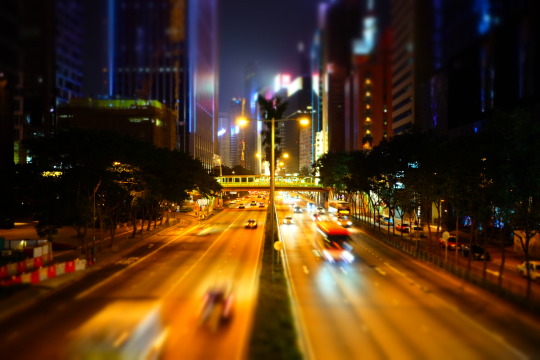
    Photo: Night shot of Gloucester Road from pedestrian overpass

  • The most expensive housing market in the world

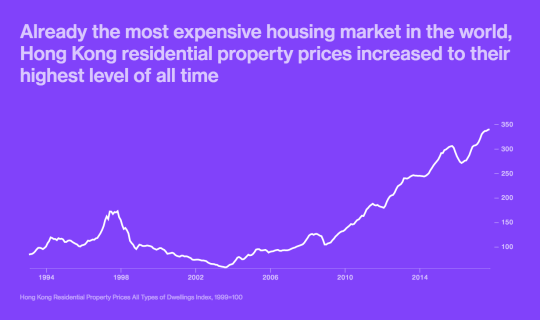
    It’s that time of year again. Time to get contemplative about the last year. Bloomberg recently posted this: 2017 – The Year in Money. Below is a capture from the real estate section.

    Here you can see the run up to the 1997 Asian financial crisis and also the Hong Kong “handover”. Initially, I thought the uncertainty of the handover would have reduced demand, but I guess there were other factors.

    According to the book Hong Kong 20 Years after the Handover, the property and stock markets at the time were being fuelled by high inflation and low interest rates. This made real interest rates negative and created a strong incentive to borrow and invest.

    I love seeing longer range indices because it helps to put things into perspective. If you started your career in real estate in Hong Kong around 2003-2004, you might think that prices generally always go up. 

    But consider how long it may have taken to get back to where you were if you had instead bought at the peak of 1997-1998.

  • Transit advertising according to the numbers

    This morning I saw this tweet about Toronto streetcar advertising. The author has a “big problem” with public transit being fully wrapped in ads and so she decided to tweet her local Councillor to see if these could be somehow limited in size.

    My first thought was: I wonder how many people would accept higher fares in exchange for fewer/no advertising. Is this something people care about? Because personally, I’ll take the lower fares in exchange for someone trying to monetize my attention. I mean, every social network I use is already selling my attention off as their product.

    But then this got me thinking about what the actual numbers look like. So let’s look at some of those for not only Toronto, but also for Hong Kong, since many people view that as the gold standard as far transit authorities go.

    For the year ending December 31, 2016, the Toronto Transit Commission (TTC) posted a total operating revenue of $1.204 billion. This represents about 41% of total revenue – the rest comes from subsidies.

    If you drill down into operating revenue, advertising makes up $28 million or about 2.33% of total operating revenue. So a pretty small number. If you tried to shift this number over to “passenger services” revenue (transit fares), it actually wouldn’t increase fares by that much. But presumably fares are already at some profit maximizing number.

    Switching to Hong Kong’s MTR Corporation, their numbers have to be unpacked a little differently because the group has a number of diverse business lines, including property development.

    For the year ending December 31, 2016, total revenue from Hong Kong Transport Operations was HK$17.655 billion (almost all fare revenue). Advertising falls within the Hong Kong Station Commercial Businesses group and that company posted revenues of HK$5.544 billion for the same time period.

    To try and create some sort of comparison, I’m ignoring all of the other segments within MTR.

    Within Station Commercial Businesses, advertising revenue alone makes up HK$1.09 billion or about 20% of that group’s total revenue. The rest comes from station retail rent (the biggest chunk), telecom, and some miscellaneous station income. 

    If you add up Transport Operations and Station Commercial Businesses, total revenue was HK$23,199 billion for the year ending 2016. Advertising comprises about 4.70% of this – so more than double that of Toronto.

    It’s also worth noting that MTR’s station retail rental revenue is about 3.4x that of its advertising revenue. In the case of Toronto, the TTC actually makes more money off advertising than it does from “Property Rental.” I’ve always thought this was a missed opportunity. Transit and land use go hand in hand.

    In any event, I’m far less fussed about advertising on transit. But what are your thoughts? Let me know in the comment section below.

    Photo by Tomo Nogi on Unsplash

  • The Hong Kong window ledge

    image

    My friends at the architecture practice Valente Rodgers told me something fascinating about the Hong Kong real estate market last night. Both partners worked as architects in Hong Kong for a number of years.

    In Hong Kong, you’re allowed to deduct certain projecting windows from your calculation of Gross Floor Area

    This is provided they’re a certain height above the finished floor level, they don’t project beyond certain distances from the outer face of the building’s structural elements, and so on. The precise measurements seem to vary depending on things like the building’s use.

    Since space is such a precious commodity in Hong Kong, it shouldn’t surprise you that lots of developers and architects take advantage of this. The result being a proliferation of these projecting window ledges all across the city. 

    It’s a phenomenon that happens in many cities when a perfectly legal loophole is found in the land use policies.

    In Toronto it used to be solariums. You could also deduct these from your overall GFA, which means a lot of them them got built in condos and apartments of a certain vintage.

    In New Orleans it was the camelback house. These were houses with a single storey toward the street and a second storey toward the rear of the property. This was done because property taxes were assessed based on the height of the house as it met the street. Pushing the density toward the rear of the lot meant homeowners weren’t taxed more. 

    I find these outcomes fascinating because they have absolutely nothing to do with architectural intent and everything to do with trying to optimize within a given framework.

    But what’s even more interesting about the Hong Kong example are some of the downstream externalities.

    Firstly, it sounds to me like these projecting windows have become a normal part of underwriting projects in Hong Kong. Meaning, if you don’t factor in these projections, you’re effectively giving up free GFA. (Can anyone familiar with the HK market confirm this?)

    However, building these projections also means you can’t do unmodulated and clean floor-to-ceiling windows. And if that’s the desired aesthetic, somebody has got to be willing to pay for that “luxury.” So arguably there’s a socioeconomic dimension to having and not having this ledge.

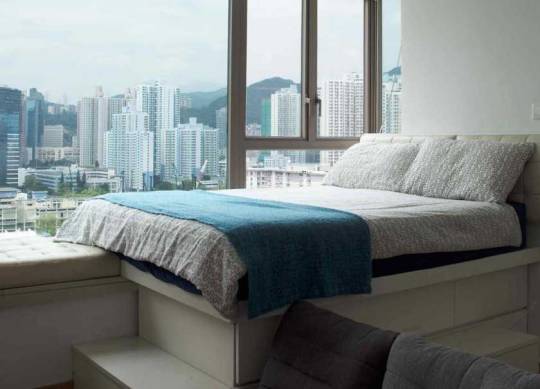
    Secondly, because space comes at such a premium, these ledges are fully taken advantage of and furniture makers have responded by designing pieces that can dovetail with them.

    Below is a photo of a bedroom in Hong Kong that I found on bohemia.life:
    image

    This may be a custom bed and I don’t know how deep that window projection is, but it begins to show you how valuable these ledges can be from a space perspective.

    I think we should try and come up with a name to describe these sorts of built form phenomena. If you have any ideas, please drop them in the comments below. And if any of you are familiar with the HK market, let me know if I’m off the mark with any of the above.

    Photo by Jason Wong on Unsplash

  • Lessons in transit success

    image

    Dylan Reid of Spacing was recently at the International Transport Forum in Leipzig, Germany and has been publishing some interesting posts related to transit. Here is one about what makes transit systems succeed and fail.

    I really like the point that we too often think about transit projects as culminating with a big opening, while overlooking the importance of operations. It’s a bit like focusing on the wedding ceremony and forgetting that the ceremony is only really there to (hopefully) mark the beginning of a lifelong union.

    One of the reasons why this is important is because, as Reid points out, “fares need to provide a strong and consistent proportion of the agency’s funding.” So you need bums in seats, which means you need to build the right transit in the right locations. In other words, a new subway line through a low density suburb will probably result in an abysmal farebox recovery ratio.

    At the same time:

    “…fares will rarely cover all of an agency’s costs. Hong Kong’s Kam noted that, to be truly autonomous, an operator needs an additional dedicated, independent source of revenue. This cannot be based on additional transit-related non-fare revenue (e.g. advertising) – such revenue is helpful but never significant. It needs to be an external source. In Hong Kong, it is based on the agency’s extensive property ownership, but in other cities it could be a congestion charge, a dedicated sales or income tax, or other mechanism. Only with such a source can the agency have the independence to make its own choices for reinvestment and improvements.”

    This is one of the reasons why I am such a strong supporter of road pricing.

    Another point that Reid makes is that transit agencies should always have a consistent pipeline of new projects, rather than erratic periods of expansion. This makes a lot of sense given what it takes to ramp up for a large infrastructure project. But it’s obviously contingent on having sustainable funding sources.

    Click here if you’d like to read the rest of Dylan Reid’s post.

  • The lure of super-places

    image

    If you’re a very talented person, you have two choices: you either move to New York or you move to Silicon Valley. This is the message that Peter Thiel delivered to a conference being held in Chicago earlier this month. Not surprisingly, it pissed a few people off.

    Peter responded by saying that he was simply illustrating the “extreme version” of a metaphor about the impacts of globalization and technology. And while it certainly doesn’t sound very nice if you’re sitting in Chicago, or the countless other fantastic cities between the coasts, I can appreciate what Peter is getting at.

    Saskia Sassen is known for coining the term global city. These are cities which play an important role in the functioning of the global economy. But what has happened, she acknowledges, is an even further concentration of activity within a select few “super-places.”

    Here is an excerpt from a Financial Times article by Simon Kuper (2014) talking about Amsterdam’s position in the world:

    “…a new, higher category of cities may now be emerging: global capitals. Amsterdam has risen but New York, London and Hong Kong have risen faster. The Dutch elite is moving to Amsterdam; but many ambitious Dutch people no longer want to join the Dutch elite. They want to join the global elite. That often requires moving to a global capital.”

    Anecdotally, I can say that almost everyone I know who has left Toronto for an opportunity has moved to New York, Silicon Valley, London, and so on. They have moved up the rank of global cities/capitals.

    So while Peter may not have chosen the right way to deliver this message, I do believe it is a message worth delivering.

  • Where the world’s billionaires live

    The Martin Prosperity Institute here in Toronto recently published an interesting report called The Geography of the Global Super-Rich.

    What they did was use the Forbes 2015 Billionaire List to chart billionaires and billionaire wealth by location and by industry. They also looked at the wealth gap in each location and whether the wealth was self-made or inherited.

    A correlation analysis was also done to see what key variables – such as population, density, economic output, global city standing, VC investment, and so on – were positively correlated with a greater concentration of super rich people.

    There are 1,826 billionaires across the world according to Forbes. The researchers were able to match 99% of them to a specific metro area / primary residence.

    Here are the top 20 metro areas in terms of the number of billionaires:

    image

    Look at Miami at #9. 

    I suspect that this may surprise some of you. But Miami has grown into a significant global city. As one of my friends from Miami likes to tell me: “The best thing about Miami is that it’s a Latin American city that’s so close to the United States.”

    Here are the top 20 metro areas in terms of total billionaire wealth: 

    image

    A bunch of changes on this list because of extremely wealthly people and families in places like Bentonville (Arkansas) and Omaha.

    One of the conclusions of the report is that the size of the city generally matters:

    “The geography of the super-rich is a function of larger cities. Both the number of billionaires and their net worth are positively associated with the population of global cities, with correlations of 0.56 for the number of billionaires and 0.44 to their net worth.”

    Here is a chart comparing population to the number of billionaires:

    image

    Cities such as New York, Moscow, and Hong kong, which sit far above the blue line, have more billionaires than their population size would predict.

    Here is a similar chart comparing venture capital investment to the number of billionaires:

    image

    Once again, there is a positive association.

    Finally, here are a two charts that show which industries have produced the most billionaires:

    imageimage

    If you’re interested in this study, you can download the full report here. All of the charts were sourced from the report.