Daily insights for city builders, delivered every morning at 6 AM ET. I’m Brandon Donnelly — a Toronto-based real estate developer and founder of Globizen. I’ve been writing here since 2013.

Tag: dallas

  • My prediction for Amazon HQ2

    “Now the trick is that we gotta look like we don’t need this shit and they give us the shit for free.“ –Mike Peters

    This is a line from one of my favorite movies, Swingers. Short video clip here. Mikey and Trent are in a Las Vegas casino trying to play it cool. They’re looking to make a scene at a table and Mikey throws out this gem of a line. He knows that people want what they can’t have and that confidence matters.

    I was reminded of this line today after Amazon announced its HQ2 Request for Proposal (full RFP document here) and every city, from Chicago and Toronto to Philadelphia and Dallas, started swooning over the prospect of housing Amazon’s second headquarters in North America. 

    But to be clear, I do not think this is a bad idea. I actually think Amazon HQ2 is an incredible city building opportunity that would generate countless positive externalities for the selected city. I’m thrilled that Mayor John Tory will be personally “leading the charge” with respect to Toronto’s response.

    Over $5 billion in construction and as many as 50,000 employees making on average over $100,000 per year. Amazon is looking for about 500,000 sf of space in phase 1 (2019) and up to 8,000,000 sf in total. Based on the RFP, they seem to be pegging their capital investment at somewhere around $600 per square foot.

    If I’m being as objective as possible, I honestly believe that Toronto is the city to beat in his competition. I think it will come down to access to talent. Human capital is the lifeblood of a company and Trump’s immigration policies simply put U.S. cities at a disadvantage in this regard.

    Of course, Toronto is also awesome. So that’s my prediction: Amazon HQ2, Toronto.
  • International and domestic migration in the US

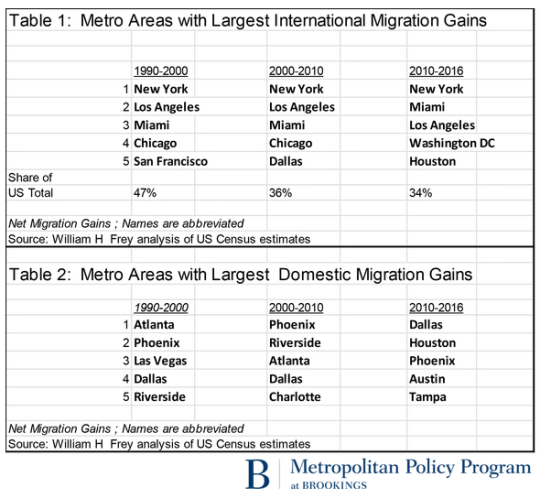
    In response to President Trump’s proposed immigration bill, Brookings recently analyzed census data from earlier this year to demonstrate the importance of immigration for growth within much of the United States. 

    I’d like to share three tables from their analysis.

    The first two look at international migration grains and domestic migration gains over the last 3 decades (the last decade isn’t quite a decade).

    Here you can see that New York, Los Angeles, and Miami (all port cities) have dominated international migration to the US since 1990. But at the same time, international migration has become less geographically concentrated. From 1990-2000 the top 5 cities received almost half of all immigrants moving to the US. More recently, that number has dropped to 34%.

    Domestic migration is different in that it’s a zero sum game. When one US city gains, another US city loses. Here there is a very clear migration trend toward cities in the southwest – arguably because of weather, job growth, cheaper housing, and probably a bunch of other factors.

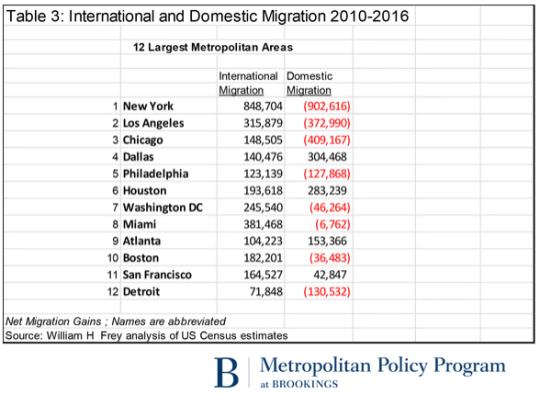
    If we look at actual international and domestic migration numbers over the last 6 years, the 12 largest metropolitan areas look like this:

    The key takeaways here are that 8 of these cities are losing people to domestic migration and only 7 of these cities have a positive net migration number – meaning their population is actually growing.

    What is clear is that the international migration column is a pretty important one if you believe that growth is valuable. 

    If you’re Dallas, Houston or Atlanta, maybe you care a little less about that column. But for most of the other cities, international migration is either the only way you’re growing (look at Miami go) or keeping your population losses in check (see Philadelphia).

  • Opendoor is now selling ~300 homes per month

    Farhad Manjoo of the New York Times published an article this morning about Opendoor – a startup that I have written about multiple times on this blog – called, The Rise of the Fat Start-Up. (His definition of “fat” is that the startup owns lots of hard assets, which considered atypical in tech.)

    Below are a couple of interesting tidbits from the article:

    • Opendoor has raised over $300 million in equity and over $500 million in debt since inception.
    • Opendoor plans to be in 10 cities by the end of this year.
    • Average commission charged on Opendoor is 7.5%, which is higher than a traditional real estate agent and higher than what was quoted before in the press. The higher % is because of certainty and convenience.
    • Opendoor offers a leaseback option if you’d like to stay in your house for a period of time after you’ve sold it.
    • Their conversion rate (offers made to closings) is about 30%.
    • Other startups are now in the market with similar models, including Offerpad and Knock. Zillow is working with Offerpad on a pilot. Someone is starting to feel threatened.

    The article also quotes a blogger and real estate analyst named Mike Delprete. Heads-up: His blog is called “Adventures in Real Estate Tech.” I’m sure this will appeal to many of you. I obviously just subscribed.

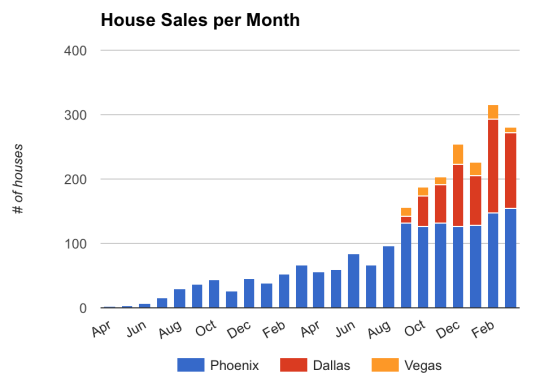
    Mike dug into MLS records in order to figure out Opendoor’s transaction volumes, since the company is not releasing this information. Here’s what he found (the chart is up to March 2017):

    The trend line is certainly moving in the right direction. But Mike also believes that Opendoor is only netting around $8,320 in profit per home and that much of it is driven by appreciation. There’s also substantial risk in owning so many homes – each one is usually held for a few months.

    But you can be sure they’re thinking well beyond where they are at today. Expect many more updates on this blog.

  • What could a connected lockbox mean for the residential real estate business?

    image

    I just discovered an interesting Dallas-based startup this morning called TOOR. They were on Shark Tank and haven’t yet launched their product, but it’s essentially a connected lockbox. Lockboxes are a mainstay of the residential real estate industry (they hold the keys so that co-operating agents can show a property) and they are becoming even more common nowadays because of Airbnb rentals.

    What caught my attention about TOOR is the app that goes along with the lockbox that also allows people to search for homes. Once you’ve found a home you can even find an agent for an escorted tour. I’m not clear on the exact workflow, but I am thinking that if you buy this connected lockbox you then have the opportunity to put your home up for sale on their platform.

    This is interesting because the app will also verify user identities and scan people’s IDs, so it helps to solve the security problem that agents today now solve. I could imagine the app storing my credit card so that if I go into a home unescorted and I do something mischievous, it then charges me. It also makes it really easy to just drive around and pop into homes by instantly scheduling appointments.

    In any event, I may have the exact user flows a bit wrong, but it’s fascinating to think about how something as simple as a connected lockbox could start to chip away at the status quo.

  • A money back guarantee on your next home

    image

    I’ve written about Opendoor.com a few times. As far as I can tell, they are the furthest ahead in terms of disrupting the residential real estate market. So I like to follow them quite closely.

    They’ve recently launched some new features, so I figured it would be a good time to check-in on what they’re up to. But first – for those of you might not be familiar with Opendoor – here’s what they do.

    Opendoor offers instant liquidity to homeowners by buying homes site unseen. The fee they charge seems to amount to less than 10% of the value of the home. 

    They also say that they typically offer prices that are about 1-3% less than the market value of the home 3 months into the future. (Apparently 3 months is the average time-on-market for the cities in which they operate.)

    Once they’ve bought the home, they then make improvements and put it back on the market. As of today, they are buying about 10 homes a day in the two markets in which they operate (Phoenix and Dallas). They are spending about $75 million a month buying homes.

    To mitigate their risk, they won’t buy a home built before 1960, a home that was pre-fabricated, a home with a solar lease, and so on. They also stick to values that are between $100,000 to $600,000. But apparently this covers off about 90% of homes in the United States. (You can read their full FAQ here.)

    To accomplish all of this, they have raised about $110 million in venture capital.

    What’s fascinating about all of this is that they are starting to create a seamless marketplace. As they continue to buy more homes (and aggregate supply), more buyers are starting to come to their marketplace. They also allow people to easily find local contractors.

    Over time as they gain scale and as their algorithms improve, one could imagine their pricing becoming more competitive, them taking more of the market, and them bearing much less market risk as homes quickly trade. 

    They liken their model to car trade-ins. Apparently 60% of people who buy a new car are trading in an old one. That’s an interesting comparison that I hadn’t thought about before.

    So what’s new?

    Two things

    First, they are offering a 30 day full refund on new home purchases. In other words, if you buy a home through their platform and, for whatever reason, you end up not liking it, they’ll buy it back (minus some transaction costs and so on).

    Second, they are providing a 180-point inspection report to buyers and if anything breaks in the first two years of ownership (presumably it is something that contravenes the inspection), they’ll come and fix it.

    These additions are helpful because it starts to target buyers, which will help them fill out the other side of their marketplace. It also promotes greater transparency because now they’re partially on the hook for the home’s performance.

    I like what they are doing and, again, I can’t think of any other company making such big bets in this space.

  • Population growth across North American cities

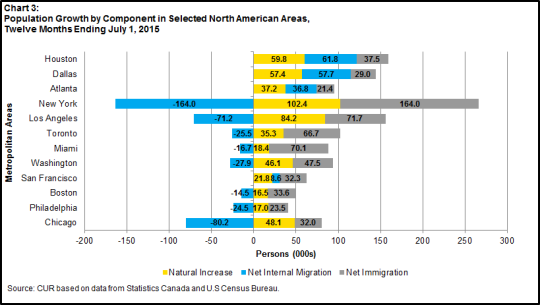
    The Centre for Urban Research and Land Development at Ryerson University recently published the following chart on their blog:

    It’s a look at population growth across a few North American cities, broken down according to natural increases, net internal migration from other parts of the respective country, and net immigration from outside of the respective country.

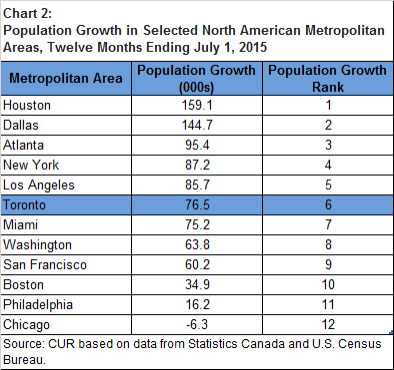
    When you sum up the pluses and minuses shown above, you get to population growth numbers that look like this:

    Houston, Dallas, and Atlanta are monsters in terms of population growth. They’re obviously smaller than New York and Los Angeles, and so on a percentage basis they are really adding a lot of people. Much of this has to do with the ease in which housing can be added in those cities and their relative affordability.

    Toronto is competitive with New York and Los Angeles in terms of an absolute number, but again our base is smaller so on a percentage basis we are growing faster. The big story with Toronto is our dependence on immigration to grow.

    The one city on this list that might surprise some of you is Chicago. Toronto and Chicago share many similarities and are often compared. But when you look at how the Chicago metropolitan area is shedding people, you see that, at least in this regard, it’s in structural decline.

  • The new Toronto 2030 District

    Photograph Financial District, Downtown Toronto, Canada by Yeonju SEONG on 500px

    Image: Financial District, Downtown Toronto, Canada by Yeonju SEONG on 500px

    Today I learned about something new called 2030 Districts. They are: “designated urban areas committed to meeting the energy, water, and transportation emissions reduction targets of the 2030 Challenge for Planning.”

    Toronto’s new 2030 District is downtown, which is bound by the lake in the south, Bathurst Street in the west, Dupont Street and Rosedale Valley in the north, and the Don Valley in the east. 

    It’s the first district outside of the US. The other established districts are in Seattle, Pittsburgh, Los Angeles, Denver, Stamford, San Francisco, and Dallas.

    The goals for Toronto’s district are as follows (quoted from 2030 Districts):

    • To cut district-wide emissions in half, including zero-emissions from new buildings by 2030.
    • Support a better understanding of where and why energy use, water use, and GHG emissions occur across the District.
    • Work in partnership with building owners, service providers and conservation groups to accelerate the adoption of best practices for building design and management.
    • Facilitate broad stakeholder dialogues to uncover and overcome systemic barriers to long term reductions in energy use, water use and GHG emissions.

    I’m looking forward to following and learning more about this initiative. I think many of us can agree that producing less, not more, GHG emissions in the future would be preferable. And we know that the bulk of it comes from both buildings and transportation.

  • What happens when you demolish a highway

    Earlier today I tweeted this:

    //platform.twitter.com/widgets.js

    It’s a link to an article talking about 5 cities – New York, Milwaukee, Seoul, Portland, and San Francisco – who all demolished an elevated highway that used to run through their downtowns.

    To be completely fair, some of these cities didn’t really have a choice. San Francisco’s Central Freeway was so badly damaged in an earthquake that it had to be closed. But it doesn’t make the lessons any less relevant.

    In all of these cases, the elevated highways were taken down and never replaced with another highway. Some were turned into large boulevards. Others were turned into parks. But in none of the cases was a new road of similar capacity built.

    Intuitively it might seem like this would cause utter chaos. I mean, where were all of these cars going to go? 

    But that didn’t happen. Instead, demand redistributed itself. Car volumes dropped dramatically. More people took transit. Some people took other routes. And some people traveled at different times. Oh, and nearby property values all went up.

    And the reason this happened is because of something that economists call induced demand (I’ve written about it before, here). What it means is that as you increase the supply of some valuable good (such as free highways), more of that good becomes demanded.

    In other words: more free highways = more cars on the road.

    So if you’re a city – like Toronto – with an elevated highway running through your downtown, you should give this some serious thought. The outcomes aren’t as bad as you might think. In fact, they’re quite good.

    Image: Seoul via D Magazine