Daily insights for city builders, delivered every morning at 6 AM ET. I’m Brandon Donnelly — a Toronto-based real estate developer and founder of Globizen. I’ve been writing here since 2013.

Tag: citylab

  • The performance of cities proper

    Richard Florida is currently running a four-part CityLab series on the economic performance of America’s cities. What makes this study somewhat unique is that it looks at cities proper, rather than at their larger metro areas. In some cases there may not be that much of a difference. But in other cases, the performance of the city proper could be very different from that of the broader area.

    Here are the fastest and slowest growing cities from 2012 to 2017:

    Here are the fastest and slowing growing job markets:

    And here is the growth in share of adults with a graduate degree:

    It’s interesting to see Seattle at the top of the population growth list. It is not a sprawling sunbelt city. It is an expensive tech hub. And it is also interesting to see Miami’s strong employment and education growth. Years ago, Paul Graham wrote an essay arguing that tech hubs have two prerequisites: capital and nerds. He went on to argue that Miami has lots of the former, but not much of the latter. Maybe that’s changing.

  • The densest urban cells in America

    Garrett Dash Nelson recently published a study looking at urban density on a cell-by-cell basis for a number of US cities. Each “cell” is a 30 arc-second grid cell, but you can think of them as being approximately one square kilometer. The goal of the project was to better define urban density and do it in a more granular way. City averages don’t tell you a whole lot about how neighborhoods vary, and they can be skewed by the denominator you use. i.e. Where are you drawing the urban boundary?

    You can play around with his interactive study, here. Each city can be explored according to its 200 most dense cells. One interesting takeaway — though it is probably not all that surprising to this audience — is that New York City is really a unique place when it comes to American cities. If you look at the above chart (sourced from CityLab), you’ll see that most other US cities don’t come close to it in terms of urban density. New York’s 200th densest cell is still denser than the most dense cells of Boston, the Twin Cities, and of Dallas.

    The y-axis is the total population in each grid cell.

  • Google announces $1 billion investment in housing

    This week, Google announced a $1 billion investment in housing across the San Francisco Bay Area. Here is the blog post announcement by CEO, Sundar Pichai. And here are a couple of paragraphs from the post explaining how this is expected to work:

    First, over the next 10 years, we’ll repurpose at least $750 million of Google’s land, most of which is currently zoned for office or commercial space, as residential housing. This will enable us to support the development of at least 15,000 new homes at all income levels in the Bay Area, including housing options for middle and low-income families. (By way of comparison, 3,000 total homes were built in the South Bay in 2018). We hope this plays a role in addressing the chronic shortage of affordable housing options for long-time middle and low income residents.

    Second, we’ll establish a $250 million investment fund so that we can provide incentives to enable developers to build at least 5,000 affordable housing units across the market.

    In addition to the increased supply of affordable housing these investments will help create, we will give $50 million in grants through Google.org to nonprofits focused on the issues of homelessness and displacement. This builds on the $18 million in grants we’ve given to help address homelessness over the last five years, including $3 million we gave to the newly opened SF Navigation Center and $1.5 million to affordable housing for low income veterans and households in Mountain View.

    Google is not alone in its efforts to improve housing supply in the Bay Area but, according to CityLab, this is “the single largest commitment by a private employer.”

    There’s a lot of debate about the value of housing supply, alone. But in 2017, the Bay Area added 3.5x as many jobs as it did housing. I think most people would agree that’s a suboptimal, and potentially unsustainable, mismatch.

    Also, if large companies such as Google and Microsoft are making these sorts of investments, it is likely that they’re worried about housing unaffordability impacting their ability to attract and retain top talent going forward.

    Perhaps this is a signal for just how unsustainable this mismatch has gotten.

  • San Jose approves 800-unit co-living project

    Earlier this year, an 800 unit co-living project was approved in downtown San Jose. The developer is Starcity. And it is said to be the largest co-living project in the pipeline in the United States right now.

    A few months later (presumably because of this project), San Jose also created a new “co-living” land-use classification. It is similarly thought to be a first for US cities.

    I think it still remains to be seen how broad the market can be for co-living. Do older generations also want to go back to dorm-like living? Or is this a housing solution mainly for twenty-somethings?

    At the same time, it’s not an entirely new housing idea. I like the parallel that Sarah Holder of CityLab draws between today’s co-living and yesterday’s single room occupancy buildings (SROs).

    There are, of course, many differences, including the amount of space dedicated to common areas (the community aspect). But in both cases, part of the value proposition is about affordability.

    Where do you see co-living going?

  • The geography of gyms

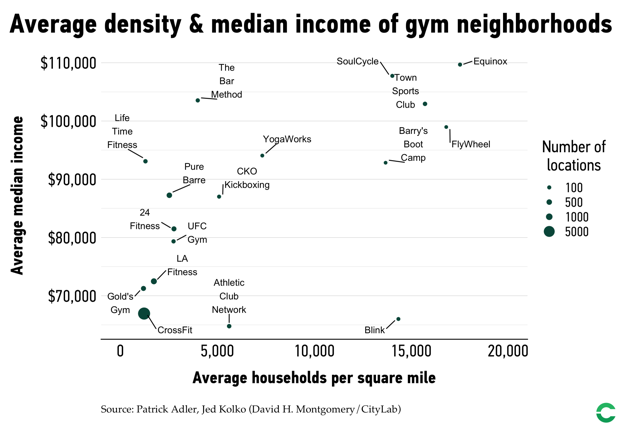
    Richard Florida and Patrick Adler recently looked at the geography of gyms across the United States. They analyzed 17 different fitness chains, over 10,000 gyms, and nearly 5,000 zip codes. Full article over here at CityLab.

    image

    The findings probably won’t surprise you, but it’s still interesting to see some of the data. Gyms and fitness studios tend to concentrate themselves in affluent neighborhoods with a high number of college graduates.

    The median household income of the average zip code with a gym or fitness studio is $72,720. This is compared to $56,694 for all zip codes. And when it comes to zip codes with an Equinox, SoulCycle, The Bar Method, or Town Sports Clubs, the median income jumps to over $100,000.

    Above is from the second post in the two part series they are doing on “the geography of fitness.” For the first one, click here.

  • Housing supply is like food supply

    A few months ago I wrote about an upcoming book by Alain Bertaud
    called, Order
    without Design: How Markets Shape Cities.
    Well the book has just come out
    and CityLab just did an interview with him. 

    Bertaud has worked all around the world from Yemen to China and his experiences, particularly in places that were transitioning to market economies, lend an interesting perspective.

    I like this bit on designing in China:

    I quickly realized that if you do not have prices to guide you, you end up relying on arbitrary norms. For example, in China, the central government decided that every home must have one full hour of sunshine each day. So you would plug in the height, latitude, and angle of the sun at winter solstice for your site, and that would formulaically spit out the permitted density of housing.

    And I like the comparison he makes between food and housing supply:

    I compare it to food: You can’t solve a famine by simply mandating that everyone eat 2,000 calories a day. That’s absurd. You have to bring in more food. In the same way, cities like San Francisco have to increase the supply of floor area, and let consumers determine the size of units.

    So I just ordered a copy of his book

    For the rest of his interview with CityLab, click here.

  • US cities with the most corporate HQs

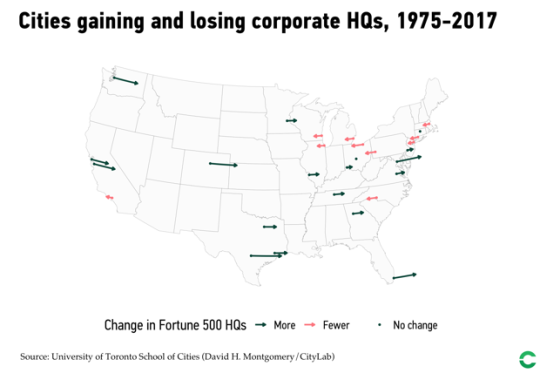
    The University of Toronto School of Cities recently looked at the changing economic geography of Fortune 500 companies across the US from 1975 to 2017. Here is a diagram of the results taken from CityLab:

    New York sits at the top with 70 corporate headquarters as of 2017. But the San Francisco Bay Area is now the second largest center with 35 headquarters – a testament to tech.

    The study does, however, omit service firms, as these weren’t tracked in Fortune’s list back in 1975.

    Also noteworthy is the specialization that has taken place across specific cities and regions. Here is another excerpt from CityLab:

    America’s headquarters geography reflects the substantial variation and specialization of the U.S. economy. New York leads in finance and business services, consumer services, and goods and materials. But Houston leads in energy, San Jose in tech, and Chicago in retail and wholesale. Chicago also ranks second in consumer services, and goods and materials, and Dallas takes third in energy. Other cities like Nashville and Minneapolis take third in consumer services, and goods and materials, respectively.

    The full article can be found, here.

  • The vertical city

    We often talk about agglomeration economies in terms of their horizontal clustering within cities. But a new paper in the Journal of Urban Economics – summarized here by Richard Florida – has looked at the other dimension: the vertical clustering of economic activity within tall buildings. 

    Here is an excerpt from Florida’s piece in CityLab:

    Economic activity is also sorted vertically, with higher-profile and more profitable firms occupying higher building floors. Law offices are disproportionately represented on the highest floors, taking up more than a third of floor space above the 40th floor, compared to 12 percent of floor space between the second and 40th floors. Finance, insurance, and real estate take up roughly 20 percent of floor space above the 40th floor, compared to 23 percent between the second and 40th floors. Business services, engineering, and miscellaneous other industries are also more likely to take up more space below the 40th floor.

    The other takeaway is that there appears to be a greater rent premium attached to higher floors (vertical movement) than for being located closer to the central business district (horizontal movement). This surprised me. But I also don’t have access to the full paper. Is the dataset just US cities?

    Nevertheless, the idea of a vertical city interests me a lot. And I agree with the authors of the report that, for perhaps obvious reasons, it is far less studied compared to horizontal development patterns.

  • From country club to urban basecamp

    CityLab recently published an article talking about the difficult time that golf-centric country clubs are having in attracting young people (and minorities and women). Their reasoning is that Millennials are saddled with student debt and can’t afford the fees; Millennials find these sorts of clubs stuffy and overly formal; and Millennials are put off by the long history of these places being only for rich white males.

    The result is that golf and country club memberships are down about 20% since 1990. In the 90s there were more than 5,000 full service clubs of this type in the US. And today it’s somewhere south of 4,000. In the 90s, about 9 million people aged 18 to 34 played golf (again in the US). And today that number is somewhere around 6.2 million. All stats taken from the article.

    But at the same time, the article argues that Millennials may still like country clubs, they’re just about 10 years behind because of higher education, travel, and delayed family formation. The article also talks about the rise of private clubs like Soho House, as well as others. And so here’s one counter argument: Millennials are open to private clubs and many have the means. They just want them to be, well, cooler and more urban.

    As a young person who largely fits within the trend line described in the CityLab article, my gut tells me that this is largely a case of changing consumer preferences and urbanizing wealth. That’s why we’re seeing established country club operators open up “urban basecamps.” But that’s my view. What is yours? Let us know in the comments below.

    Photo by Andrew Rice on Unsplash

  • Where are all the kids?

    This evening, when I was reading the internet, I came across this New York Times article from 2017 talking about how San Francisco has the lowest percentage of children of any of the largest cities in the U.S. It’s around 13% of the population. (Supposedly it was the second lowest in 2015. Pittsburgh was first.)

    The article goes on to claim that the city has approximately the same number of dogs as it does children. That number is somewhere around 120,000. Not surprisingly, many blame the city’s prohibitive housing costs as the main culprit for the lack of kids. Families simply cannot afford to live in the city.

    This got me searching for more information. Richard Florida looked at similar data back in 2015, but it’s important to note that he looked at metro areas and not the city propers. So the data doesn’t speak to whether families were forced to move out from the urban core to the suburbs in search of more affordable housing or for more space.

    Nevertheless, he finds no statistical association between the share of children in a city and things like urban density, economic output per capita, or median home prices. He instead finds that the share of children is positively correlated with two main factors: immigration and with ethnicity – specifically people of Latin origin.

    Click here if you’d like to read the rest of Florida’s analysis. And if any of you have additional data on this topic, please do share it below. I think I’m going to continue digging into this question of kids and cities.

    Image: Photo by William Bout on Unsplash