Daily insights for city builders, delivered every morning at 6 AM ET. I’m Brandon Donnelly — a Toronto-based real estate developer and founder of Globizen. I’ve been writing here since 2013.

Tag: boston

  • 738,000 single-family homes were built last year in the US

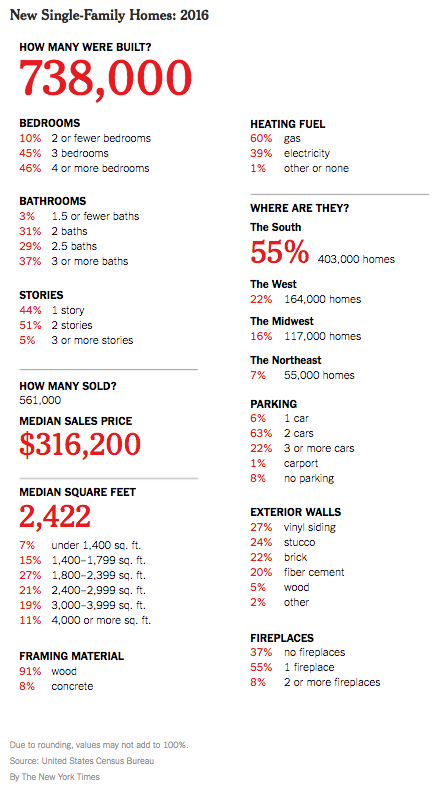
    The New York Times recently published “a portrait of new single-family homes” in the US in 2016. Here’s that portrait:

    For those of those living in dense urban centers, this portrait is perhaps a reminder that in many other places a large single-family home can be had for about the price of a studio apartment.

    Nothing in the above portrait likely surprised you, but it’s interesting to note that over half of all new single family homes delivered last year were in “The South.” Only 7% were built in the dense northeast.

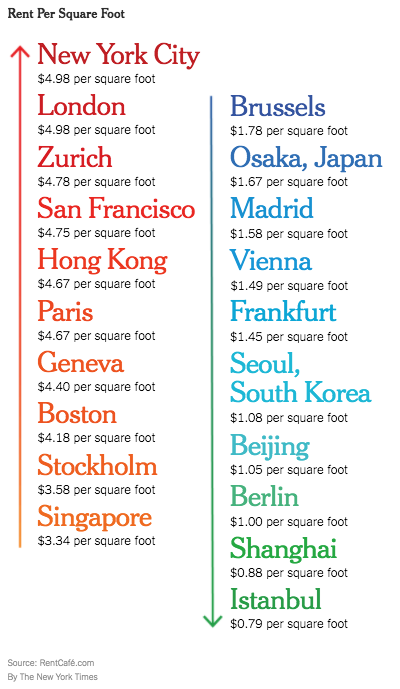
    The New York Times also recently looked at “international rents per square foot” using data from RentCafe. Here they are:

    New York City sits at the top with an average rent of $4.98 psf. This is across all boroughs. I am surprised by how low some of these international rents are. But averages rarely tell you the whole story.

    In any event, I do think that these two graphics start to speak to the economic spikiness that we are seeing across the US. 

  • The Green View Index

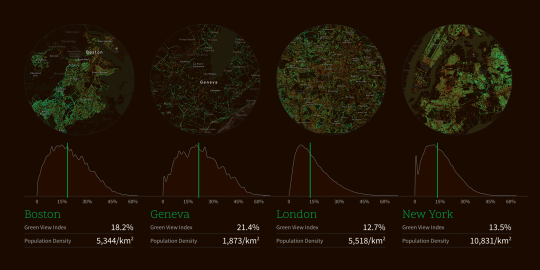
    The MIT Senseable City Lab recently developed something called the Green View Index. It is a measure of a city’s tree canopy. Below are the GVIs for Boston (18.2%), Geneva (21.4%), London (12.7%), and New York (13.5%). You may have to zoom in.

    image

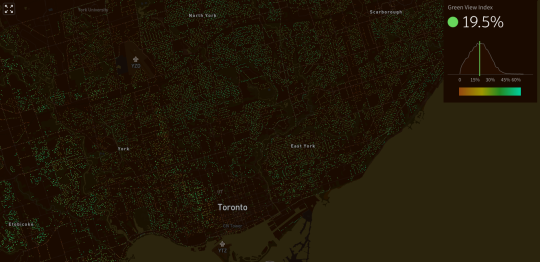
    And here is a screenshot of Toronto. We have a GVI of 19.5%.

    image

    The index was developed by methodically scanning for trees in Google Street View panoramas. The reason street view was used – as opposed to aerial photography – was so that they could capture the human experience at street level.

    All of MIT’s interactive city maps can be found here. It’s also interesting to pan around and see which neighborhoods are the greenest – particularly if you are familiar with the city.

    One thing I noticed is that large green spaces such as Central Park, High Park, and Stanley Park don’t show up as very green. And that’s because the index uses car-based street view data. I feel like these green spaces should count for something though.

  • Vancouver-Seattle

    The New York Times has an interesting article up talking about how Vancouver and Seattle are trying to more closely align themselves and create a unified tech corridor. 

    BC premier Christy Clark and Washington governor Jay Inslee recently signed an agreement to that effect, which included more research collaboration between the University of British Columbia and the University of Washington.

    Seattle wants this because its companies need talent (read: foreign workers) and Vancouver’s borders are more open. Vancouver wants this because its tech industry is relatively small (go Hootsuite!) and it could benefit greatly from being more proximal to Seattle.

    On a side note, Seattle is an interesting case study. In terms of venture capital dollars invested, it is below top tier cities such as San Francisco, New York, Boston, and so on. But in terms of the companies it has birthed (Microsoft, Amazon, Zillow, Expedia…) it is certainly a heavy hitter.

    One of the key factors will be physical connectivity. There’s talk of high speed rail and/or a dedicated lane for autonomous vehicles. However it’s done, I think bringing this trip to < 1 hour would be the ideal scenario. There’s a psychological barrier beyond that.

    If any of you live/work in either of these cities today, I would be curious to hear your thoughts.

  • The rise of tech outposts

    What happens when wages and real estate prices become too high in a city? Companies start growing in lower cost locations. We’ve all seen this before. 

    Fred Wilson recently blogged about this “spillover effect”, citing a New York Times article talking about the growth of tech offices in Phoenix. As someone who sits on the board of many technology companies, he was noticing a thematic trend:

    “A big theme of board meetings I’ve been in over the past year is the crazy high cost of talent in the big tech centers (SF, NYC, LA, Boston, Seattle) and the need to grow headcount in lower cost locations.”

    We talk a lot about housing prices on this blog, and so I think it’s useful to see how this, along with high wages, also impacts companies. The two are interrelated.

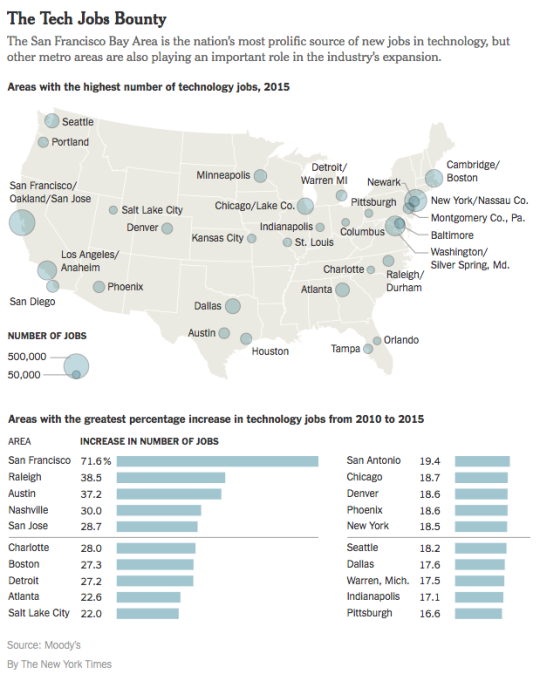
    Below is a chart from the NY Times article showing the US cities with the highest number of technology jobs and the most growth from 2010 to 2015. 

    San Francisco is in a league of its own. But overall, the growth is in tech and many cities are adding lots of technology jobs. Look at Detroit and Boston right beside each other (Detroit obviously has a smaller starting base). And look at how Miami is nowhere to be found.

    Of course, one interesting question is whether these new outposts – such as Phoenix – can truly come into their own and carve out a niche:

    “We don’t want to be San Francisco’s back office — we need more creators here,” said Scott Salkin, a founder and the chief executive of Allbound, which is based in Phoenix, makes sales software and has offices down the hall from Gainsight’s.

    Even with the high cost of living, it’s hard to supplant the coastal hegemony. That’s where people go to chase riches. As comedian Daniel Tosh likes to say, “the middle of the country is for people who gave up on their dreams.”

    Though for some, living in a place like Denver or Salt Lake City and snowboarding every weekend is a better outcome than living in a studio apartment and commuting an hour to work.

  • Should the Olympic Games be held in the same place every 4 years?

    I have argued before that hosting major events, such as the Olympics, can serve as a catalyst for completing meaningful public projects. But there is also an argument to be made that it’s not entirely worth it. The economic legacy is weak. The ROI simply isn’t there.

    Recently Harvard Business Review interviewed a gentleman named Chris Dempsey. Dempsey was a former Bain & Company consultant and the cofounder of the No Boston Olympics organization. He played a big part in Boston withdrawing their bid to host the 2024 Summer Games. Los Angeles ending up taking its place.

    His rationale is as follows.

    The International Olympic Committee was founded on June 23, 1894 by a Frenchman by the name of Pierre de Coubertin. At the time of its creation, the World’s Fair had already pioneered the rotational model of traveling to different cities.

    The most famous of these exhibitions was arguably “The Great Exhibition” held in London in 1851. Indeed, the plate-glass Crystal Palace structure which actually hosted the event was later seen as an important turning point in the history of architecture. It was designed by Joseph Paxton, who was an English gardener and architect.

    Of course, the world was a different place at the end of the 19th century.

    The events weren’t being broadcasted around the world in HD. We didn’t have social media. And transportation costs were high (economist Edward Glaeser reminds us of this in the talk I posted yesterday). So rather than ask people to spend weeks traveling the world by boat, it was decided that the show should travel to them. It should rotate places.

    This made sense then, but does it make sense now? I would love to hear your thoughts on this in the comment section below.

  • Hello Boston

    image

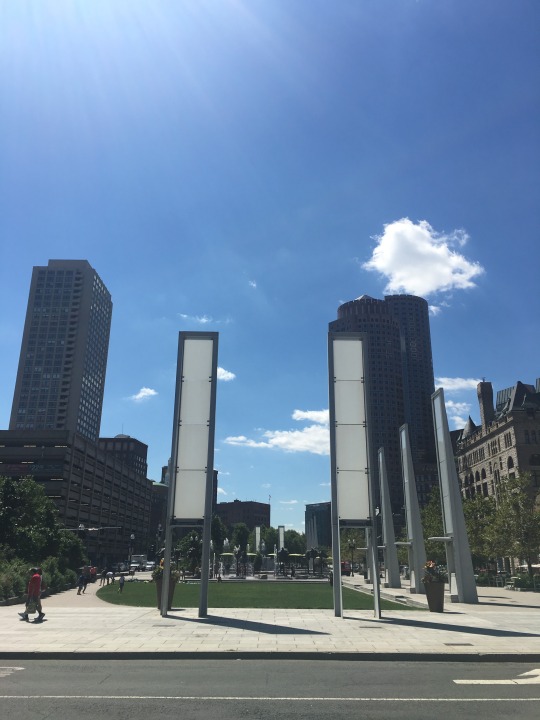
    I arrived in Boston early this morning. It has been about a decade since I was last here.

    I took the subway in from the airport, which is typically what I like to do when I visit a city. It’s such a great way to get a feel for a place. And in the case of Boston, Logan Airport is only a few stops away from downtown.

    image

    As soon as I got in, I walked over to see the Rose Fitzgerald Kennedy Greenway (above image). It’s a linear park that was made possible by burying the city’s elevated waterfront expressway – the infamous “Big Dig.”

    image

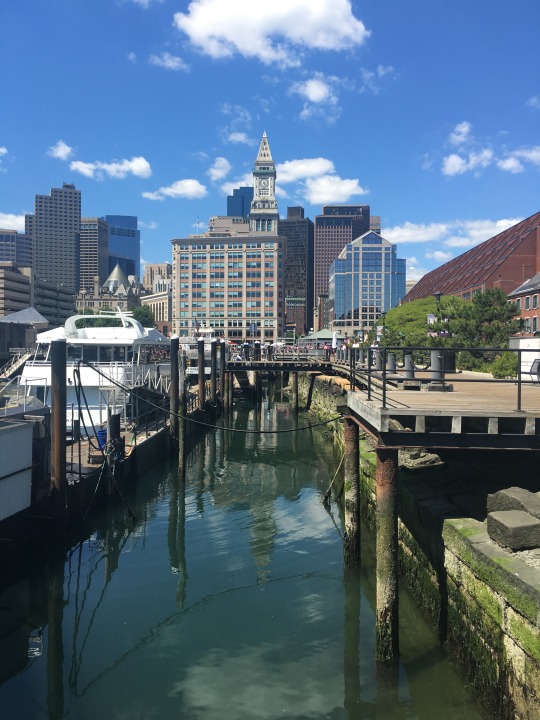
    I recognize that it was a lavishly expense infrastructure project that went many times over budget, but walking across the greenway to get to the water was rather pleasant. Will Toronto’s The Bentway achieve a similar result at a fraction of the cost?

    image

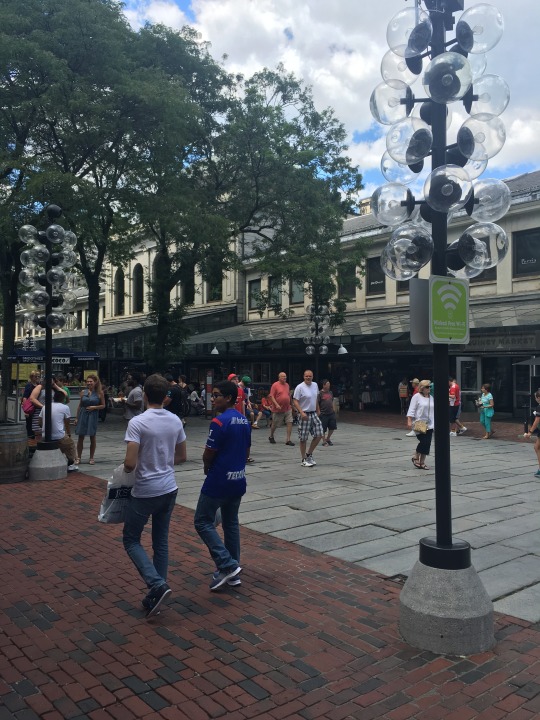
    With that out of the way, I went for a lobster roll. It had to happen. I then walked around Faneuil Hall and Quincy Market (above image). It felt a bit touristy, but what a remarkable pedestrian-only area

    image

    And now I’m on a boat heading over to Provincetown (Cape Cod) for a wedding. I’m writing this blog post over a spotty wifi connection, so out of fear that I may spontaneously lose it, I am going to end here. See you all tomorrow.

  • The top 20 US neighborhoods for venture capital investment

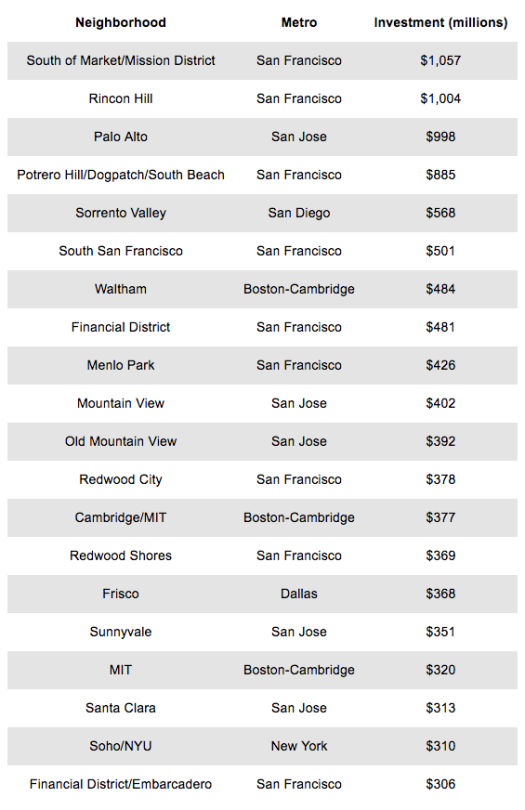
    There’s a lot of talk about how venture capital investment has shifted from the suburbs to cities and how it is also concentrated in certain metro areas. But a new report from the Martin Prosperity Institute has dug even deeper to look at the top 20 neighborhoods (zip codes) in the US for venture capital investment.

    Here’s a summary of what they found:

    “The top 20 neighborhoods or zip codes for venture investment include nine in San Francisco, five in San Jose, three in Boston-Cambridge (one in suburban Waltham and two in Cambridge close to MIT) and one each in San Diego (close to the University of California, San Diego), Dallas, and New York (close to New York University).”

    And here’s the full top 20 list:

    image

    Initially I looked at this list and thought that neighborhoods such as Menlo Park and Redwood City shouldn’t be labeled as San Francisco, since they are outside of the county. But technically they still fall within the San Francisco Metropolitan Area

    It’s amazing how San Francisco dominates this list.

  • Thoughts on inclusionary zoning

    Ontario is looking to pass legislation that would allow municipalities in the province to implement something known as inclusionary zoning. If passed and should municipalities decide to use this tool (Toronto almost certainly would), developers would then be required and/or incentivized to include some percentage of affordable housing in their new market rate developments. 

    Politically, inclusionary zoning tends to be popular. It’s believed to be a way for governments to create new affordable housing using relatively small public subsidies. Not surprisingly though, the development industry generally hates IZ. It’s another cost that needs to be added to the development pro forma – though some municipalities rightly offset these additional costs with additional density, breaks on levies, and so on.

    What I always think about when this topic comes up is the broader economic impact of the land use policy. Because I’m suspect that it’s as simple as: mandate affordable housing; get more affordable housing for free. Generally there are always trade-offs.

    So here’s some reading material for you all this morning.

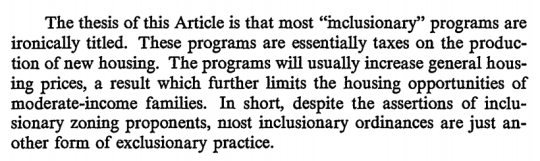
    In a classic paper (1981) by Yale Professor Robert C. Ellickson – called The Irony of Inclusionary Zoning – he argues that these practices can actually increase general house prices:
    image

    As a counterargument Owen Pickford over at The Urbanist argues that IZ simply reduces land prices as a result of the new tax. Land, after all, is the residual claimant. Therefore, he believes it’s an effective affordable housing policy. (I’m not so sure I believe that land prices would decrease in practice.)

    There’s also debate about the effectiveness of inclusionary zoning to actually deliver affordable housing at a meaningful scale. City Observatory wrote a post that looked at the total number of units produced (through IZ) across a number of American cities and the results were spotty. It should, however, be noted that not all inclusionary zoning policies are mandatory.

    Finally, the Furman Center for Real Estate & Urban Policy at New York University published a housing policy brief back in 2008 that looked at this exact topic. While they admit that the data is scarce, they come to the conclusion that IZ had no meaningful impact on the prices and production of single-family housing in San Francisco, but that IZ seems to have slightly decreased production and slightly increased pricing in the suburbs of Boston.

    What this last point suggests is that inclusionary zoning policies are not all created equal. So like all difficult questions, the answer to this one is likely: it depends. If anyone can point me to better data on inclusionary zoning, I would love to see it.

  • Top 20 cities for venture capital investment

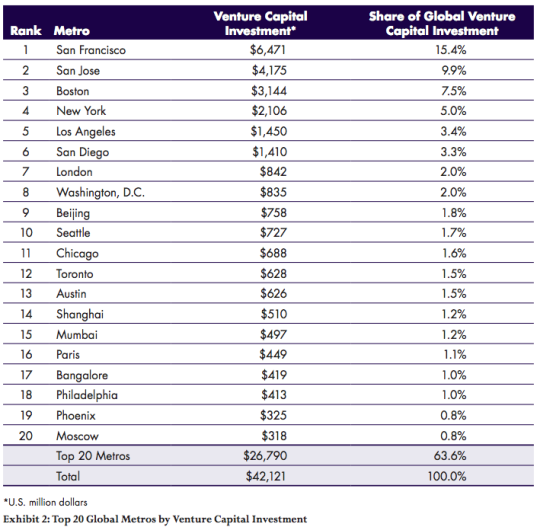
    The Martin Prosperity Institute here in Toronto recently published a new report that looks at worldwide venture capital investment by city. The report is called Rise of the Global Startup City.

    The data is from 2012, because that’s what was available from Thomson Reuters, so keep in mind that there might be some variation in the rankings if we were to look at more recent data. Some of the cities sit fairly close.

    Nonetheless, here are a few of the broader takeaways (from the report page):

    “The United States accounts for nearly 70 percent (68.6 percent) of total global venture capital, followed by Asia (14.4 percent) and Europe (13.5 percent).”

    “Just two broad regions — the San Francisco Bay Area and the Boston-New York-Washington Corridor — account for more than 40 percent of global venture investment.”

    “Global venture investment is highly uneven and spiky — it is concentrated in a small number of large cities and metros around the world.”

    Here are the top 20 cities by total venture capital investment (in USD millions):

    image

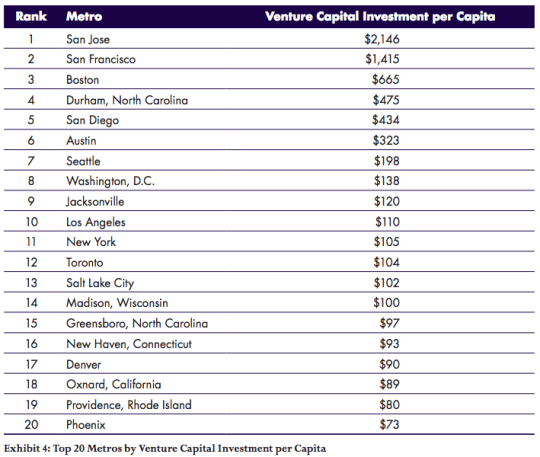
    And here are the top 20 cities according to venture capital investment per capita:

    image

    Given the variation in these two lists, you realize that some cities are largely benefitting from sheer size. London, for example, drops off the list when you look at venture capital investment per capita. 

    In fact, in this second list, 19 of the 20 cities are in the United States. The only non-American city that remains is Toronto.

  • The housing typologies of American cities

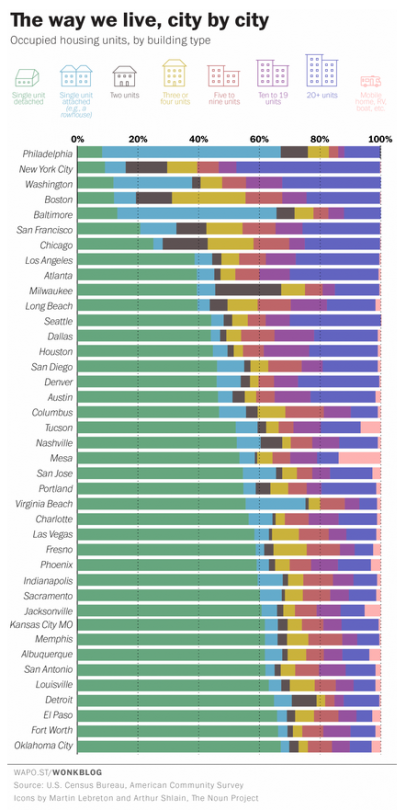
    Yesterday the Washington Post published a great chart showing the housing types of the 40 largest cities, by population, in the US. The list is ordered from lowest to highest according to the percentage of single-family houses in the city (green bar).

    Here’s the chart:

    image

    Not surprisingly, many of the cities at the top of this list (meaning they have the lowest percentage of single-family houses) are in the older east coast cities. 

    It’s also interesting to see just how much the rowhouse dominates the urban landscape in Philadelphia and Baltimore. In Philadelphia, almost 60% of the housing stock is an attached rowhouse.

    Housing is the backdrop for such a big portion of our lives. And when you live in a particular kind of home, it impacts your life whether or not you realize it. The dense rowhouses of Philadelphia and the single-family houses of Oklahoma City are the result of two very different kinds of urban landscapes.

    In Toronto, that backdrop is in the midst of a dramatic change. More and more of us are now living in high-rise condos. That hasn’t always been the case, of course. It’s a recent shift. But it looks like it’ll be a big part of our future.