Daily insights for city builders, delivered every morning at 6 AM ET. I’m Brandon Donnelly — a Toronto-based real estate developer and founder of Globizen. I’ve been writing here since 2013.

  • We all walk too fast

    January 28, 2025 · View original


    Past research has shown that as cities get larger, people tend to walk faster. The probable explanation for this is that as cities get bigger, they also tend to get wealthier, and so the opportunity cost of not walking fast increases. In other words, people’s time is worth more.

    Of course, there’s something naturally unsettling about this. But it appears to be demonstrably true. Here’s another, more recent, study that compares pedestrian behavior in 1979-1980 to 2008-2010 for four urban public spaces in New York, Boston, and Philadelphia.

    What the researchers did was use William Whyte’s famous observational work from 1980 and then use computer vision to compare it to 2008-2010. And what they found was that, on average, walking speeds had increased by about 15% and that time spent lingering in these public spaces had basically halved across all locations.

    These are pretty dramatic changes that speak to a different, or at least, evolving, urban life. Increasingly, we’re all just atoms racing around and trying to get to our next engagement.

    Now, part of this can likely be attributed to the greater opportunity cost thing. But another possible explanation might be the advent of the internet and smartphones. Could this be a symptom of our social lives moving away from our streets and being replaced by online platforms?
  • 14th annual

    January 27, 2025 · View original


    It’s almost that time of year again.

    Later this week, marks the start of our 14th annual ski and snowboard trip. Our group missed two years because of the pandemic and so, technically, this should be the 16th annual, but who’s counting? This is a trip that happens every year like clockwork and, this year, we’re checking off a big mountain destination that has been on many/most of our bucket lists: Hokkaido, Japan. If you read my recent post called “The Secrets of the greatest snow on earth,” you might remember that Hokkaido is one of the snowiest places on the planet. Every January, there is a 90% probability that the island will get at least 100 inches of snow!

    Before Hokkaido, we’re also going to be spending a handful of days in Tokyo. The first and only time I’ve been to Japan was back in undergrad, over 20 years ago. I’m really excited to see how the city has evolved, and to see it with fresh eyes. I was in the early days of studying architecture back then, and just starting to understand my obsession with cities. So I’m sure that I’ll have a much different appreciation this time around. Neat B is also coming to experience Japan’s legendary powder and she’s never been to Asia before. So I’m equally excited to see Japan anew through her eyes.

    This past weekend we started making our travel list. Generally, our approach is to list the things we absolutely want to see and do, including noteworthy architecture, and then let the rest happen organically. Often some of the best travel experiences are the ones you didn’t plan. I also have a friend from graduate school that now runs his own practice in Tokyo: Kenta Fukunishi Architecture Office. Our group is going to lean on him to show us what’s hot in contemporary Japanese architecture. My buddies and I haven’t seen him since 2009.

    I’m also hoping that some of you will have recommendations for Tokyo and/or Hokkaido, which is why I’m blogging about this trip a little early. Tokyo is obviously massive. It’s the largest metro area in the world. And so more than most places, it demands curation. We’re not even going to make a dent over the course of a few days there. If any of you have any suggestions, please leave them in the comment section below or shoot me an email at brandon dot donnelly at globizen dot com.

    In terms of what you can expect here on the blog, expect photos and expect to see me measuring the width of impossibly narrow streets. I’ll also be sharing a lot of content to our Globizen Instagram account, so make sure you follow us there. As always, this blog will get updated every morning — though I’m sure I’ll screw up the time zones on the way there and not know what day it is. And as always, I’ll have my Fujifjilm camera on me. It’s also my goal on this trip to capture more videos. It’s something I love to do, but never have seem to make time for. Let’s change that.

    Here’s to the 14th annual!

    Cover photo by Steven Su on Unsplash

  • Beautiful federal civic architecture

    January 26, 2025 · View original


    One of the many things that Trump has already signed since reentering office is a memo directing the General Services Administration to come back to him within 60 days with recommendations on how to make Federal public buildings in the US look a certain way. More specifically, the memo states that, “Federal public buildings should be visually identifiable as civic buildings and respect regional, traditional, and classical architectural heritage in order to uplift and beautify public spaces and ennoble the United States and our system of self-government.” This is something he initiated during his first time in office, with a draft order called “Making Federal Buildings Beautiful Again,” and so let’s break this down — specifically some of the words chosen for this memo.

    Firstly, what exactly is classical architecture? Generally speaking, it is architecture that is based on and derived from the design principles of classical Greek and Roman architecture. Think the European classical period between the 8th century BC and the 5th century AD. And it is true that much of the early Federal architecture following the American Revolution did follow these principles. That’s because, at the time, the US didn’t have its own architectural language to represent the values being espoused by its founding generation. So what they did was say, “hey, we want to somehow represent democratic and republican values, so let’s just borrow from previous and existing design precedents.” Here, one could argue that Europe innovated and the US copied.

    So what this memo is saying is that the US should go back to this Federal-style of architecture. This is clear. But at the same time, the word regional is used. This implies that the classical architecture to be built in DC can and should be different than the classical architecture to be built in Los Angeles. Does this mean that local Federal architecture will be free to respond to local climates and with local materials so long as the end result is something that still speaks to Greek and Roman values? For example, could a Federal building in California have deep overhangs that block out the sun during the day and allow for passive cooling/ventilation in the evenings? I’m not sure.

    Then there’s the language about self-government. This is what the US is built on — individual freedoms and liberties. And so I find it incredibly ironic that, here, we have memo saying that all Federal buildings should be designed and built using basically a singular approach to architecture in order to lend dignity to the values of individual freedoms. In other words, “we want every building to look the same or similar so that it shows how much autonomy we allow and how little intervention there is from external authorities.” Wait, shouldn’t it be the exact opposite? Rather than ennoble the United States, it feels anti-American. Let local communities and architects decide what is regional and what is appropriate, and get out of the way.

  • Urban street networks compared

    January 25, 2025 · View original


    One of the interesting things about street networks is that — once laid out — they rarely change in a substantial way. Not unless Haussmann comes along and decides to renovate. That can be a good thing if you get it right like in the case of Philadelphia or Barcelona. But it can also be a bad thing if you’re maybe wishing the founders went with design option B.

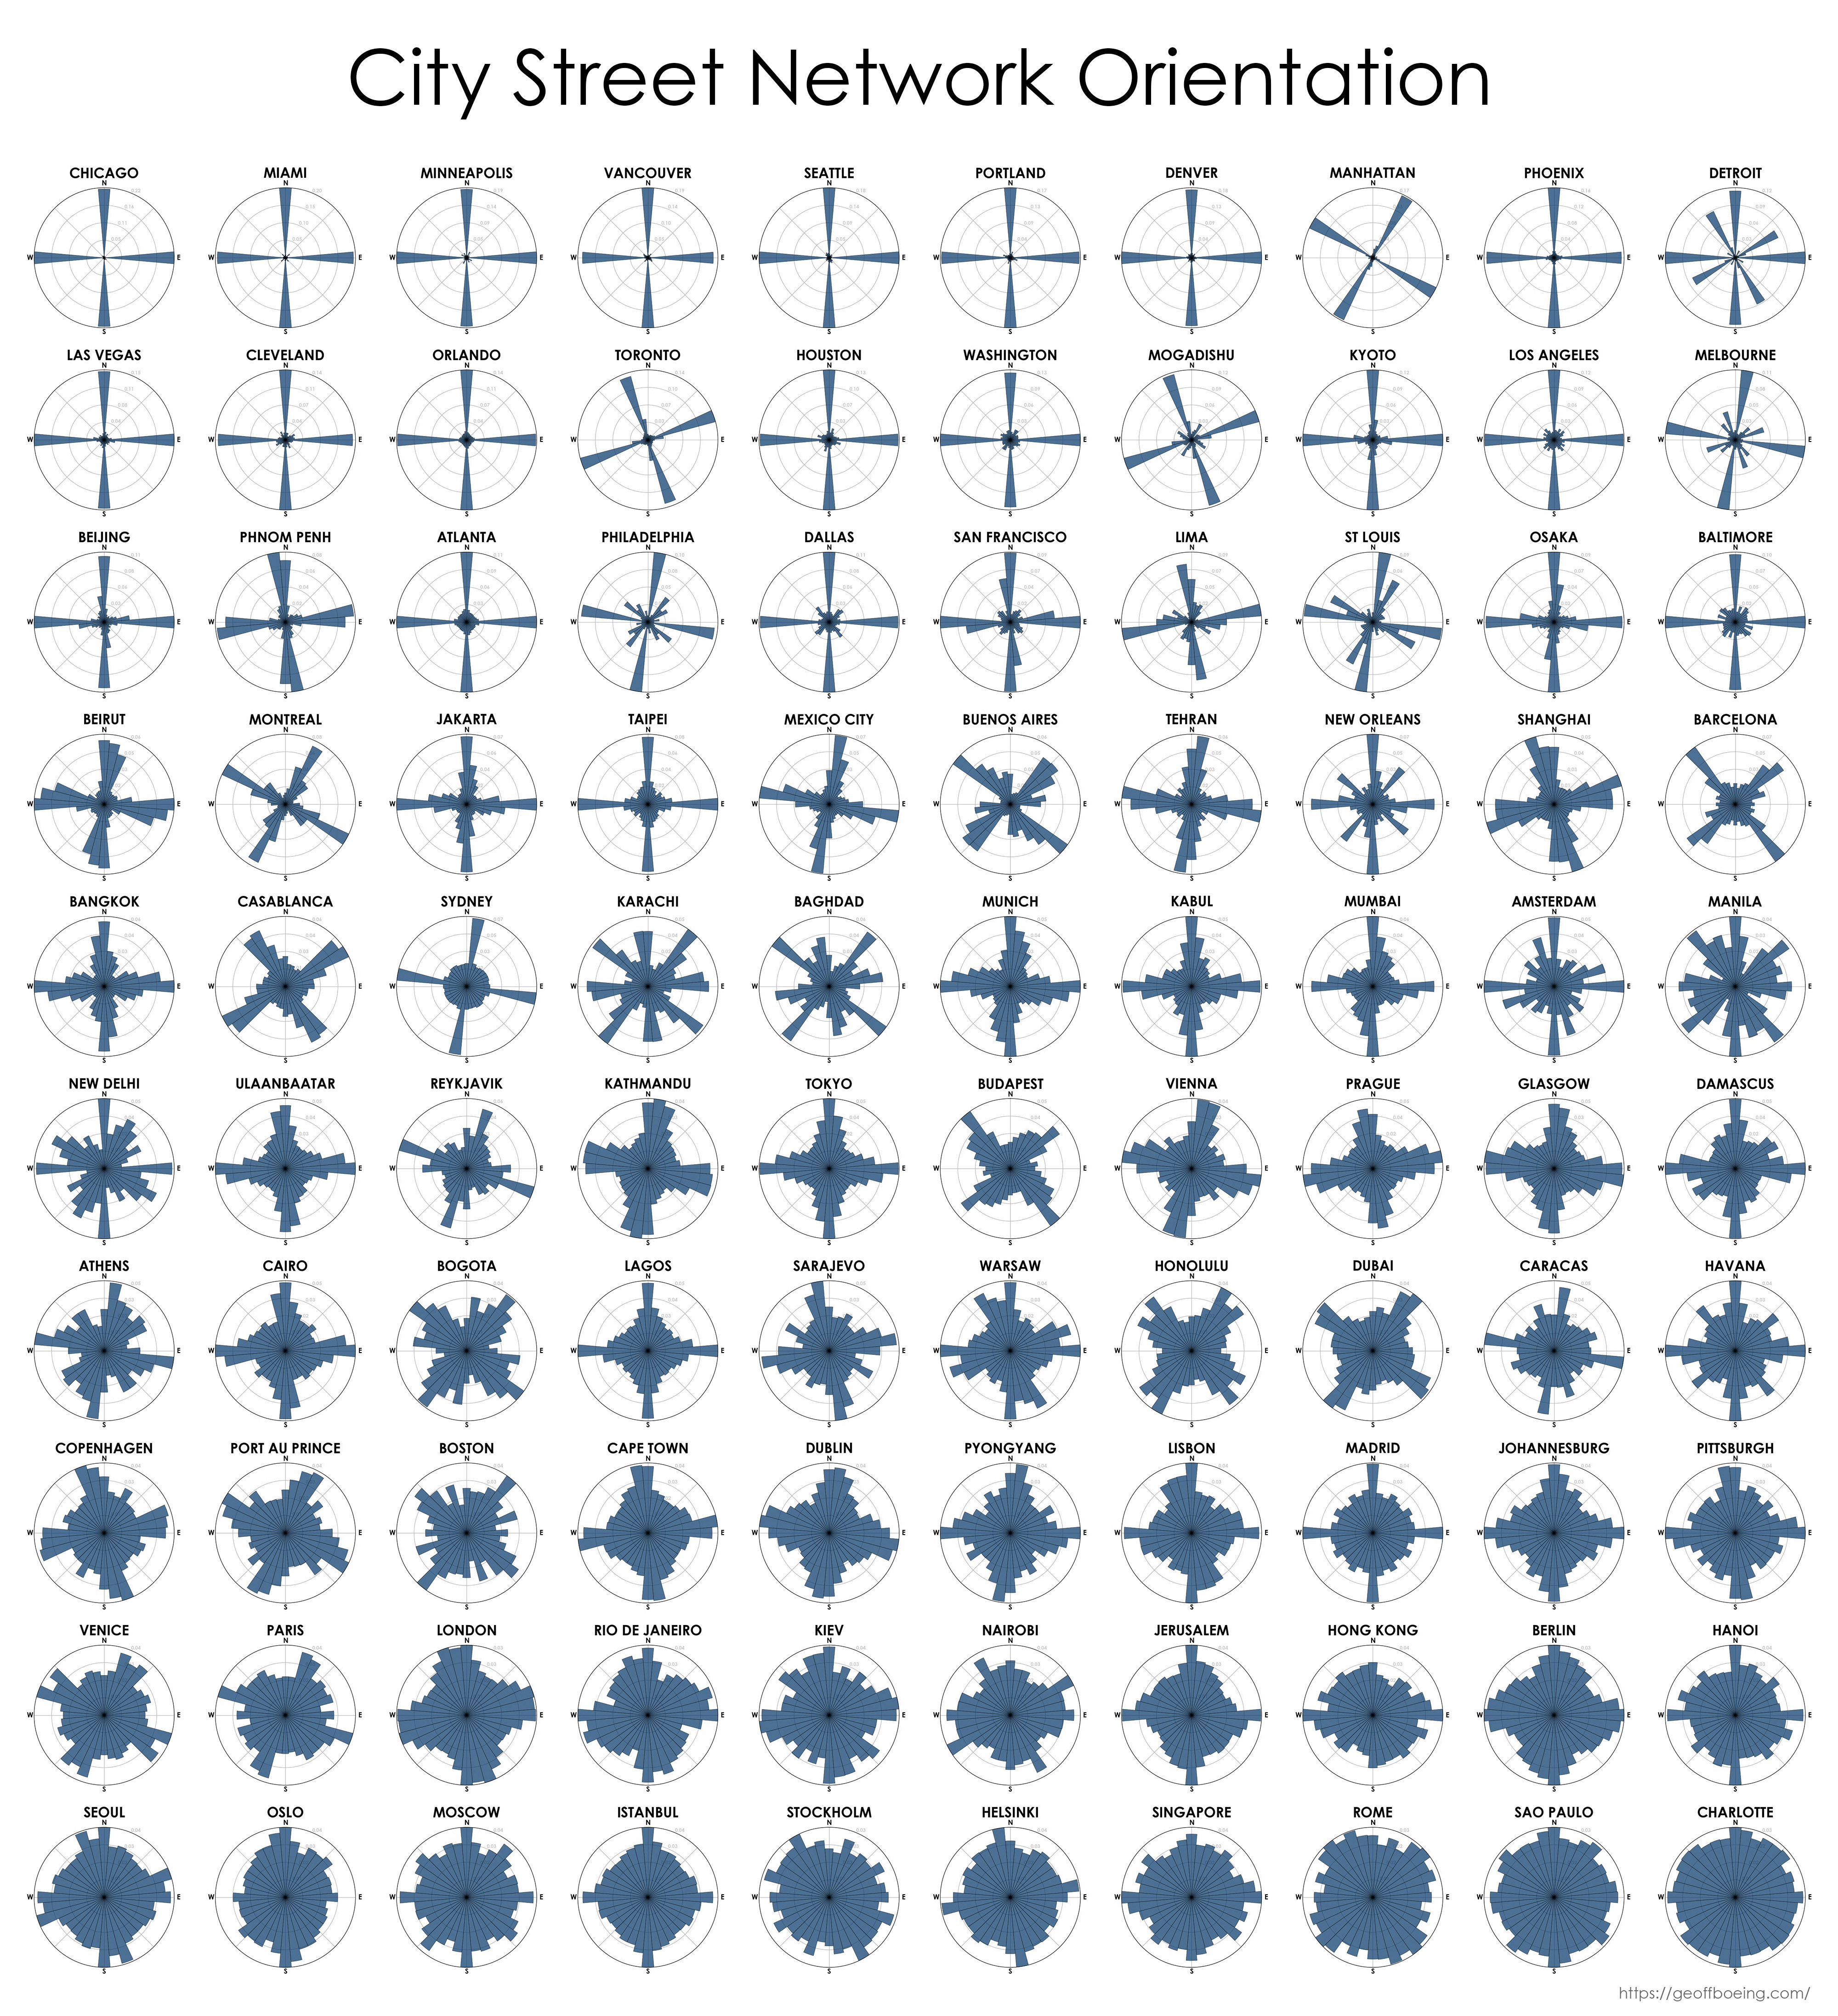
    On that note, here’s an interesting set of polar histograms from Geoff Boeing, who is a professor of urban planning and spatial analysis at the University of Southern California, that sorts city street networks by most-ordered/gridded to most-disordered:

    What these diagrams don’t tell you is how walkable or dense a city might be. But they do tell you how many of its streets follow a strict orthogonal grid — see Chicago and Beijing — and how many of its streets are all over the place, like in the case of Rome and Charlotte.

    They also tell you when the grid is askew, like in the case of Toronto (because of the angle of our shoreline) and in the case of Manhattan (because of the angle of the whole island). And if you were to revisit these diagrams well into the future, I suspect you wouldn’t see much difference from what you see here.

  • Energy and progress

    January 24, 2025 · View original


    YouTube video

    Here’s an interesting presentation by Albert Wenger, who is a partner at Union Square Ventures. He starts by showing a logarithmic chart comparing per capita energy consumption and GDP per capita. Then, by way of a clear empty area in the chart’s data points, he makes the argument that there’s no such thing as a wealthy, low-energy nation. If you’re a wealthy country, you consume a lot of energy. That’s just how it works. He then goes through a number of historical energy breakthroughs, landing on the point that, today, we are in need of much more energy. In other words, we need another energy breakthrough. We need it because we’re still burning fossil fuels and putting too much carbon into the atmosphere, and because we have really big energy needs: everything from data centers to the full electrification of our homes, buildings, and cars. One piece of good news is that we are seeing exponential growth in solar energy. Today, our global install base is still relatively small, but the thing about exponential growth is that it can creep up on you fast.

    It’s an interesting presentation. And if you’d prefer to read his talk instead, which is/was my preference, you can do that here.

  • Away from home

    January 23, 2025 · View original


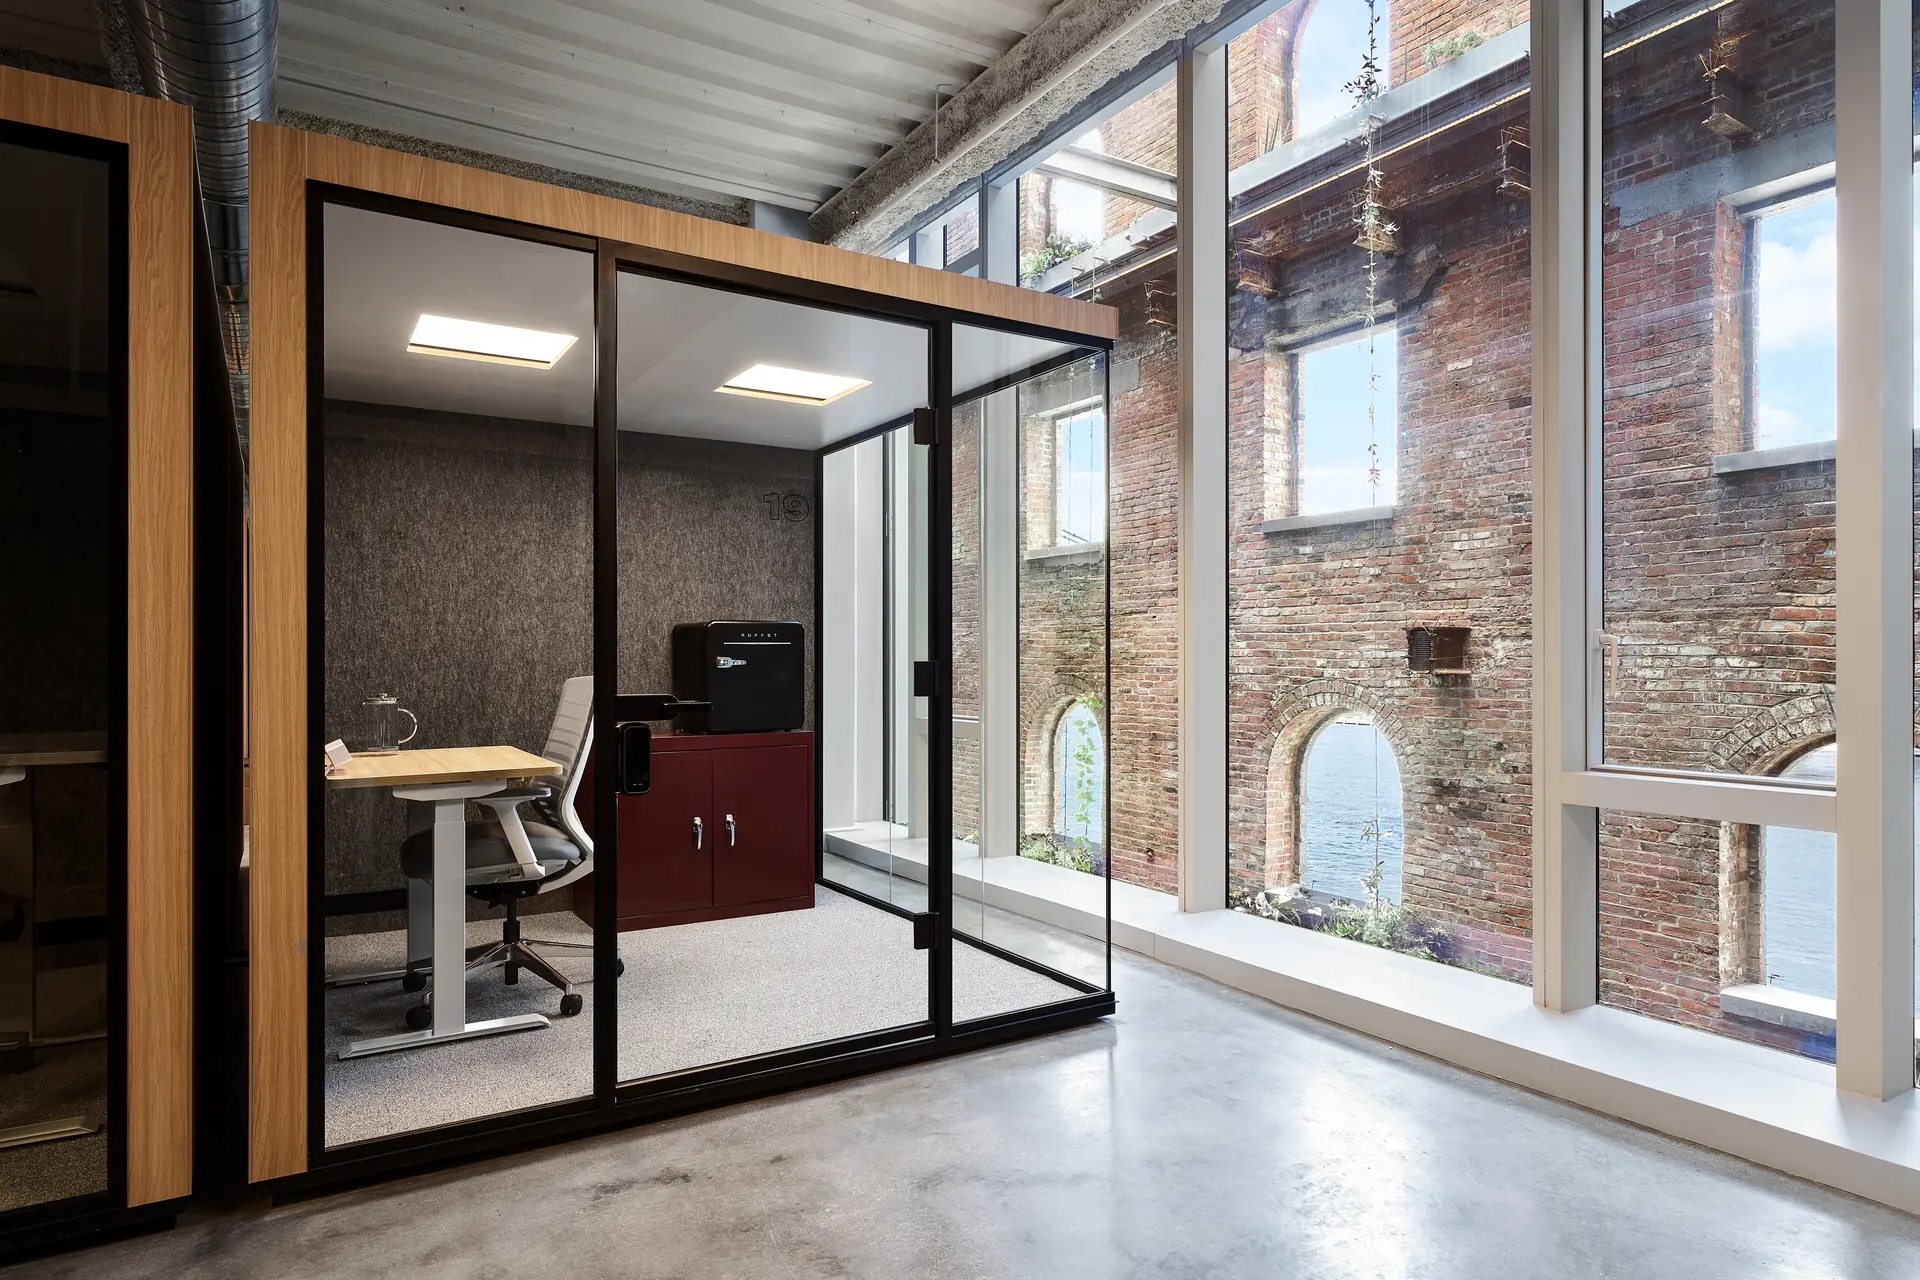
    I just read about a popular co-working company in New York called Framework. The concept is super simple. They rent single-person office pods (see above). Each one is sound insulated and has a sitting/standing desk, a filing cabinet, a kettle, a french press, and a small fridge. And at their latest location in Williamsburg, these rent for $820 per month. Their tagline is “your home office away from home” and I think that’s a good way of describing the offering. Because let’s consider the math.

    These pods are 8 feet x 8 feet. So at $820 per month, one would be effectively paying about $12.81 per square foot in rent, which I would assume is significantly higher than average apartment rents in the city. If you take the present value of $820 per month over 25 years at a rate of 5% (to generally simulate mortgage payments), you get close to $140k in value. My point being that if you can afford an additional $820 per month for an office pod, then you could likely afford to rent or buy a home with an additional 64 square feet.

    But from what I can tell, that’s not necessarily the main problem that Framework is solving. The key words seem to be: “away from home.” Home can be distracting for some people and in some situations. If you’re trying to get serious work done, I can see why shuttering yourself in a pod would be an attractive solution.

    Photo via Framework

  • Sundance

    January 22, 2025 · View original


    Tomorrow is opening day for the 2025 Sundance Film Festival in Park City and Salt Lake City. This year it takes place from January 23 to February 2. For those of you who maybe aren’t familiar, Sundance is the largest independent film festival in the US. In 2023, it had 423,234 combined in-person and online viewers, and, last year, it saw 72,840 in-person attendees (in a city with just over 8,000 people). So even though there’s an online component, it’s still very much an IRL experience.

    If any of you have been before, you’ll know that it’s an awesome time to be in Park City. I have vivid memories of singing Phil Collins in a karaoke Uber. The bars and restaurants are also packed and the sidewalks are overflowing with people. So much so that, this year, Main Street is going to be converted to pedestrian only, which I understand is a first. The urbanist in me was obviously happy to hear this, and I now look forward to seeing it play out on the socials.

    If any of you are interested in attending, Parkview Mountain House still has some dates available during the festival. Here’s the link.

    Cover photo by Kirby Taylor on Unsplash

  • Young people are less interested in owning a car

    January 21, 2025 · View original


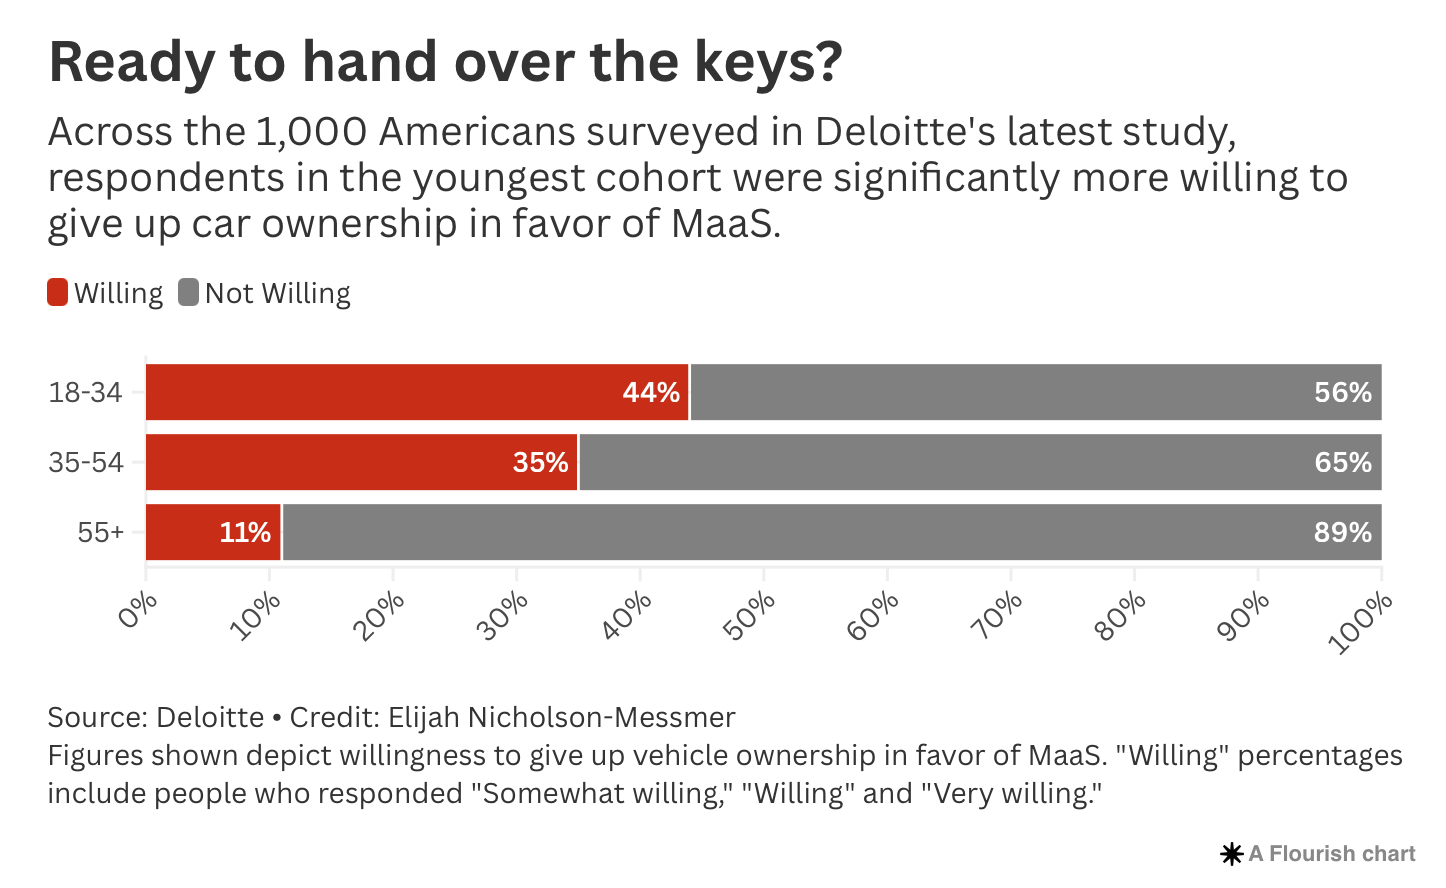
    Deloitte recently asked 1,000 Americans if they would be willing to give up car ownership in favor of something that they are calling “Mobility-as-a-Service.” This umbrella moniker is meant to capture everything from public transit and bike shares to Ubers and car rentals.

    Here are the results:

    What’s interesting is how willing young people seem to be to forgo car ownership. (Note: Willing, here, includes people who answered somewhat willing, willing, and very willing.)

    It’s also doesn’t seem to be dependent on geography. Broadly speaking, urbanites are more likely to say that they would be willing to give up owning a car. In this survey, 50% of people in urban areas said that they would be at least somewhat willing, whereas the number drops to 17% for people in rural and suburban areas. But oddly enough, young people in rural and suburban areas are just as willing, if not more willing than their urban counterparts. I wonder why.

    This maybe suggests that we are seeing a generational shift in how younger people view car ownership. That, or they haven’t started having enough kids yet and their perspective will change as they get older. If I had to guess, I’d say it’s a mix of both, but more of the former. Because look at the large spread between the next two cohorts in the above chart. There are some trends here (assuming this data is representative). It’s not just about family life.

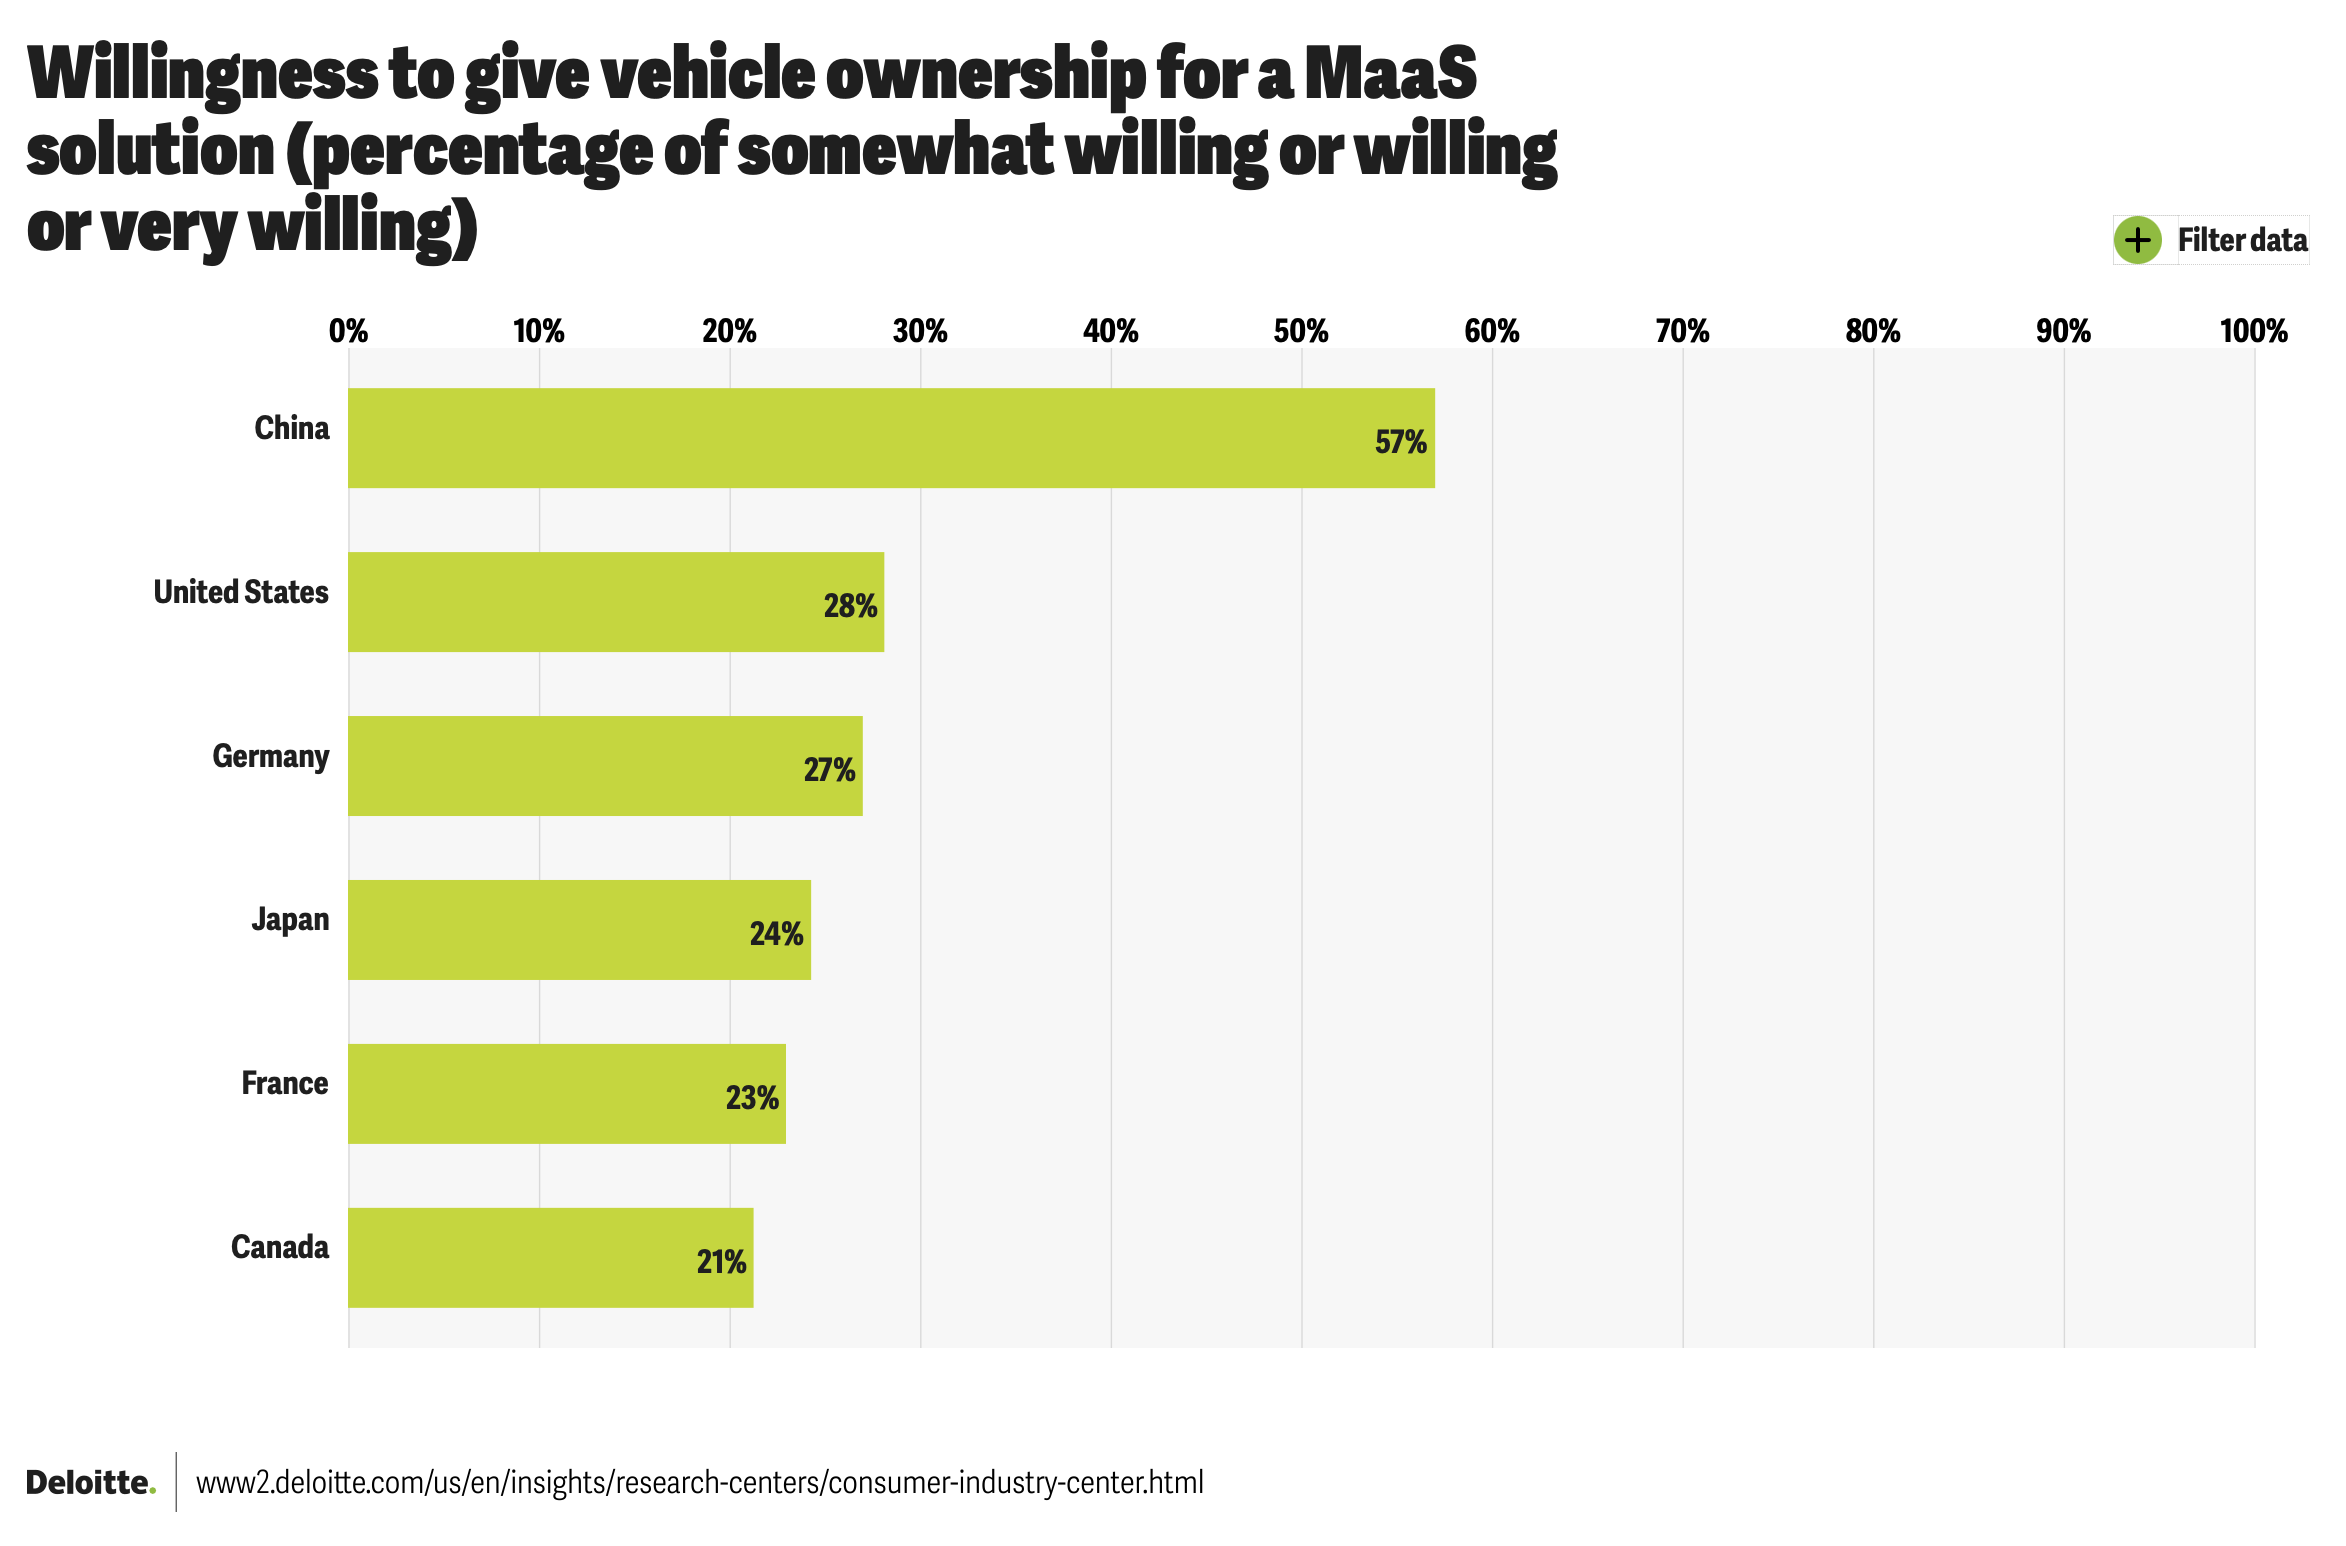
    Also noteworthy is the fact that Canadians are some of the most unwilling people, according to this survey:

    Personally, I hate driving. I look forward to the day when most cars drive themselves. So I’d place myself in the very willing camp. What about you?

  • Demographic trends in Greater Paris

    January 20, 2025 · View original


    The work of l’Atelier parisien d’urbanisme (or Apur) is right in my wheelhouse. Run by an architect, they are a group that analyzes, documents, and then develops strategies for urban matters impacting Paris and Greater Paris (la Métropole du Grand Paris). For example, last year they published a book called Paris Atlas, which contains 150 original maps and lots of statistics about the city. And this month, they published a note talking about population and demographic trends in the city. Here’s a brief summary of this latest report.

    As of January 1, 2022, there were 7,115,576 people in Greater Paris:

    Between 2016 and 2022, its population grew by about 0.2% per year or about 14,800 people per year. This is slower than the previous reporting period (2011 to 2015). It’s also all because of natural births:

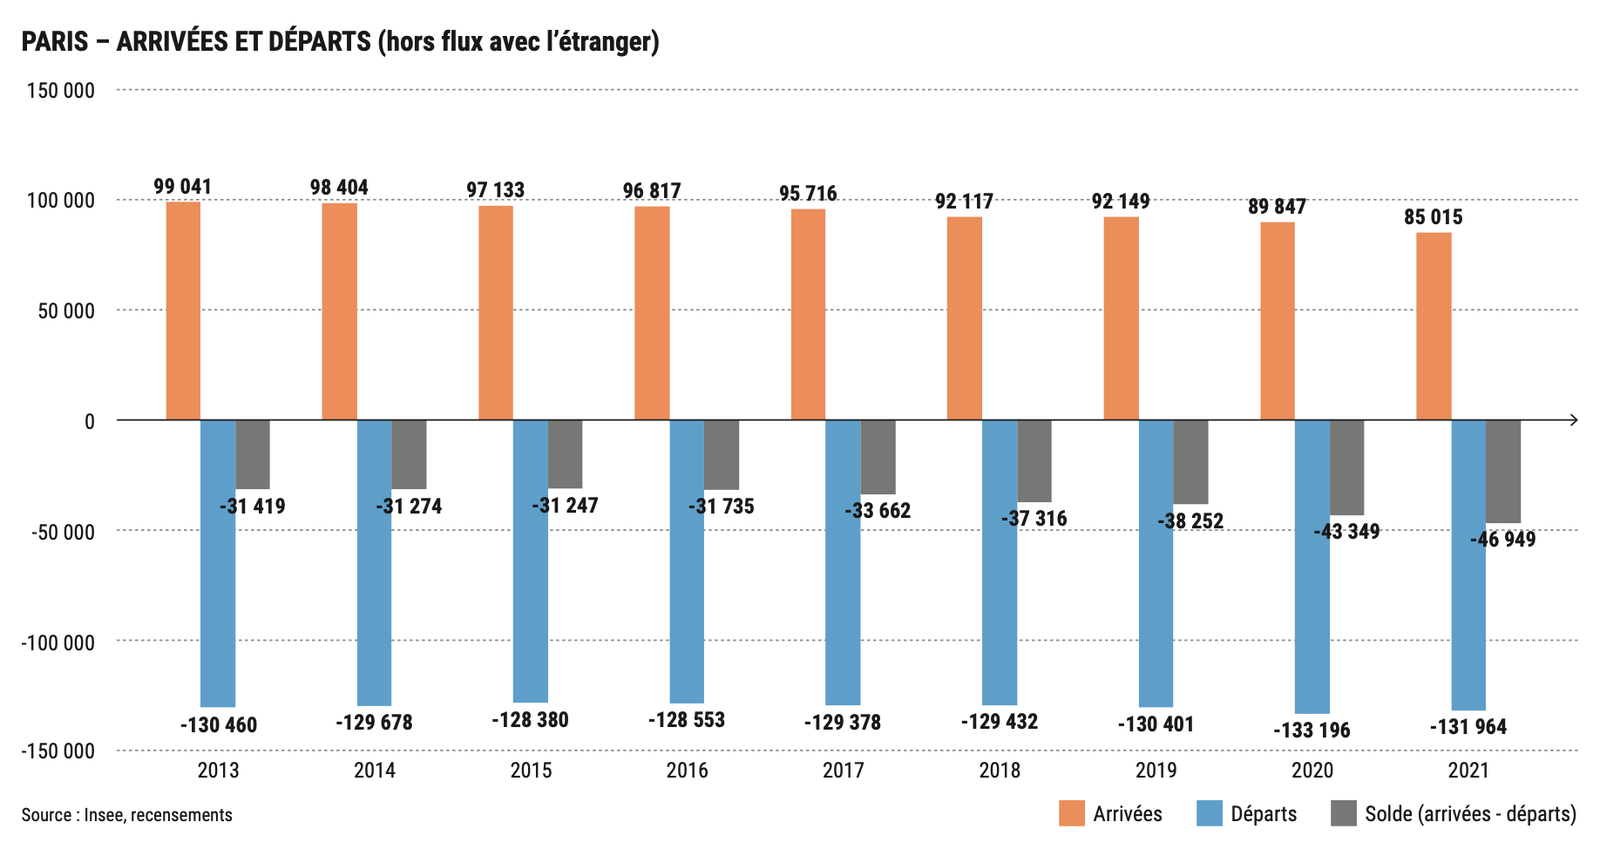
    When it comes to migration, more people leave the city each year than come to it:

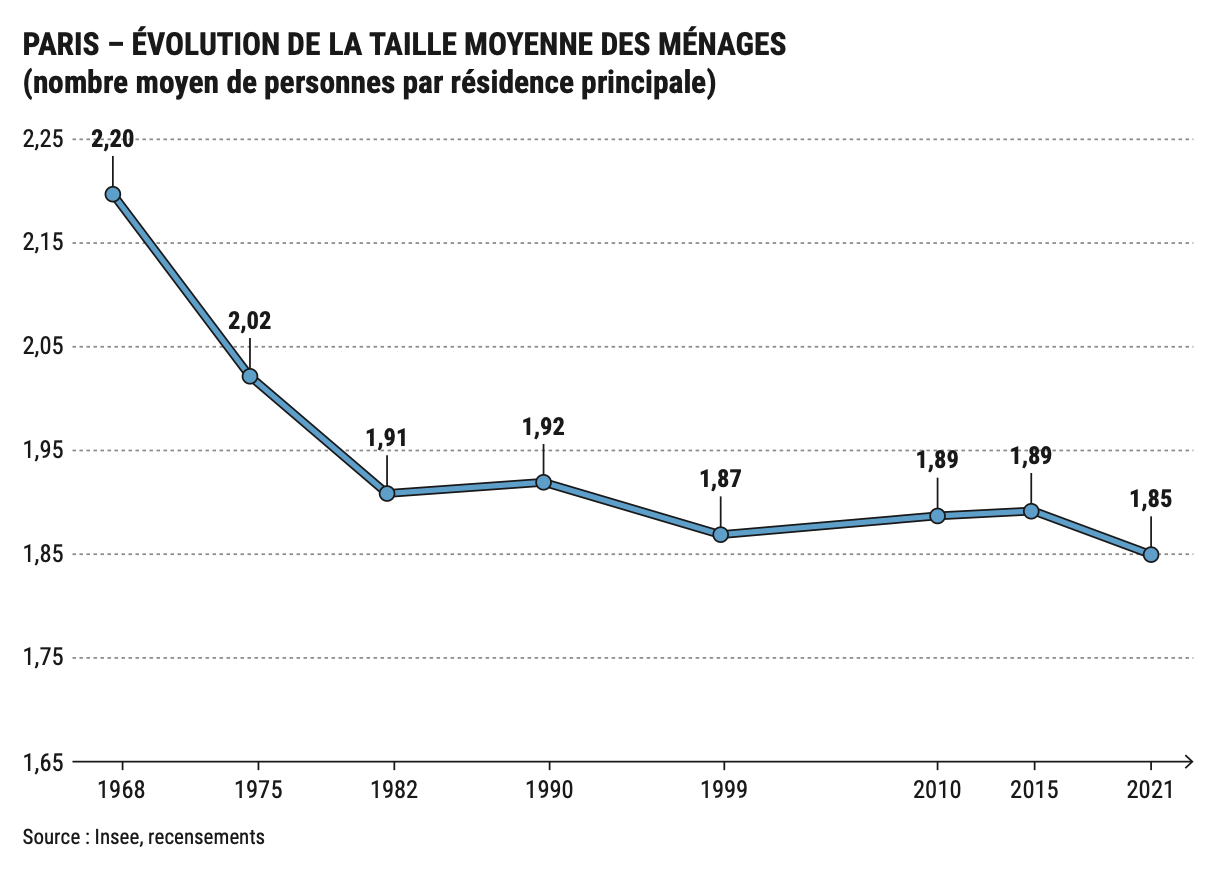
    This runs in contrast to a city region like Toronto, where the vast majority of our population growth comes from positive net migration. This is also true of Canada as a whole. Still, Paris is not immune to lower birthrates and a declining average household size:

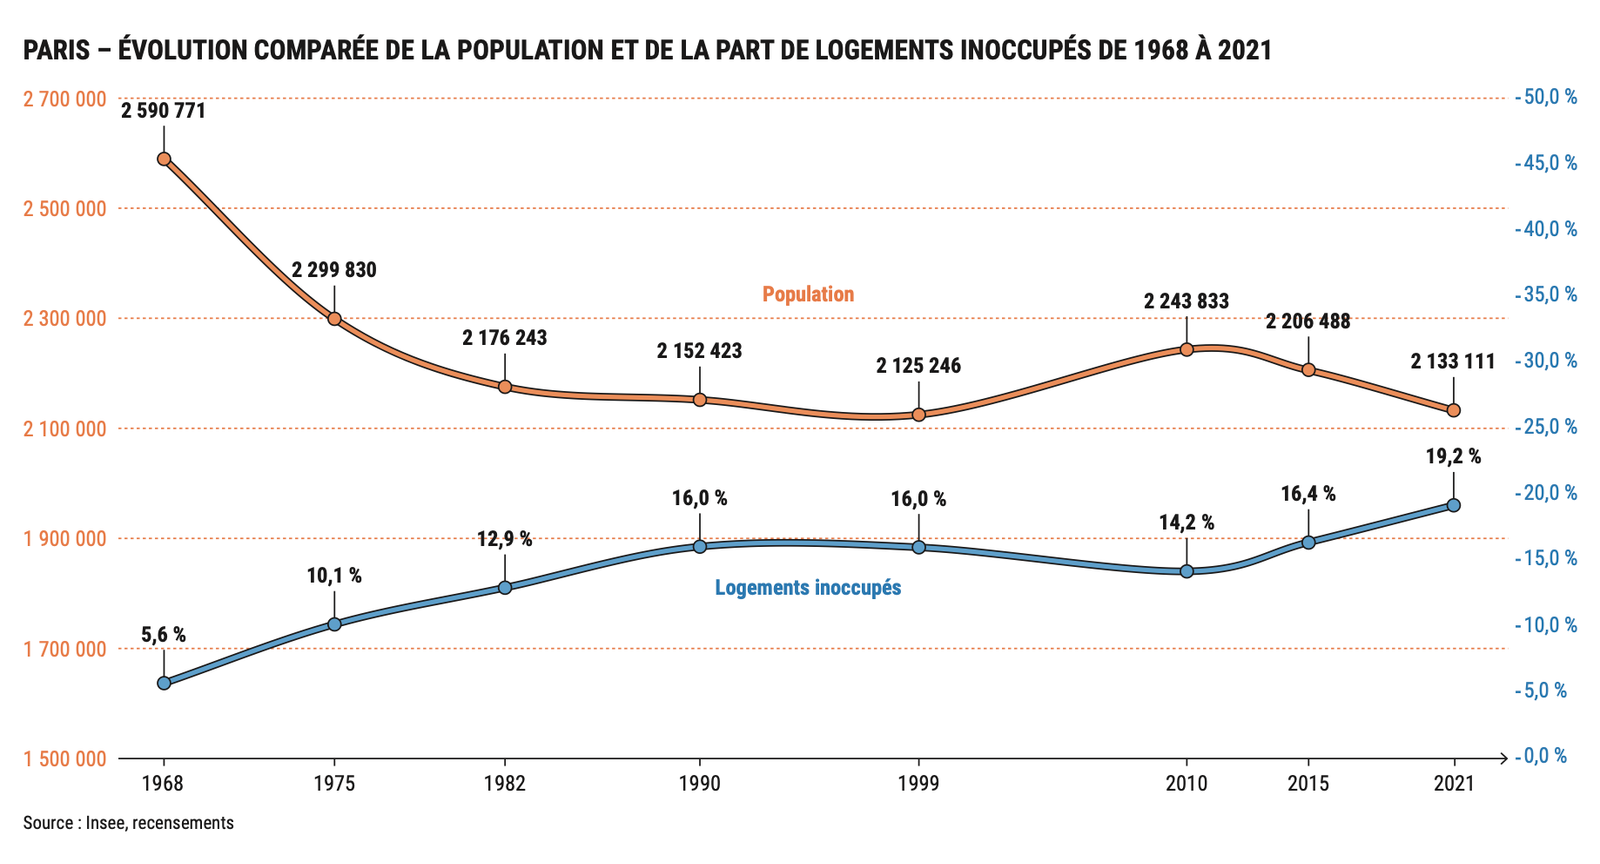
    Another factor impacting population, according to the report, is the decline in principal residences (homes occupied for more than 6 months of the year) and the rise of what the report calls “unoccupied homes”, which includes secondary homes and vacation rentals. As of 2021, the number of “unoccupied homes” was estimated at approximately 19.2%:

    However, in four arrondissements (1, 6, 7, and 8), the number of homes not used as a principal residence is thought to exceed 30%! This is making it even harder to build enough new homes. For example, between 2015 and 2021, Paris built approximately 30,300 new homes. (Reminder, the Greater Toronto and Hamilton Area completed about that many in one year last year.) But at the same time, the city counted 14,600 fewer principal residences. This is, I guess, what happens when you’re one of the most visited cities in the world.

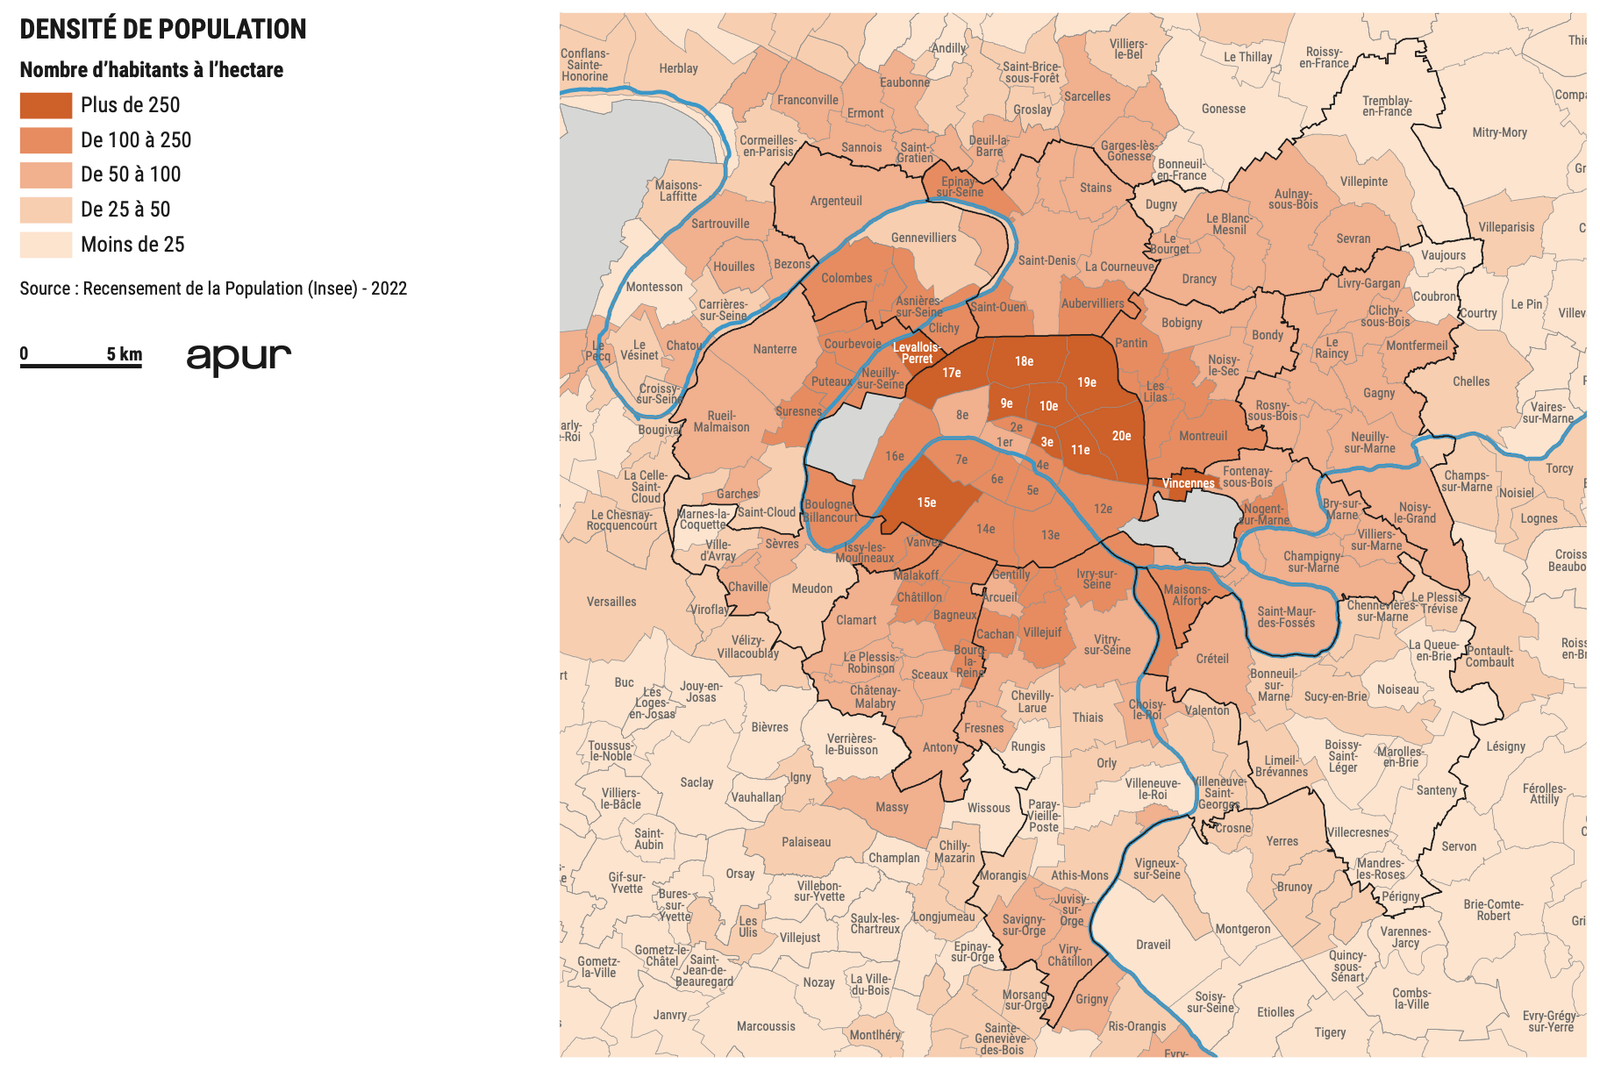
    To end, I’ll leave you all with this population density map:

    The darkest areas represent more than 250 people per hectare. That works out to more than 25,000 people per square kilometer (just divide the above numbers by 0.01). At the same time, between 2016 and 2022, the population of Paris proper (not Greater Paris) decreased by an average of 12,800 people per year. This is in comparison to an average decrease of 11,900 people per year for the period of 2011 to 2016. As is the case in many/most cities, Paris’ population growth is happening largely in the suburbs and in the outskirts.

    Cover photo by JOHN TOWNER on Unsplash

  • Low-rise vs high-rise municipal charges in Canadian cities

    January 19, 2025 · View original


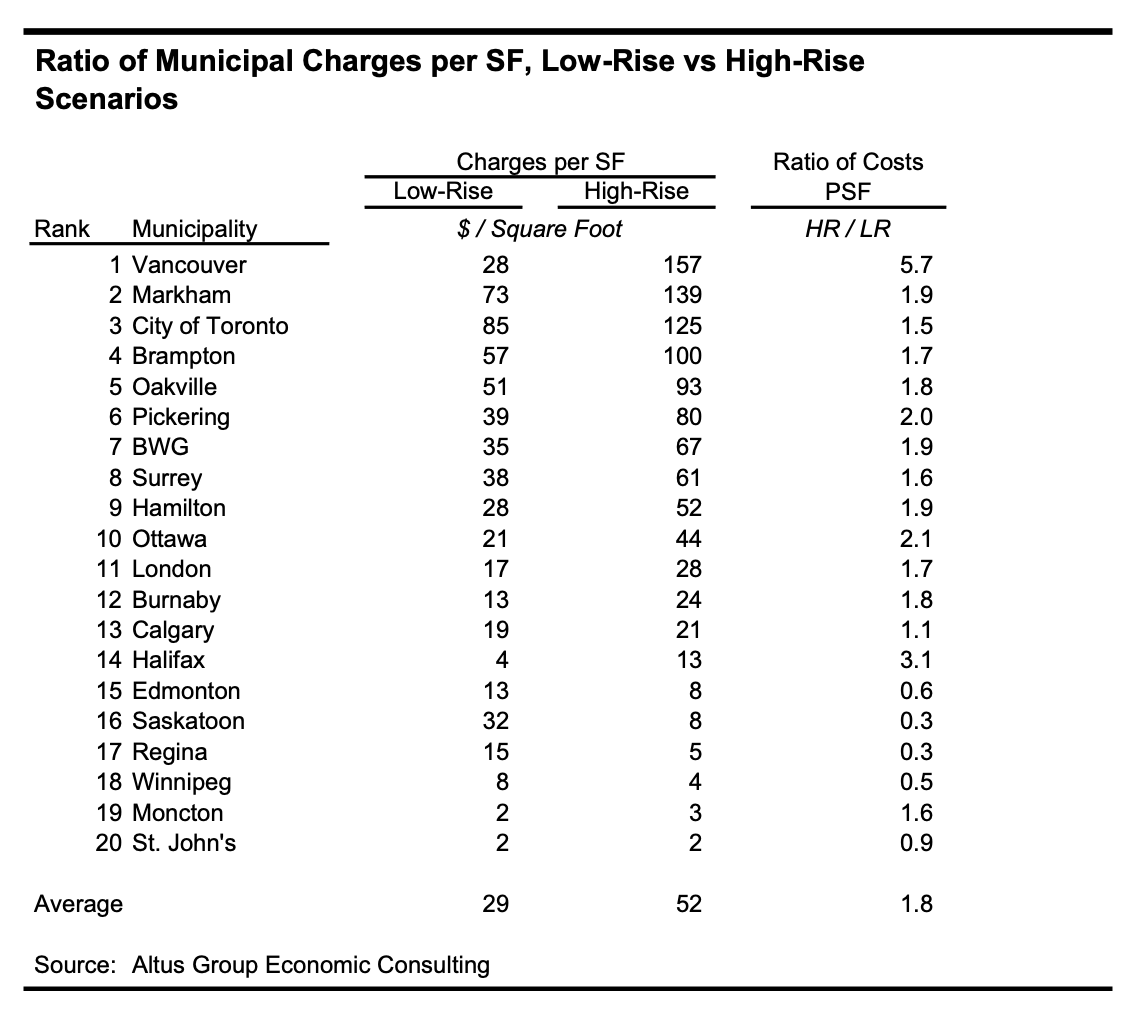
    Back in 2022, Altus Group did a municipal benchmarking study where they looked at approval timelines, development charges, and a host of other factors that could be impacting housing affordability in Canadian cities. I blogged about it then and spoke specifically about its benchmarking of approval timelines. But I revisited it this morning after seeing Mike Moffatt tweet about it and I came across the below chart.

    Also, approval timelines are less of a concern today. There are lots of zoned sites that are ready to go, but can’t because of the market. Instead, what the below charge does is compare municipal charges on a per square foot basis for low-rise and high-rise housing. What’s interesting is that in most cases, but in all cases in Ontario and BC, the charges are higher for high-rise housing.

    Example: If you bought an 800 sf condominium in Toronto and the fees were based on the numbers in this report, you’d be paying $125 psf x 800 sf = $100,000 in municipal charges alone. Once again, I am of the opinion that our industry should find a way to transparently itemize these charges so that people/purchasers can see where their money is going.

    Now, part of this has to do with higher land values for higher-density housing and municipal fees that are calculated based on appraised land value. But it’s also driven by suite sizes becoming smaller (to make the end price more affordable for buyers and renters).

    Here in Toronto, it doesn’t matter if you’re building an 800 sf two-bedroom or an 8,000 sf two-bedroom apartment, the development charge fee would be the same. And so it is perhaps not surprising that as suite sizes have come down and charges have gone up, so too did the costs on a per square foot basis.

    But it raises an important and obvious question: Is this what we want? I mean, aren’t we trying to encourage more infill housing in places where people don’t need to drive and we can leverage existing services? Yes, that’s what we are saying. Unfortunately, our charges suggest the opposite.

    If you’d like to download a copy of the report, you can do that over here. Please keep in mind that this is data from 2022 and there have been changes since then. In many cases the fees are now higher, but in some cases, like in the City of Vaughan, the fees are now lower.

    Cover photo by Scott Webb on Unsplash