Daily insights for city builders, delivered every morning at 6 AM ET. I’m Brandon Donnelly — a Toronto-based real estate developer and founder of Globizen. I’ve been writing here since 2013.

Category: Uncategorized

  • How to fall in love with Toronto

    May 17, 2026 · View original


    This weekend I went on a long bike ride across the city with my friend Ev (who, by the way, just recently got married. Congratulations again to you both!). This was not a ride to pump my feeble Strava stats, but a ride to see and explore our wonderful city. And once again I was reminded that one of the easiest ways to fall in love with Toronto is to get on a bike and ride across it. Biking offers the best of both worlds: it’s both fast and efficient, and it’s granular. You can easily slow-ride through smaller spaces or quickly get off and walk them.

    If I’m ever in the mood to elicit a shitstorm of negative reactions, all I have to do is go on Twitter and tweet something pithy about how much I love Toronto. I don’t know why so many people seem to react like this, but I genuinely feel this way about our city. City-building is a slow process, but a spring ride after a cold winter will reveal to you all of the projects we’ve been working on quietly in the background: new streets, new mid-block connections, new public spaces, new businesses, and beautiful architecture.

    Of course, not all of it is exceptional. At one point, Ev and I came across two newly constructed courtyards in the middle of large developments that will remain unnamed. One was beautiful and held the promise of businesses and F&B lining its edges, while the other was empty and grim looking. We then turned to each other and said: “Isn’t it amazing how different these not-so-different courtyards are?”
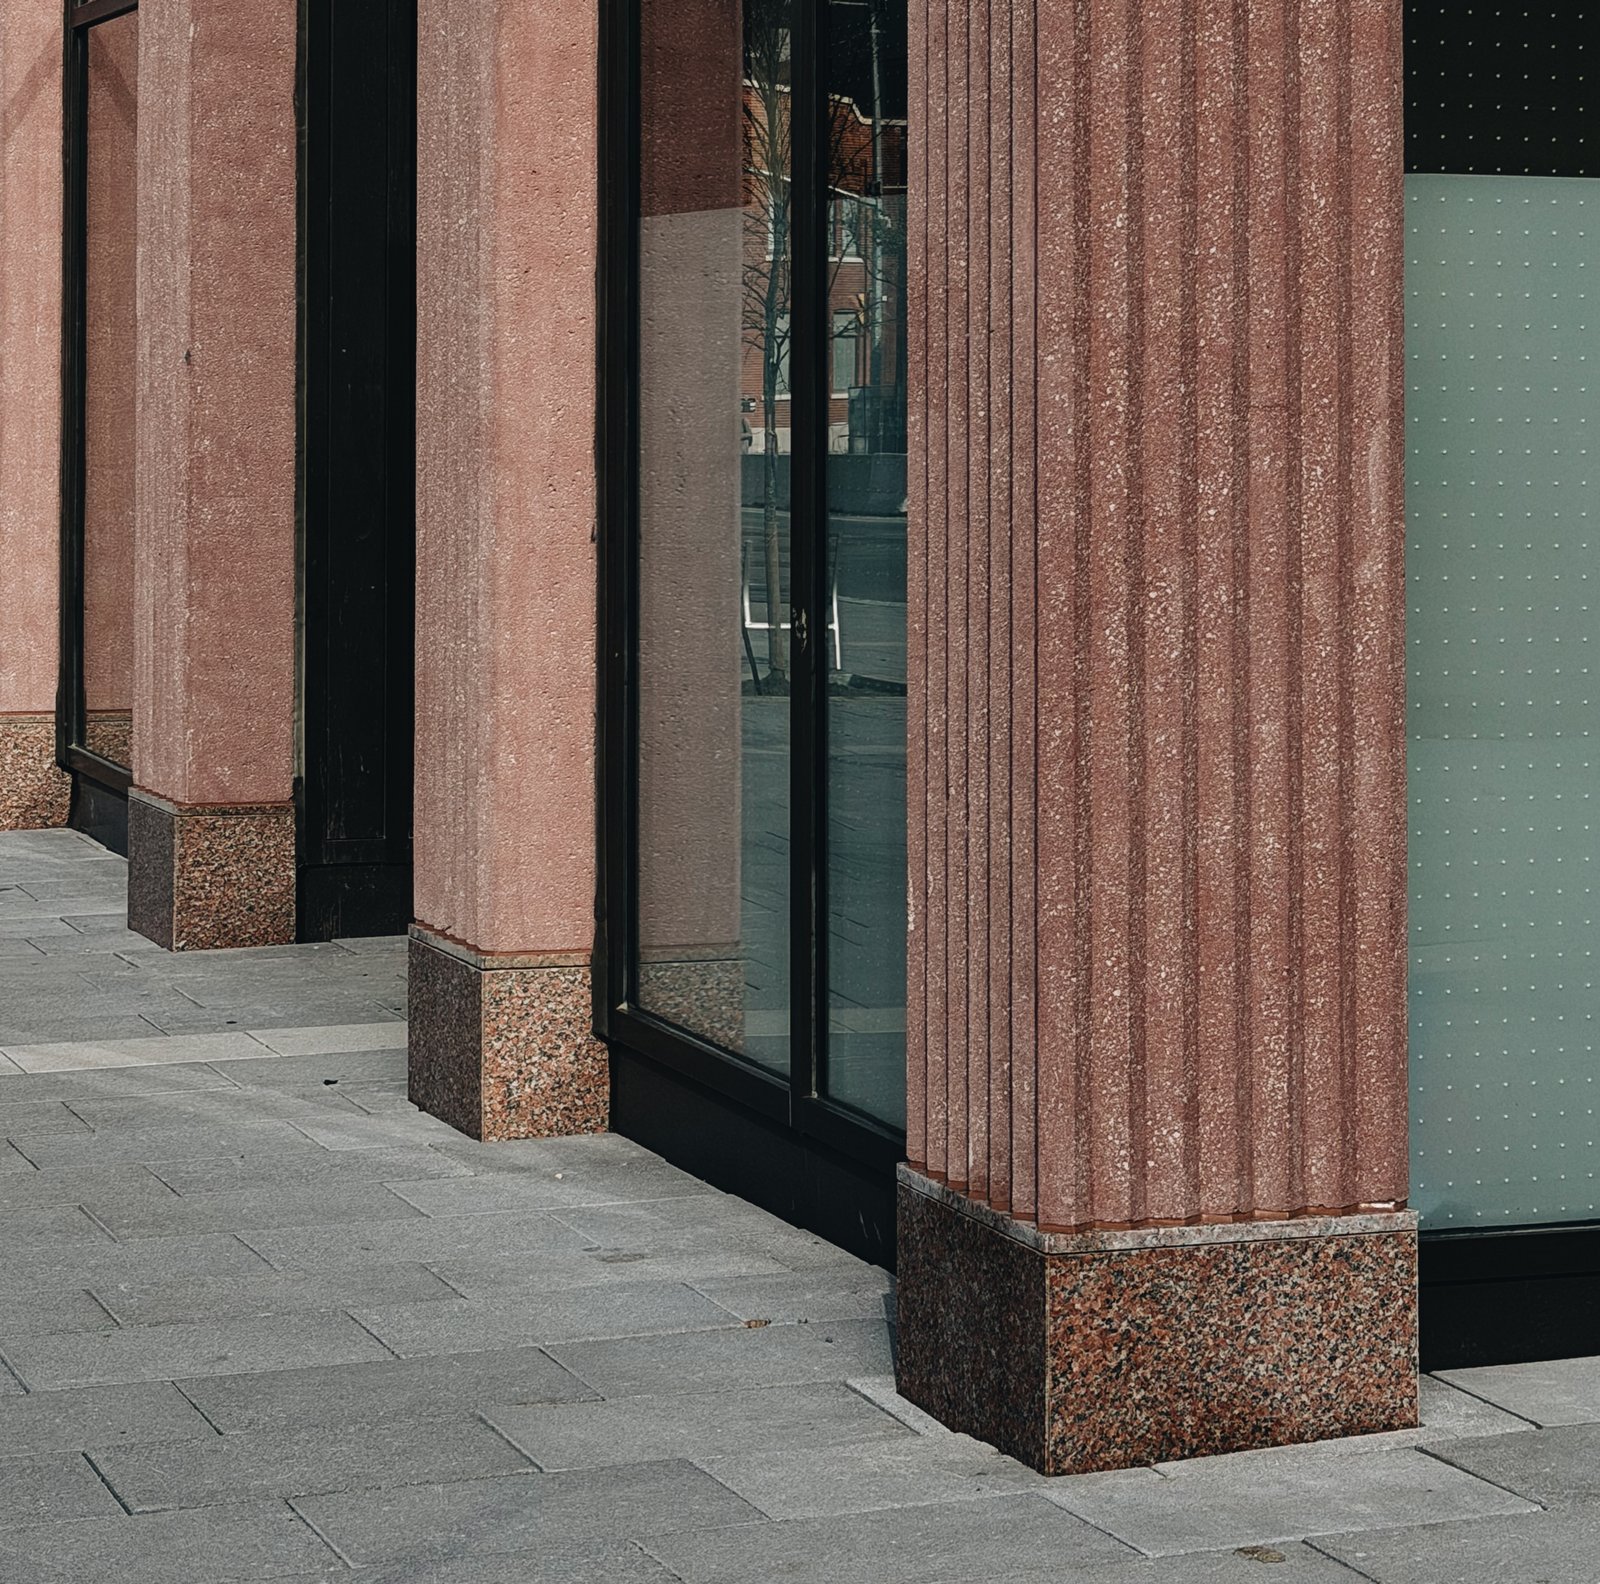
    But objectively, there’s so much that we are getting right. New streets are now subdividing formerly large, unwalkable blocks. Existing neighbourhoods are growing, adding sustained urban vibrancy. New megaparks, like Biidaasige Park in the Port Lands, have already become fantastic, well-used spaces, setting the stage for new urban neighbourhoods to crop up all along their edges. And many of our new buildings are, quite frankly, gorgeous.
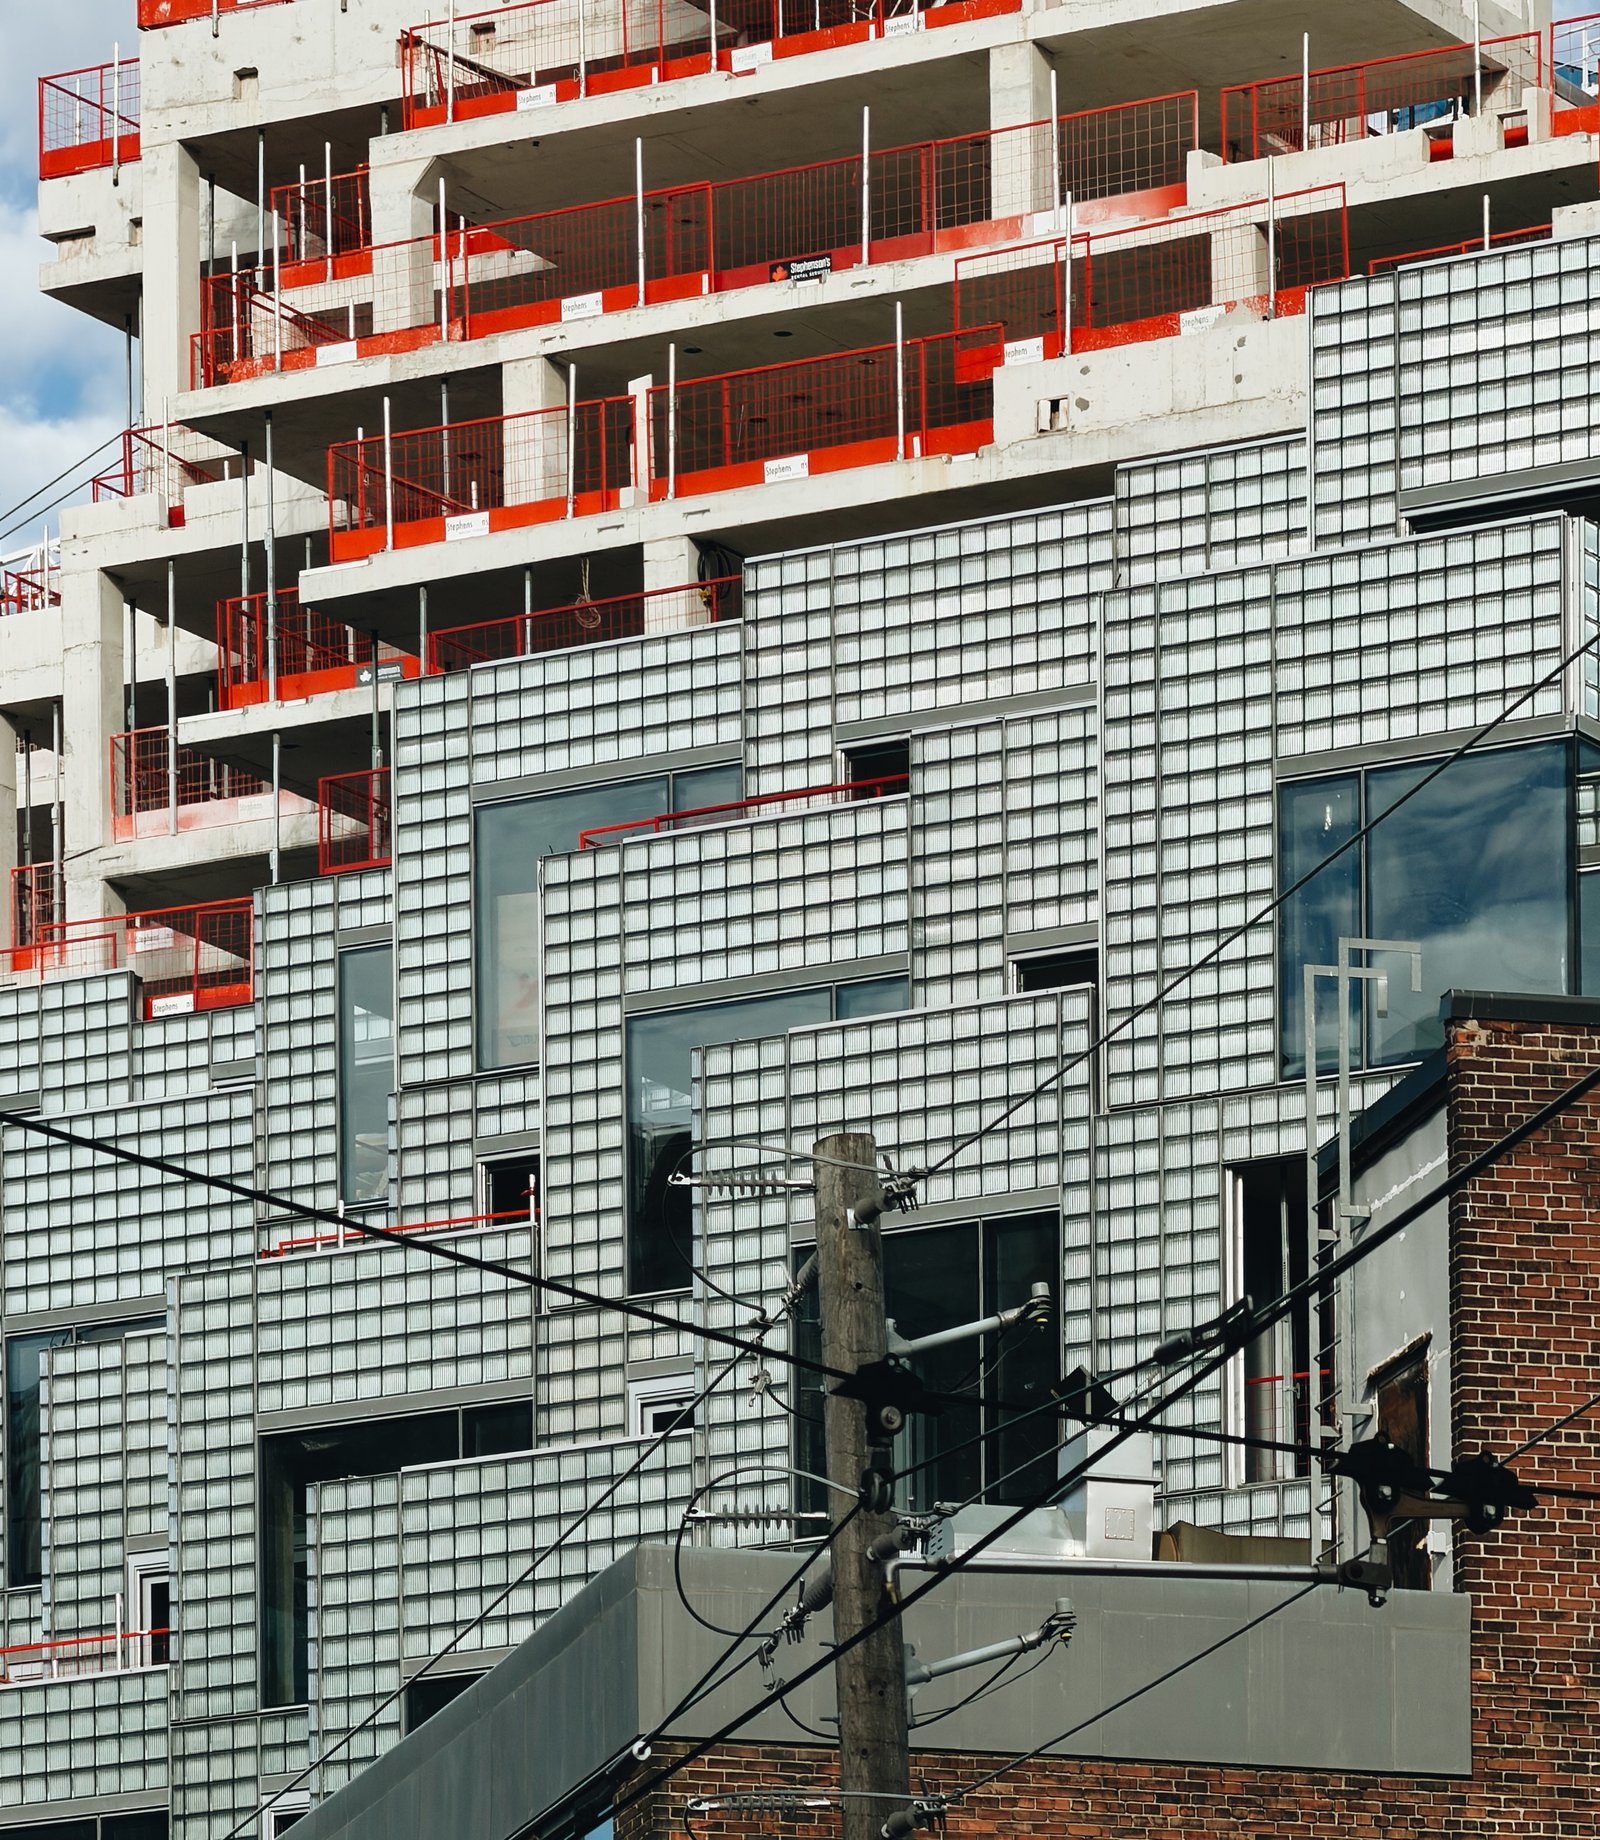
    Most importantly, though, people are using these spaces — a lot. They’re filling sidewalks, hanging out on patios, and cycling on new bike lanes. It’s easy to focus on the things that Toronto isn’t or doesn’t have, just like it’s personally easy to focus on what you may not be or have. Bringing positivity doesn’t mean ignoring the challenges that our city is facing, but being grateful for everything we are achieving is a great way to reframe our perspectives toward an abundance mindset.

    If you’re looking for an easy way to do that, try getting on a bike on a beautiful sunny day.

  • The Atlas of Greater Paris

    May 16, 2026 · View original


    Occasionally, writing a daily blog has its perks.

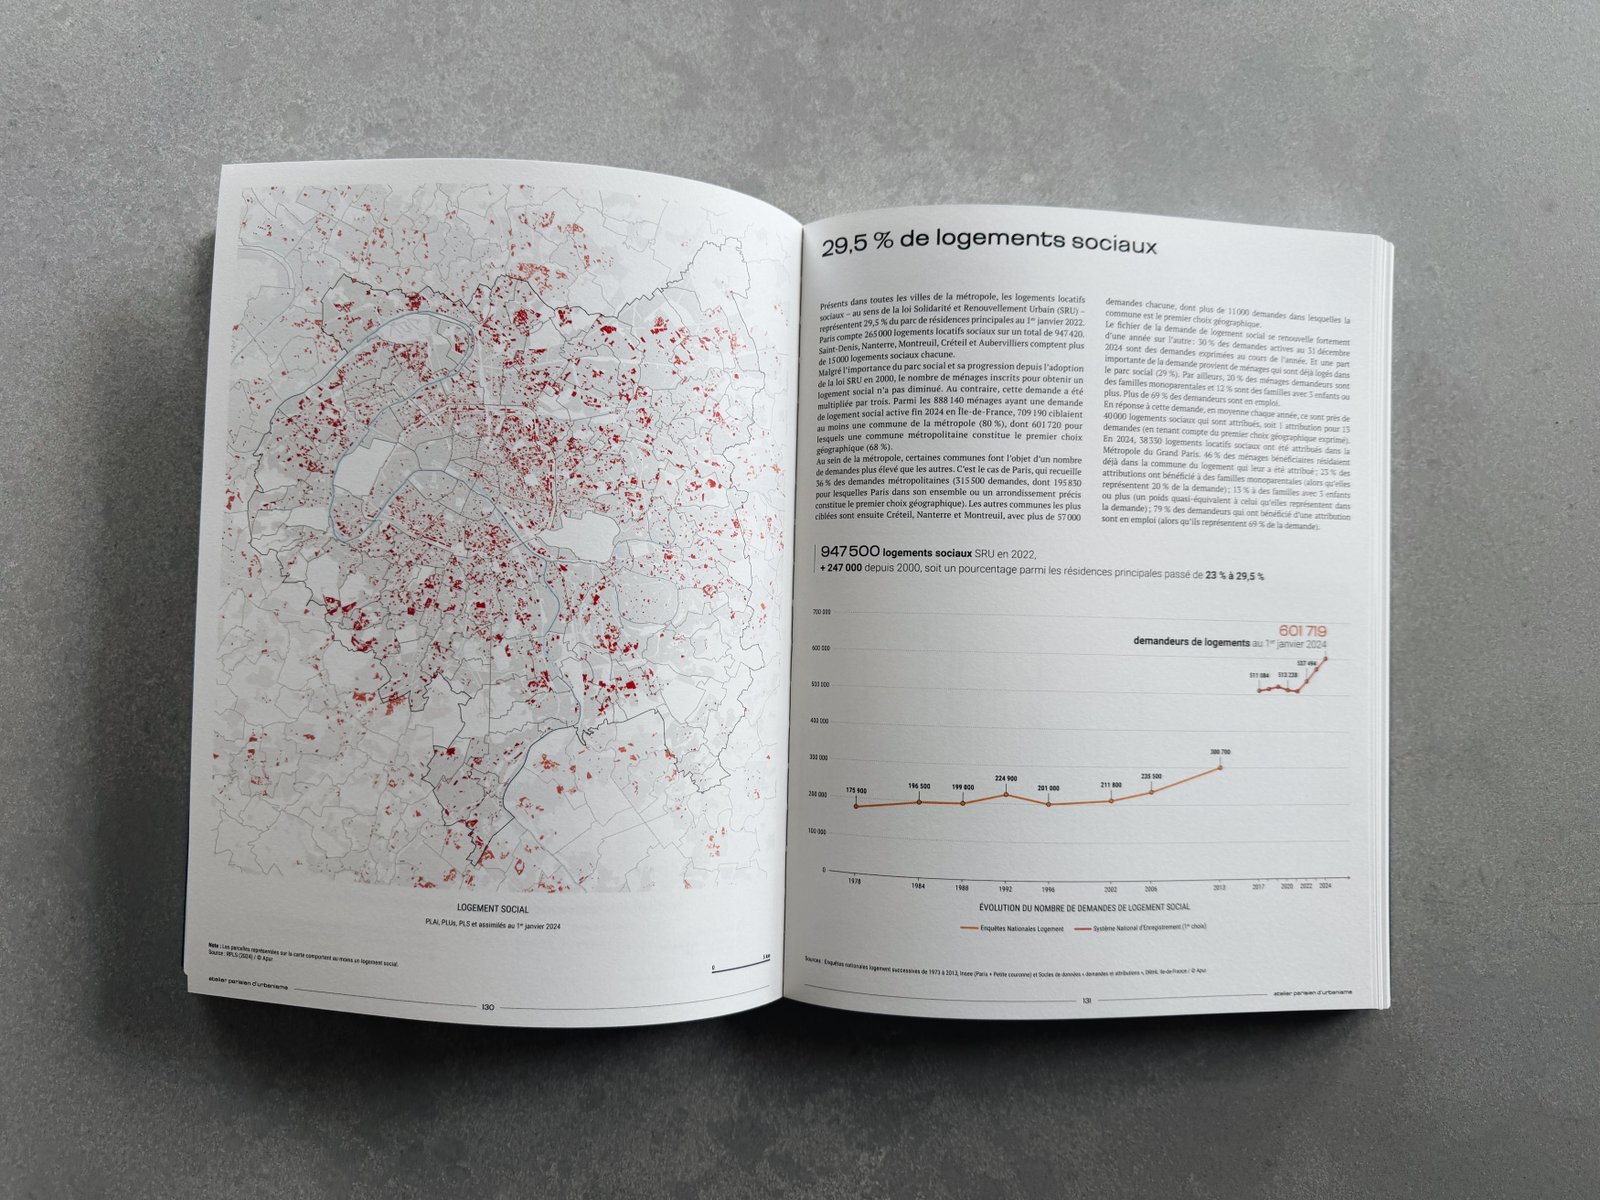
    Last month I wrote a post called “The radical transformation of Greater Paris” and, in it, I mentioned that Apur (a French non-profit focused on urbanism that I follow) had just published a new book called Atlas de la Métropole du Grand Paris.

    I also mentioned that I hadn’t been able to find a shop that would ship to Toronto, but that if anyone happens to be in Paris, it’s available in bookstores over there. Volume is apparently a great store for people who like the kind of things we talk about on this blog.

    Following the post, I got an email from Ryan Taylor at Parcel Economics who more or less said, “Hey, I’m leaving for Paris soon. Want me to grab you a copy of the book? I’ve learned a lot from your blog over the years and thought I would offer.”

    Now I have the book:

    Ryan, thanks for transporting what is a fairly substantial book across the Atlantic. If any of you are in need of a land economist, reach out to Ryan and the folks at Parcel Economics. He’s both a nice and smart guy.

    Enjoy the long weekend, everyone.

  • How A4 paper and Japanese architecture share the same geometric logic

    May 15, 2026 · View original


    This post is ultimately going to be about architecture, but bear with me while I get there. The international standard for paper sizes has three series: A, B, and C. From this standard comes A4 paper, which many of you might recognize as the most common paper size in the world, serving as the standard for most business documents. However, not all countries use this sizing. Canada and the US, for instance, use Letter-sized paper instead of A4, which is simply a result of a historical norm. Canada tried to switch to the international standard (ISO 216) when we started adopting the metric system in the 1970s, but our deep economic integration with the US made it simply too cumbersome to juggle different sizes of paper.

    The beauty of A4 paper is that it follows something known as the Silver Ratio (which equals 1 : √2 or 1 : 1.414). Its exact dimensions are 210 x 297 mm. What’s important about this ratio is that it allows for a perfectly recursive system. It works like this: A0 paper is 841 x 1189 mm (the same Silver Ratio) or exactly one square metre. If you fold this paper in half along its long side, you get two pieces of A1 paper with the exact same ratio. If you repeat the same fold, you will then get A2 paper, and so on, all the way down to A10 paper. The Silver Ratio is the only rectangle where, when you fold or cut it in half, the proportions stay exactly the same. This is a neat feature because it means there’s no waste when manufacturing different paper sizes.

    So, what does this have to do with architecture?

    Well, the Silver Ratio is heavily embedded in Japanese architecture and heritage. In fact, it’s also known as the “Japanese proportion.” It has long been appreciated for the scale it creates — it’s more square and humble, as opposed to rectangular and grand — and for the modularity that it affords. Indeed, the recursive nature of the ratio makes it practical for construction and perfectly suited to the Japanese concept of mottainai, which is a term that describes a deep sense of regret when things are wasted. A good example of this concept in practice is the recently completed Circularity Cabin by architect Takaaki Fuji. A simple family home made from standard store-bought timber, the 60 m2 structure follows a strict modular system to minimize waste and improve efficiency.

    Mottainai might be my new favourite Japanese concept.


    Cover photo by Takuya Seki via Never Too Small

  • Toronto Pearson breaks ground on one of Canada’s largest airport expansions

    May 14, 2026 · View original


    Toronto Pearson Airport has just announced a $3 billion investment called LIFT, which stands for Long-term Investment in Facilities and Terminals. (This feels like a “how do we make this acronym work” kind of name.) The investment includes an upgraded baggage system, an expansion of the airfield to 2.2 million square metres, and a bunch of new tech.

    Following this, the plan is to refresh Terminals 1 and 3, and look for opportunities to create some net-new terminal space. And when it’s all said and done, the program is expected to grow the airport’s capacity to about 65 million passengers per year by the early 2030s.

    My first reaction when I read the announcement was, “Great, let’s make Pearson better.” My second reaction was, “Why only 65 million passengers? Why not 100 million or even 125 million?” (Side note: I love airports and I think it would be a lot of fun to design and/or work on one.)

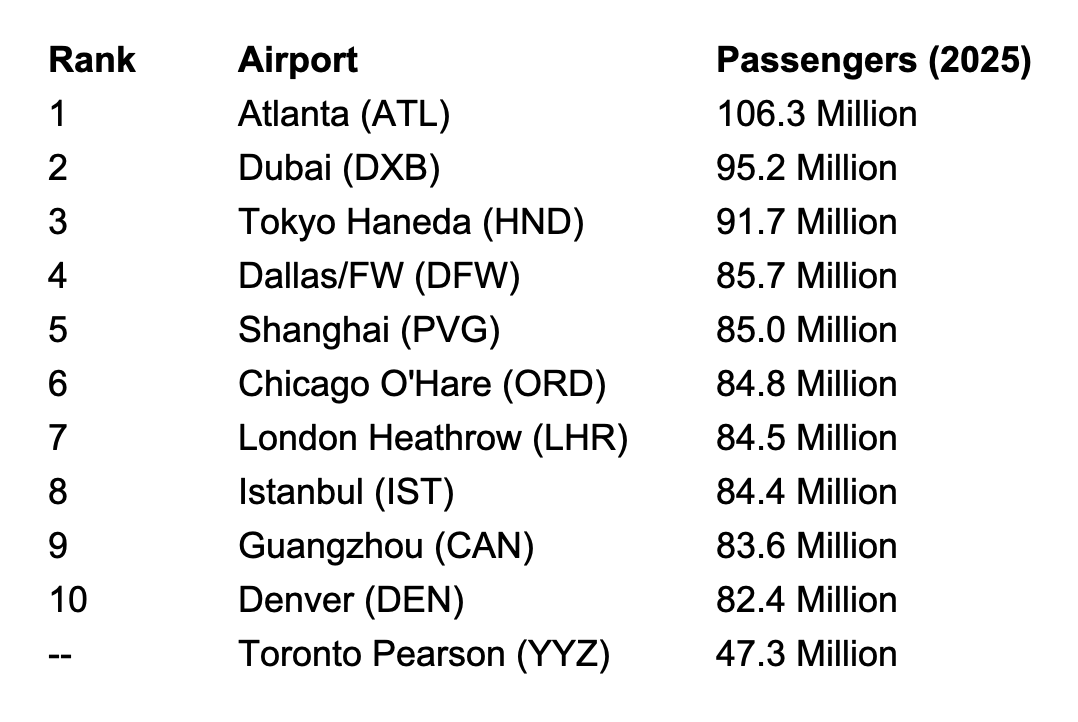
    For those of you who are curious, here are the top 10 busiest airports in the world by annual passenger volume (according to Gemini):

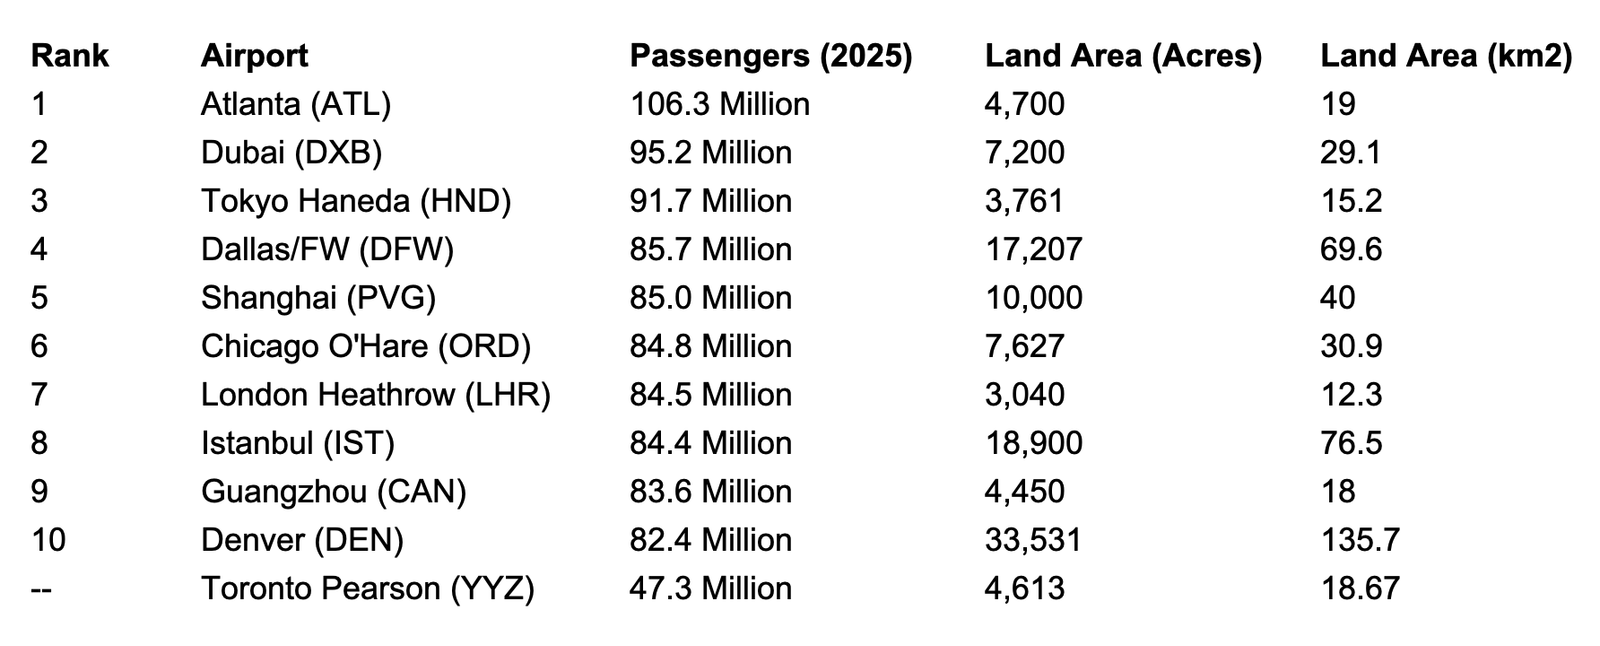
    My follow-up question to Gemini was my second reaction: Why not target 100 million passengers? The response I got was, “Yeah, well, the airport is physically constrained and simply doesn’t have the room for this kind of volume.” So then I asked it to give me the land area in both acres and square kilometres for the same list of airports:

    The obvious question: If Tokyo and London can achieve close to 100 million passengers on less than 4,000 acres, why can’t Toronto? Gemini then said, “Okay, yeah, I guess it might be possible,” but then gave a number of reasons why it’s currently more challenging; everything from the layout of the runways to the high percentage of origin & destination travel over connecting flights.

    I frankly don’t know enough about the operations of international airports to comment intelligently, but at the end of the day, the LIFT program is fundamentally about densifying the existing airport lands and unlocking additional capacity. And that’s what it will take to eventually get to 125 million!


    Cover photo by Michael on Unsplash

  • Jesta Group announces $30M bulk condominium buy in downtown Toronto

    And a larger $500 million condominium program

    May 13, 2026 · View original


    Montreal-based Jesta Group has just announced the acquisition of a bulk condominium portfolio in downtown Toronto valued at $30 million. This also marks the launch of a larger $500 million program targeting more than 1,000 residential units over the next 12 months. Here’s a snippet from the press release:

    > “Toronto’s fundamentals remain strong and the current market environment has created a unique window to deploy capital at scale,” said Anthony O’Brien, Senior Managing Director at Jesta Group. “We are aggressively pursuing opportunities that fit this investment ethos and encourage developers with qualifying inventory to reach out directly.”

    Anthony’s email is [aobrien@jesta.com](mailto:aobrien@jesta.com).

    Sentiment seems to be changing here in Toronto. Maybe it’s because summer is coming and the winter was long, or maybe it’s because our looming supply bottom is drawing nearer. Regardless, a $500 million program certainly suggests that somebody believes we are at or near the bottom.


    Cover photo by Rodolfo Flores on Unsplash

  • Rethinking the suburban dream

    May 12, 2026 · View original


    There’s a conventional school of thought that the best place to raise a kid is in the suburbs. Walkable, urban centers are great for young singles, but when it comes time to grow your family, the default assumption is that it’s time to move on. Anecdotally, I can tell you that, now that we’re expecting, some people assume we’re obviously going to move from our condominium in the city to a low-rise house somewhere else.

    But this viewpoint also shows up in the data. According to a recent article from The Economist, between 2010 and 2024, the total population aged under 18 declined by 22% in Chicago, by 23% in Los Angeles, and by 12% in New York. These figures are the sort of thing that lead some people to conclude that the suburbs are simply a natural market outcome. It’s what families want, right?

    However, it turns out this isn’t universally true! The same dataset also reveals a clear exception: rich white families. Over the same time period, the number of white children grew by 6% in Chicago, by 13% in Brooklyn, and by a staggering 62% in Washington, DC. In certain inner-city neighbourhoods in Chicago, namely Wicker Park, the number of white children has increased by 39% and 94% (based on the two zip codes that make up the area).

    Here’s what’s going on:

    > Families are mostly not moving in; rather people are moving to suburbs less once they become parents. Eric Johnson, a software engineer who grew up in Elgin, an outer suburb of Chicago, now has a ten-month-old baby in hipstery Logan Square. “We love the farmers market…I like not having to drive,” he says. Sara Weston-Shea, a social worker, grew up in suburban New Jersey and now has two children in Bay Ridge, Brooklyn. “We can just easily access the wonderful resources that a city has, the arts, music, whenever,” she says. She likes that her kids are growing up in a multicultural neighbourhood, and that she can cart them around on a cargo bike.

    What this tells us is that, no, the suburbs aren’t necessarily a de facto market outcome for everyone. There are families who have the means to live wherever they want, and they are choosing walkable, transit-oriented urban communities. These are crucial data points because if rich white families are making this decision, how many others would do the same if only they had the means or, more importantly, if we were able to deliver more housing within their means?

    This is a core city-building thesis of mine. There are families who move to the suburbs because that’s what they prefer, and that’s totally cool. But there’s also a segment of the market that moves because they have no other choice. How big this segment actually is can only be accurately determined by figuring out how to meet that demand. And that’s why addressing this need is one of the great opportunities and challenges facing large cities today.


    Cover photo by Brad Knight on Unsplash

  • Electric vehicles do have lower lifetime emissions than gas cars

    May 11, 2026 · View original


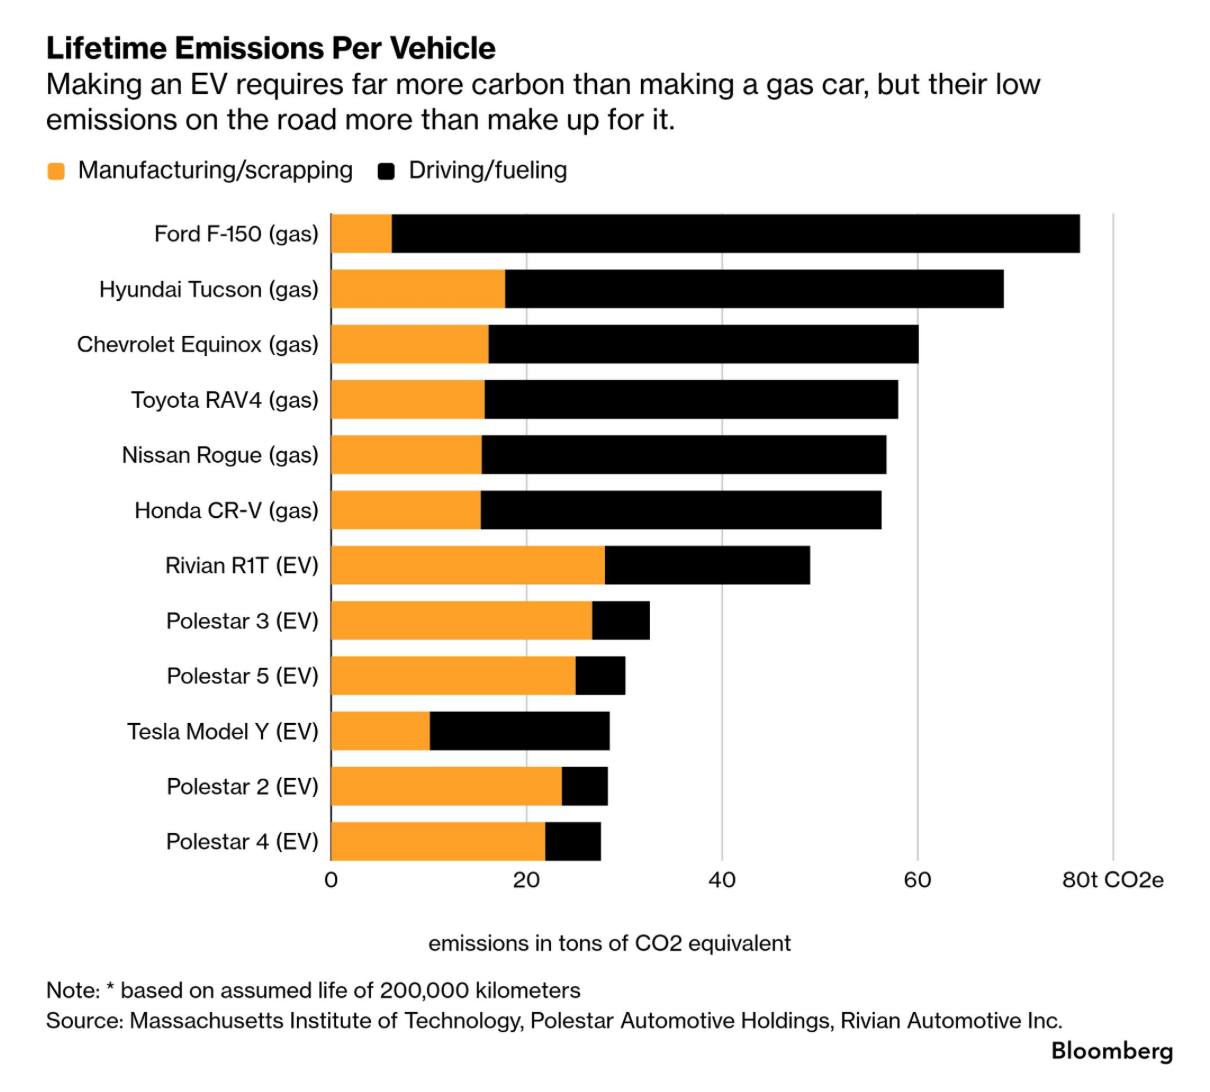
    One of the common criticisms of electric vehicles is that, because they generally require more carbon to make than gas cars, they aren’t really “greener.” Well, here’s a chart from Bloomberg that looks at lifetime emissions per vehicle for both gas cars and EVs:

    The orange bars represent carbon emitted during manufacturing and scrapping (i.e., the dismantling of the car and the safe disposal of the battery). These processes are carbon-intensive. But it’s during the driving/fueling phase where EVs shine.

    The above chart assumes a vehicle life of 200,000 kilometres. Over longer mileage periods, this chart of course looks even better. At the same time, companies are actively working to reduce the orange bars. Polestar is targeting a net-zero car by 2035.

    Importantly, this isn’t going to be done through offsets. It’s being done by greening their supply chain, which they record on a blockchain for transparency and finality. Each and every car comes with a Life Cycle Assessment.

    My current car is over 8 years old, and I remember thinking when I bought it that it would be the last gas car I ever owned. That’s right.


    Cover photo by Kenny Leys on Unsplash

    Chart from Bloomberg

  • The current state of unsold condominiums in Vancouver and Toronto

    May 10, 2026 · View original


    According to recent data from CMHC via the Globe and Mail, here’s (at least part of) the housing situation in Vancouver and Toronto:

    – Metro Vancouver has 4,919 newly built unsold homes on the market (including houses, duplexes, row houses, and condominiums). – Of this total, 3,195 are unsold condominiums. All of these figures exclude homes that were sold but where the buyers failed to close. – Across Metro Vancouver, 37% of the unsold condominium inventory is priced above $1 million. – In the city of Vancouver proper, 81% of the unsold condominium inventory is above $1 million, with more than 14% priced above $3 million. – In the Greater Toronto Area, there are only 701 newly built unsold units on the market, and in the city of Toronto, 61% of these are priced at or above $1 million.

    Initially, the 701 figure seemed low to me, but the way I interpret this “unsold” metric is that it’s strictly a best attempt at a moment-in-time snapshot of developer inventory in newly completed projects that have never been subject to a purchase agreement.

    Missing from these figures are unsold homes currently under construction, and recently closed homes that have never been occupied and are now on the resale market or are simply sitting empty. Again, if a buyer failed to close, these homes would not show up in the CMHC figures.

    It also doesn’t include homes in the pre-sale phase. However, I think this supply is mostly irrelevant because if the developer doesn’t get to construction then that inventory quickly disappears from the market. It’s not sitting there needing to be absorbed (though we developers would love for it to be).

    The Globe and Mail article talks about how there are over 40,000 housing units that have been approved in Metro Vancouver but have not yet proceeded to construction, and that “newly built condos in Vancouver are too pricey to sell.” But the salient question is one of product-market fit: What housing do customers actually want, and can afford, today?

    As we have talked about many times before on the blog, I think we need to view this moment in time as an opportunity to reset our housing markets. In other words, it’s an opportunity to look at how we regulate and tax new housing, and at what and how we build, all with the goal of better serving the housing needs of Canadians.

    My specific view is twofold: We need to cut the regulatory fat around delivering new homes, and we need to better optimize for medium-density housing.

  • Paris has really small garbage rooms

    May 9, 2026 · View original


    In today’s episode of “this social housing project in Paris looks better than most market-rate housing elsewhere,” we’re looking at a recently completed boarding house in the 17e by CQFD Architecture.

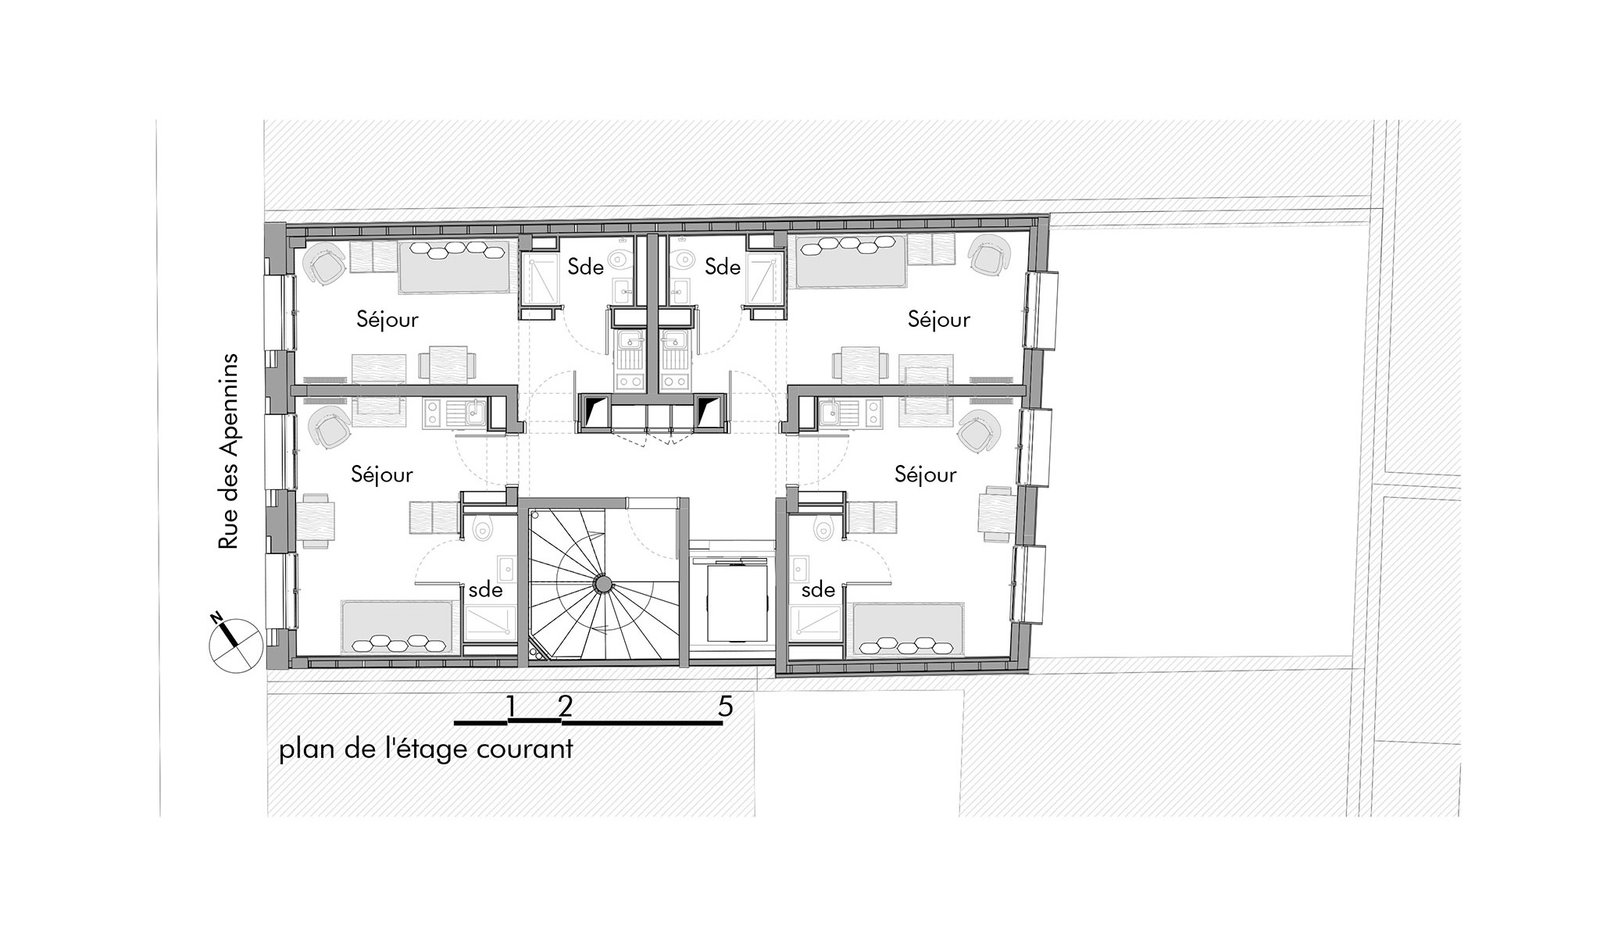
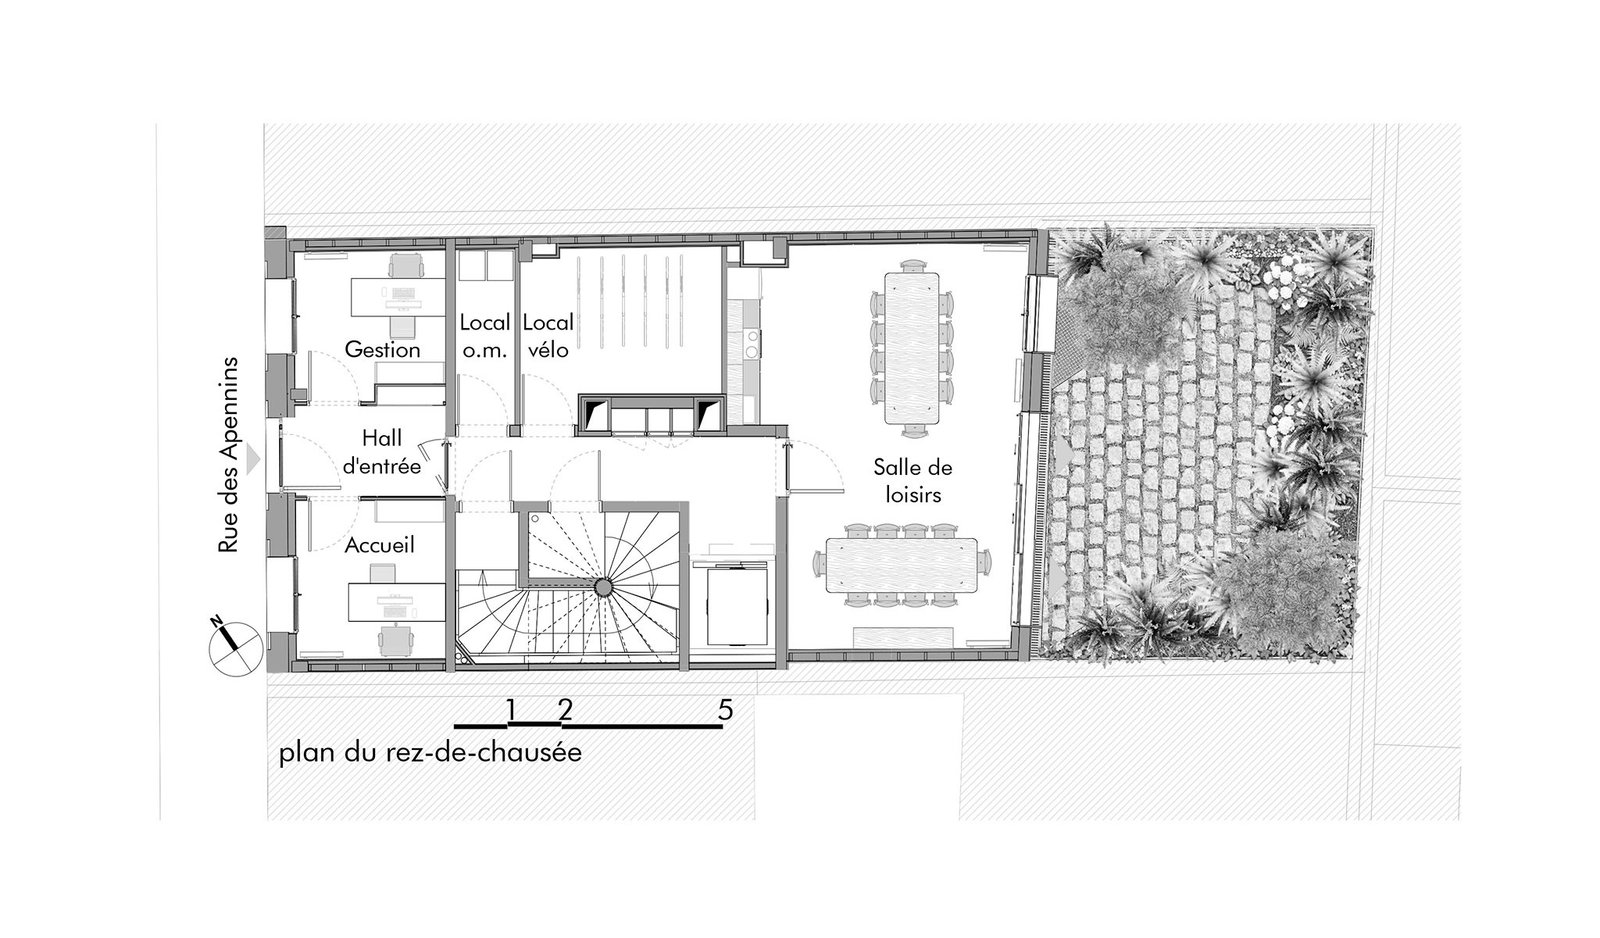
    The project has 6 storeys, a total area of 690 m2, 19 units, and a hard cost budget that was approximately €2.6 million (excluding tax). At this number, their hard costs work out to ~€3,768 per m2, ~€350 per ft2, or ~C$563 per ft2. So this was not a cheap build. Here’s what it looks like:

    When I first saw the project, I thought the total area would be larger than it is. At 690 m2, it’s basically the size of a multiplex project here in Toronto. Except here in Paris, they’ve gone vertical and they’ve managed to fit 19 studio apartments, plus amenity space.

    All of this is possible when you consider the efficiency of each floor plate. The typical floor includes 4 apartments, one stair, one elevator, and a short corridor. Add in a second exit stair and all of this blows up.

    Also interesting is the efficiency of the ground floor. There’s an entrance hall, management office, bike room, recreation room, outdoor garden, and a teeny tiny garbage room (“local O.M.” on the plan). As I understand it, this is all that’s required for refuse because of how frequently it’s picked up.

    If this were in Toronto, we’d probably need a dozen bins, meaning that the bike room and/or recreation room would need to shrink down.

    I love dissecting plans and dimensions from different cities because it shows you the invisible hand of building codes, planning policies, and cultural norms. We get accustomed to certain conventions and then we assume that it’s simply the way that things must be done.

    But the rules we have are simply the rules that somebody decided to create. As Steve Jobs once said, “Everything around you that you call life was made up by people that were no smarter than you.” This implies that everything can be questioned and ultimately changed when there’s a better solution.


    Photos from CQFD Architecture

    Floor plans from Metalocus

  • Old Toronto is unlike anywhere else in Ontario

    May 8, 2026 · View original


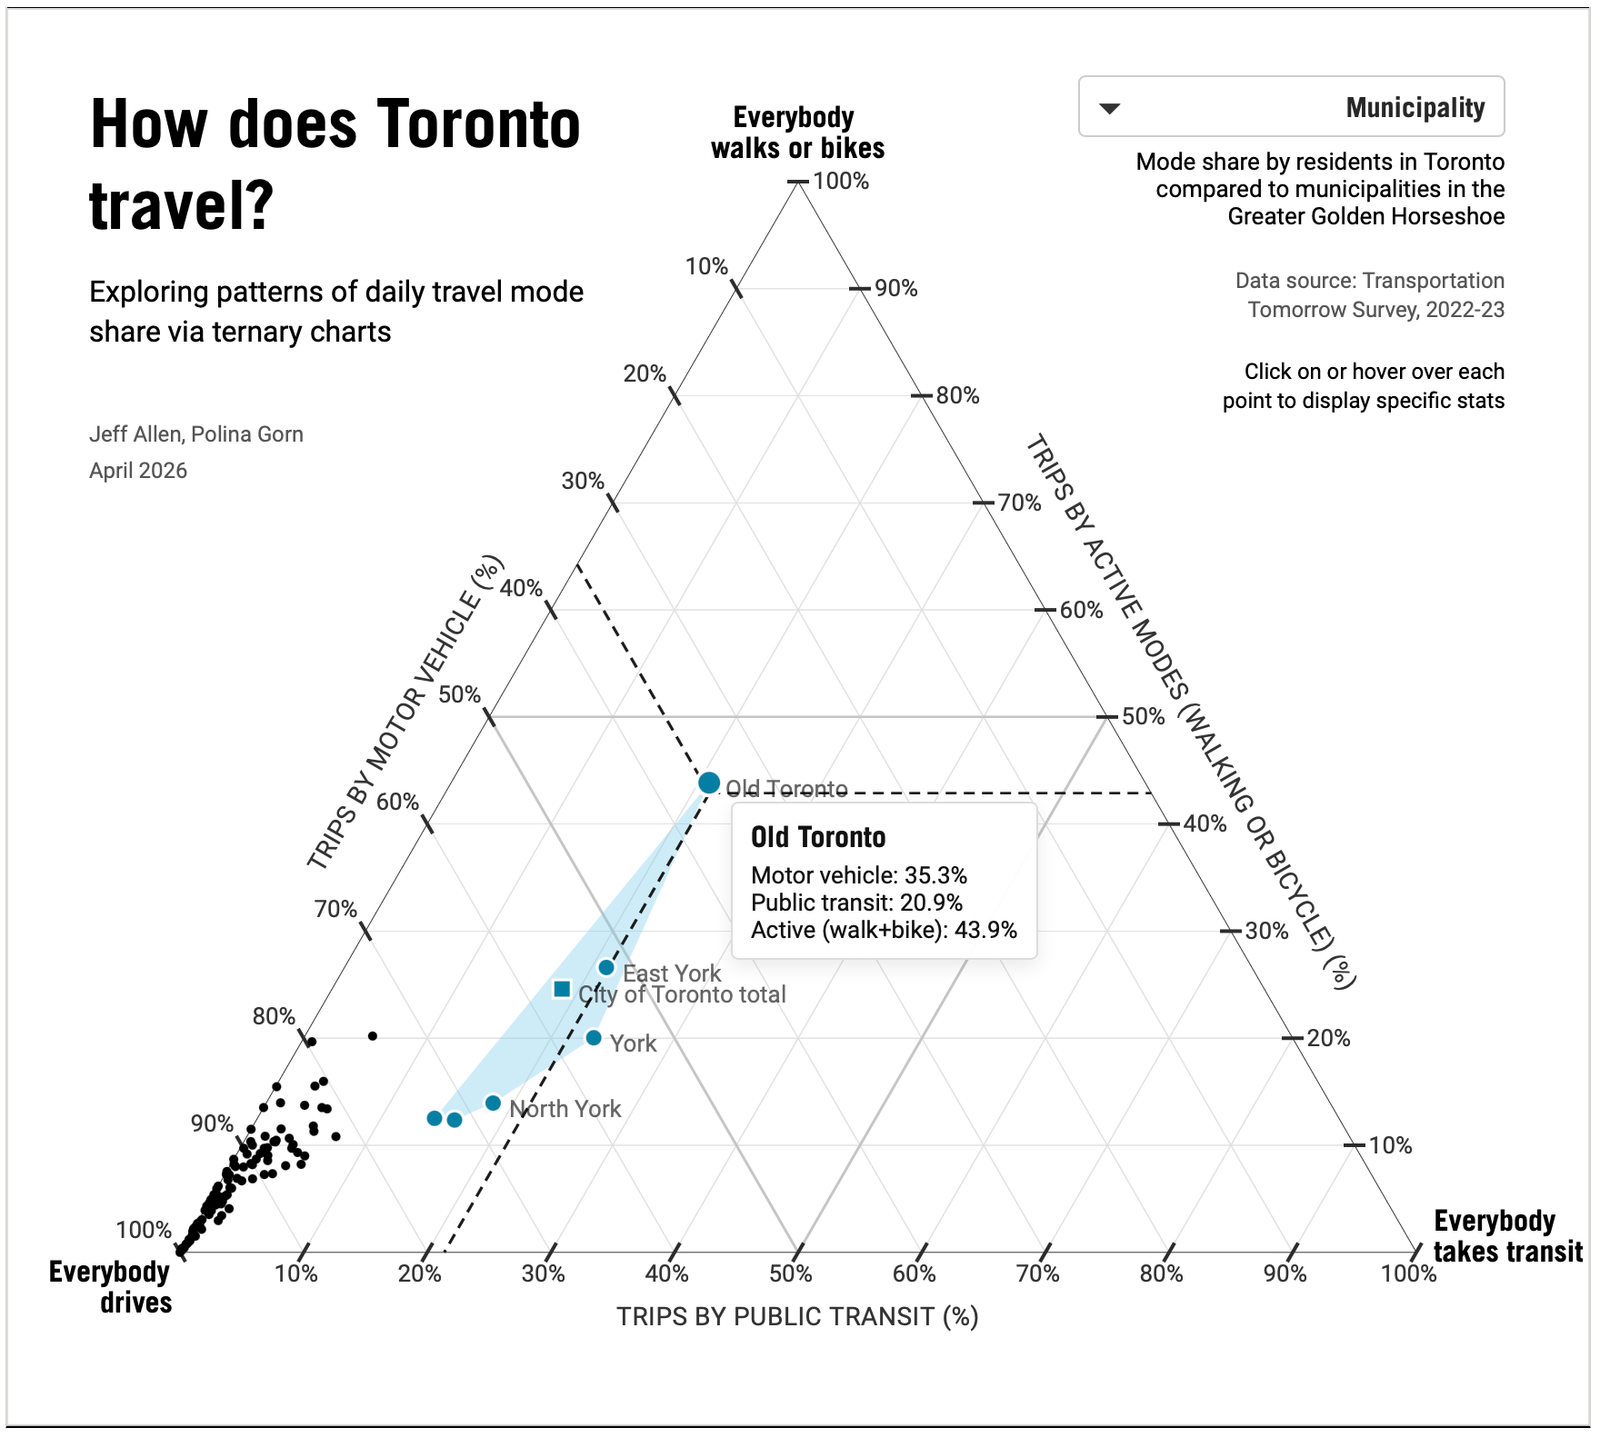
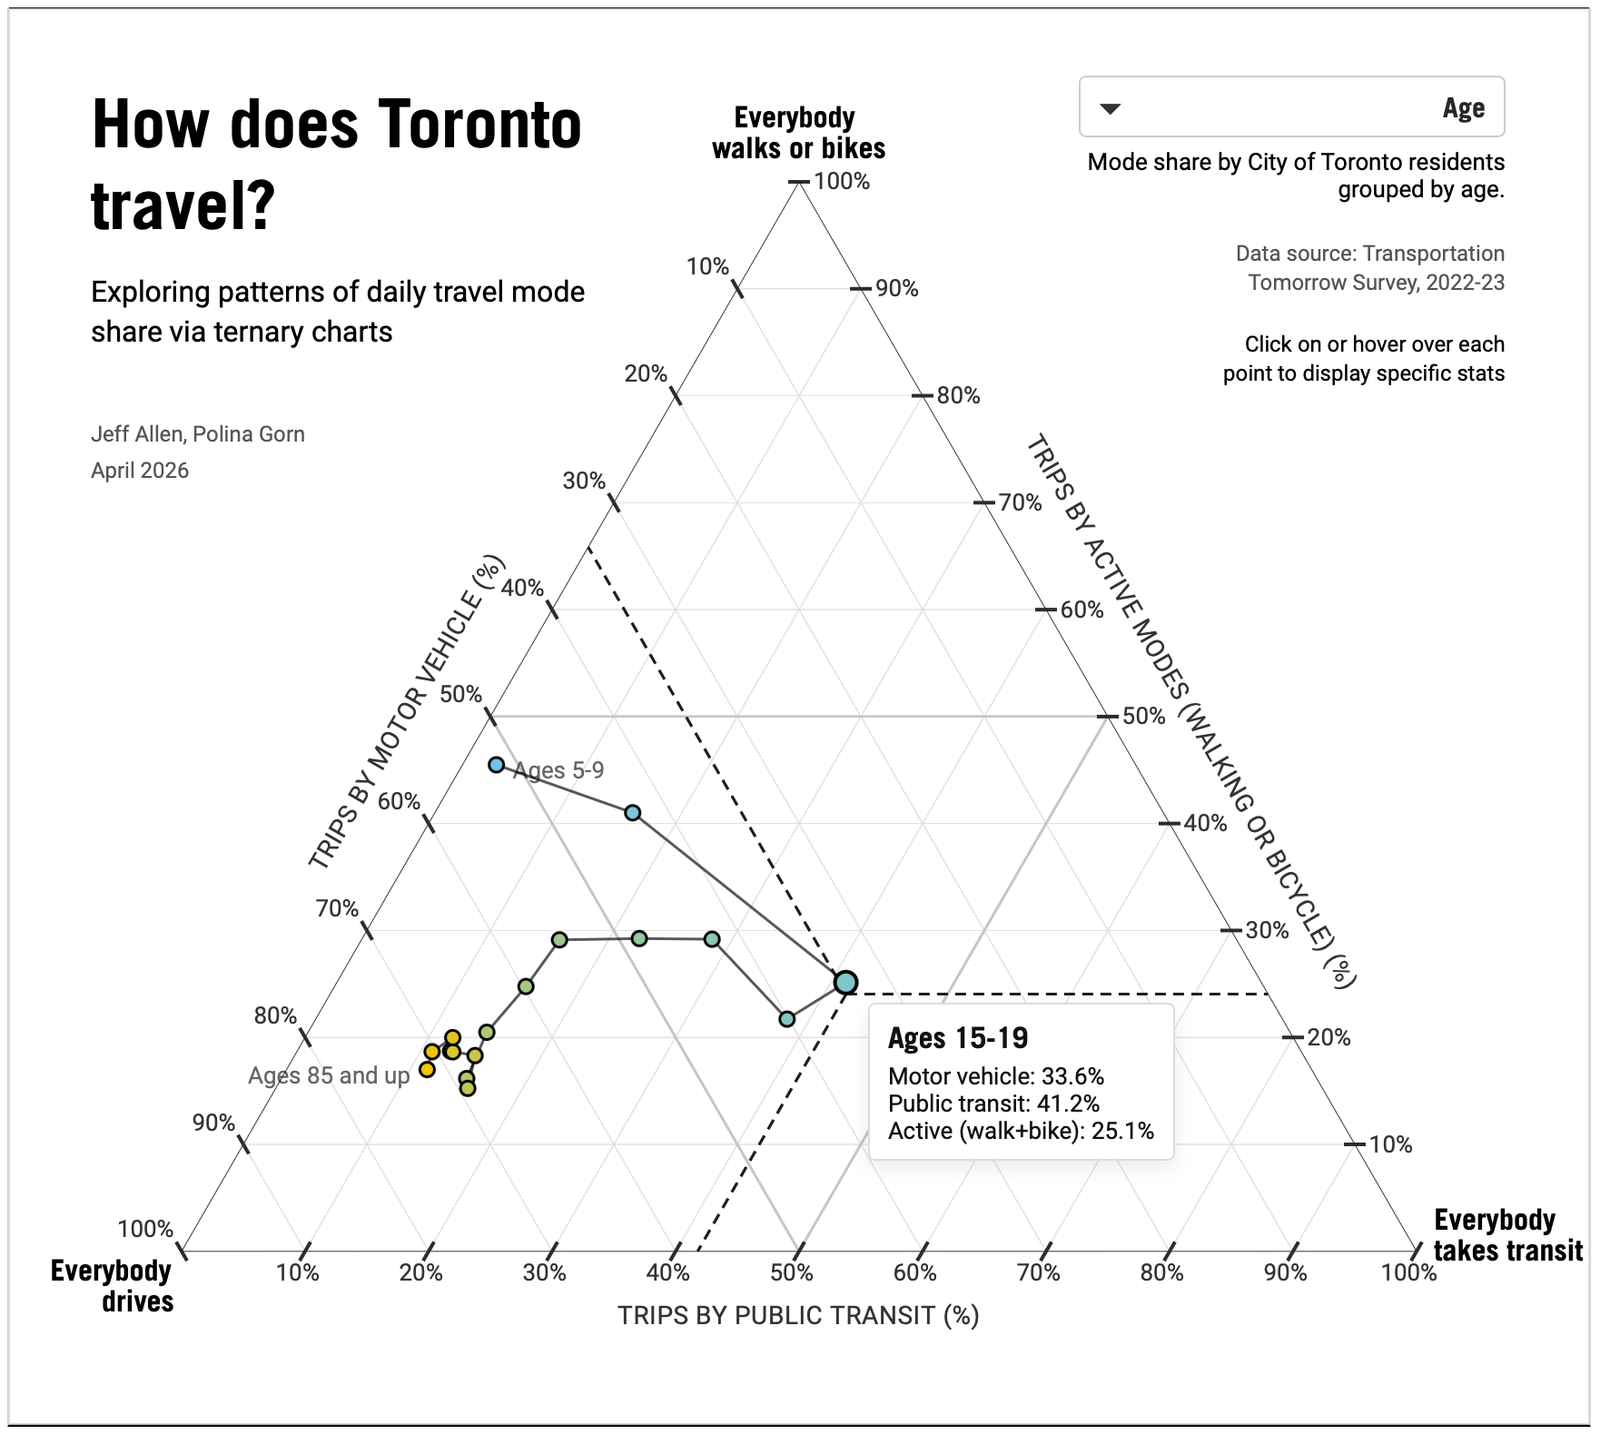
    These charts, from the School of Cities at the University of Toronto, are an excellent use case for a ternary chart. A ternary chart is a triangular plot with three different variables that all sum to a constant. In this case, the charts compare driving, walking/biking (active transport), and taking transit, with the constant being 100%. The data is from the 2022-23 Transportation Tomorrow Survey.

    What is clear from the first image above is that Old Toronto (also known as the former City of Toronto before amalgamation) is unlike any other municipality in Ontario. Its tight, pre-car urban fabric and transit coverage mean that nearly 65% of people walk, bike, or take transit! This is compared to about 43% for the entirety of the city today; meaning, Old Toronto is the only place where driving isn’t the majority mode.

    The second chart above shows mode share by age. What is interesting to see, though not surprising, is that younger people are more likely to walk, bike, and take transit. Here, the figures peak between the ages of 15-19 with over 66% of trips falling into these categories, which is just slightly above the Old Toronto figure. Then, as people get older and have greater incomes (which is another one of the charts), they move toward driving.

    Of course, this doesn’t mean that all older people must drive. There are lots of older people who live in Old Toronto where doing something other than driving makes up the majority of trips. Urban form, density, and access to transit play the most important roles in determining what modes of transport people will choose and what they find most convenient.


    Cover photo by Mitch Hodiono on Unsplash

    Charts from the School of Cities