Daily insights for city builders, delivered every morning at 6 AM ET. I’m Brandon Donnelly — a Toronto-based real estate developer and founder of Globizen. I’ve been writing here since 2013.

Category: Places

  • The Toronto and Vancouver housing markets

    CIBC World Markets recently published this report by Benjamin Tal talking about the Toronto and Vancouver housing markets. Here is an excerpt:

    “But when the fog
    clears it will become evident that the
    long-term trajectory of the market will
    show even tighter conditions. The supply
    issues facing centres such as Toronto and
    Vancouver will worsen and demand is
    routinely understated. Short of a significant
    change in housing policies and preferences,
    there is nothing in the pipeline to alleviate
    the pressure.”

    It’s a good read. Worth your time.

    One stat that stood out and directly relates to some of the topics that we frequently talk about on this blog is the shift in Toronto from low-rise to high-rise housing.

    In the report there’s a chart showing the “change in [housing unit] completions” in 2016 as compared to 2000. The switch from low-rise to high-rise is almost 1:1 in Toronto. In other words, we substituted high-rise housing for low-rise housing. 

    I think this speaks volumes about the fundamentals underpinning the Toronto condo/apartment market. We are continuing to build up because it is the future of housing in this city.

  • MONAD, Vancouver

    image

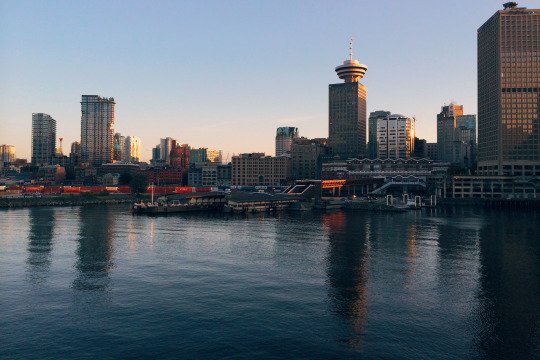
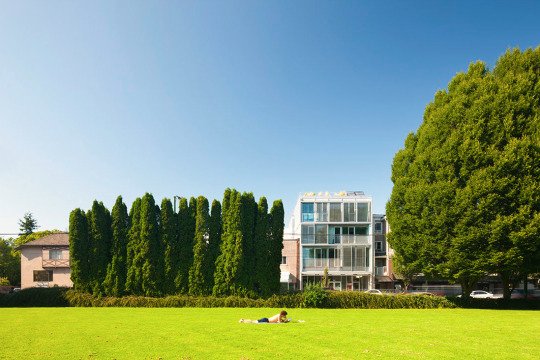
    Earlier today, Nithya Vijayakumar, of The Pembina Institute, pointed out the above housing project to me on Twitter through this 2013 Dwell article (worth a read).

    The project is called MONAD and it’s a 4-unit, 12,600 square foot prefabricated multi-storey building in Vancouver on West 4th Avenue. 

    The site itself is 33′ x 110′, which just so happens to be the same size as a typical single family lot in the city. However, this one sits on a main street.

    Completed in 2011 and designed by Lang Wilson Practice in Architecture Culture, the development was intended to be a pilot project and a rethink of urban living.

    There are real diseconomies when you develop at this scale, but if you make it high-end enough the math just may work. What a beauty.

    Above image from LWPAC. More photos here. 

  • Seattle vs. Vancouver

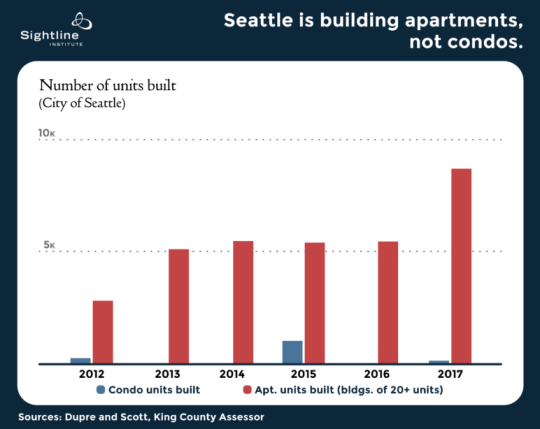
    A reader recently shared an article with me called: Why Seattle builds apartments, but Vancouver, BC, builds condos. Thanks for that.

    It’s a good summary of the differences between these two markets and why over the last five years less than 4% of all new residential units built in Seattle have been condos. The story is obviously very different in Vancouver.

    It’s also a good reminder that incentives matter. Capital has a funny way of flowing to where the returns are greatest.

    Chart: Sightline Institute

  • Laneway housing represents 19% of all new single family and two family dwellings in Vancouver

    One of the criticisms surrounding laneway housing is that – while great – there is no way for this housing typology to have a meaningful impact on the overall housing supply equation.

    I’ve previously written about the impact of laneway housing in Vancouver. But I wanted to revisit some of the data following this tweet by GRIDS Vancouver, where they link to a spreadsheet they prepared using the City of Vancouver’s building permit data.

    Laneway housing was first allowed in Vancouver in 2009. In that first year, only 18 building permits were issued. But since then the number has grown steadily. In 2014, they hit 377. And in 2015 (up to September), they hit 360. So for the full year, it is highly likely they will show yet another year-over-year increase.

    Since laneway houses became permissible (and up to September 2015), a total of 1,885 building permits have been issued. During this same time period, 8,239 permits were issued for other low-rise housing, up to and including duplexes. This includes single family dwellings, single family dwellings with a secondary suite, and two family dwellings.

    So for a period of almost 8 years, laneway houses have represented on average 19% of all new single family and two family dwellings in Vancouver. If you include low-rise multifamily product into this equation (more than 2 units, but 3 storeys or less ), the percentage is still slightly above 17%. This is something. It’s not everything, but it is certainly something. 

    More conventional low-rise housing still represents a greater number and, of course, most of the new supply is coming in the form of condos, apartments and other higher density housing. But 17-19% are still meaningful numbers when part of the affordability problem is clearly a lack of supply.

    It is for reasons such as these that I, along with many others, want to bring laneway housing Toronto. If you feel similarly, please consider supporting my prototype project by signing your name here.

    Update: A previous version of this post stated that 19% of all new low-rise housing in Vancouver had become laneway housing. This number was calculated on all low-rise housing up to and including duplexes, but excluded low-rise multifamily product. The above post has been updated to lend more precision to my understanding of the data.

  • Video: New York 1911

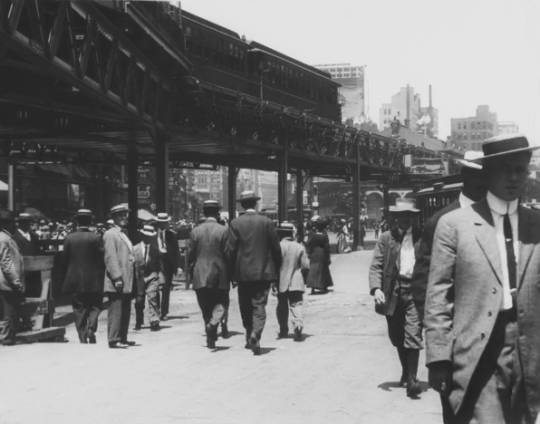
    The Museum of Modern Art (MoMA) recently restored and published a “documentary travelogue” of New York City from 1911. 

    It was originally filmed by a Swedish company, called Svenska Biografteatern, that went around the world filming noteworthy places such as Niagara Falls, Paris, Monte Carlo, and Venice.

    Not surprisingly, New York City is a vibrant and bustling place at the beginning of the 20th century. But it somehow feels serene. Maybe it’s the soundtrack. It’s also interesting to think that this was filmed only 3 years before World War I broke out.

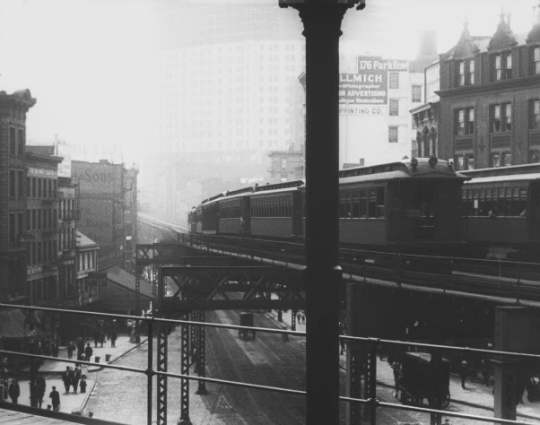
    I particularly enjoyed seeing all of the streetcars (trams) and elevated rail running through the streets.

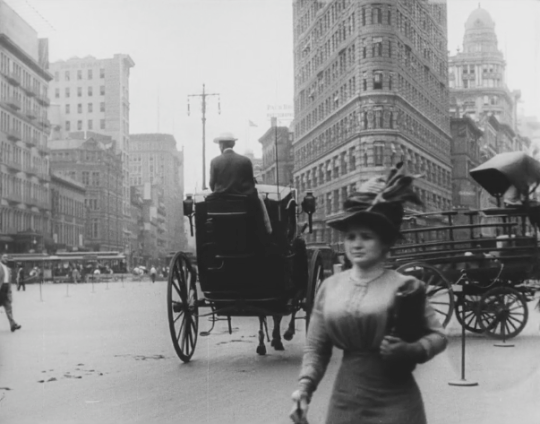
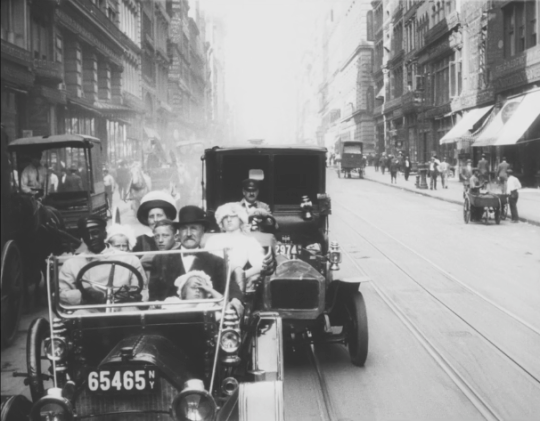
    Below is a screenshot of a young girl – clearly bored and/or disinterested – being chauffeured down Fifth Avenue in what was almost certainly a fancy convertible at the time.

    MoMA doesn’t allow you to embed the video, but you can watch it here through July 14. It’s 9 minutes and, if you’re a city nerd like me, I think you’ll really enjoy it. The street life footage kicks in around the 3 minute mark.

    Screenshot Images: MoMA

  • MOMO TOKYO

    Last summer, photographer Parker Woods spent two weeks walking over 100 miles in Tokyo with a peach-colored (”momo” in Japanese) backdrop and a metal c-stand. He used this accessory to “contextualize his first encounter with Japanese culture.”

    In some cases, it functions as you would expect: as a backdrop for the new people that he encountered along his walking journey. 

    But in other cases, the backdrop is simply inserted into the urban environment. Sometimes rolled up amongst a pile of metal tubes. And sometimes fully erected in the middle of a busy road.

    This is an interesting photography project based in one of my favorite cities in the world, and so I wanted to share it on the blog. All of his photos were shot on Kodak film. It’s also giving me some ideas for my own photos.

    If you’d like to buy a copy of the book ($40), you can do that here. There’s a limited run of only 250 copies. If you’d like to read a bit more about the project (and see a few additional photos), you can do that here on VSCO.

    Image: Parker Woods

  • From Tokyo to Toronto — annual property survey

    This month’s issue (May 2017) of Monocle magazine is a special “design & property” edition. It includes their annual property survey (shown above), which showcases interesting projects and people from around the world.

    I was excited (but not surprised) to read the editor’s letter at the beginning of the issue and learn that the Monocle folks “think all the time” about launching their own property company. I would love to see how they execute on a development project, because I am sure it would question conventional norms.

    Ian Gillespie of Westbank (headquartered in Vancouver) is featured and interviewed under the heading: “a more beautiful city.” Here you’ll hear him say that they build Porsches and not Fords. I also learned that they acquired a district energy company called Creative Energy, which they are looking to bring to Toronto and Seattle.

    Because it’s a property issue, the ads are also tailored to that, so you get a good cross section of international projects. This morning was my first time seeing One Park Drive in Canary Wharf – London’s first residential tower by Herzog & de Meuron.

    So if design and property also happen to be your jam, you may want to pick up the May issue of Monocle.

  • How Vancouver assesses laneway house eligibility

    image

    Vancouver has supported laneway houses since 2009. So today I thought I would take a look at what their policy considers to be an “eligible lot.” All of the information for this post was taken from this laneway housing how-to guide dated November 2016.

    Here are some of the main ways in which they assess eligibility:

    • Laneway houses are allowed on all lots in the following zones: RS single family zones, RT-11/11N, RM-
      7/7N, RM-8/8N, RM-9/9N and RM-9A/9AN.
    • LWHs are permitted in addition to a secondary suite within the main house.
    • LWHs can be for family use or for rental.
    • LWHs are permitted on lots with a minimum width of 9.8m (32.15′). But provided they are designed appropriately, planning may also allow LWHs on lots as narrow as 7.3m (23′).
    • The LWH site must have access to an open lane.
    • A fire access path must be provided from the street along one of the sideyards to the entrance of the LWH. This path needs to have a clear width of 900mm.
    • The lot must be deep enough to allow for a both a LWH and a backyard open space.
    • The LWH and the main house must have a minimum separation distance of 4.9m (16′).

    If you’re a regular reader of this blog and wondering how Mackay Laneway House stacks up against the above criteria, here are the test results:

    • The lot is in a Residential R Zone, which permits a variety of different building types ranging from detached houses to fourplexes and apartment buildings.
    • The lot width is 7.62m, which exceeds the lower minimum dimension.
    • There is a lane.
    • The access path on the sideyard is 2.38m, but with a bay window projecting into it. So net, it’s closer to 2m, which still greatly exceeds the minimum clear width above.
    • The design includes for a generous backyard between the main house and the proposed LWH. 
    • The separation distance between the first floor of the main house and the proposed LWH is 7.5m (24′-7″). The main house steps back on the second floor, and so this distance would then increase. But in all cases, the minimum dimension is easily exceeded.

    If you’d like to learn more about laneway housing in Vancouver, click here.

  • New York, San Francisco, Toronto

    Yesterday it was announced (here, here, and here) that Toronto-based Top Hat has raised $22.5 million (USD) in Series-C funding. The round was led by New York-based Union Square Ventures.

    I am always excited to see Toronto-based startups doing well and I am particularly excited by this remark in USV’s blog announcement:

    “Also worth noting is that Toronto continues to impress us with its quality and diversity of companies. We now have five investments there, placing Toronto third as a location in the USV portfolio after New York and San Francisco.”

    Here is another quote from Fred Wilson’s blog:

    “Toronto is a great place for startups. In addition to five investments of ours that are HQ’d there, I know of at least one other USV portfolio company that has much of their engineering team in Toronto. The talent, mindset, and quality of the people in the Toronto/Waterloo tech/startup community is really top notch and we love investing there.”

    Go Toronto. 

    (Of course, Toronto really means Toronto-Waterloo. That’s the geography of the ecosystem.)

  • New York and Toronto population densities compared

    Today I came across this Reddit talking about how few census tracts there are in the United States with a population density greater than 150,000 people per square mile. 

    Basically, there’s a bunch in New York, one in San Francisco (Tenderloin), and one in Chicago that doesn’t really count because it’s an unusually small tract. Most other American cities don’t even come close.

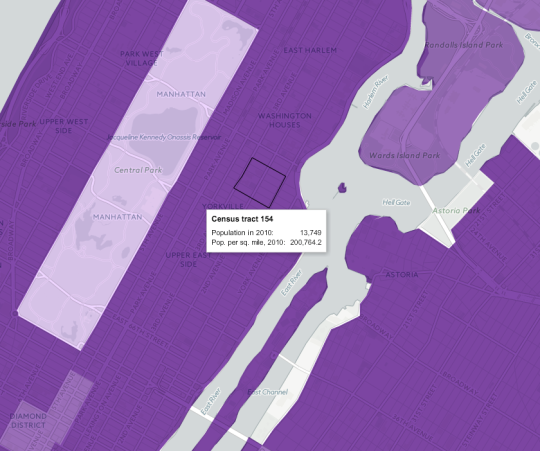
    Looking at this New York Times mapping of the 2010 US census data, it turns out there are neighborhoods in NYC that go well beyond 150,000 people per square mile. Here’s one census tract (#154) at just over 200,000 ppsm:

    If you convert 200,764 into the globally accepted standard for measuring distances and areas, you get approximately 77,515 people per square kilometer. Pretty dense.

    As a comparison, I thought I would see how this number stacks up against what is commonly referred to as the densest neighborhood in Canada: St. James Town. 

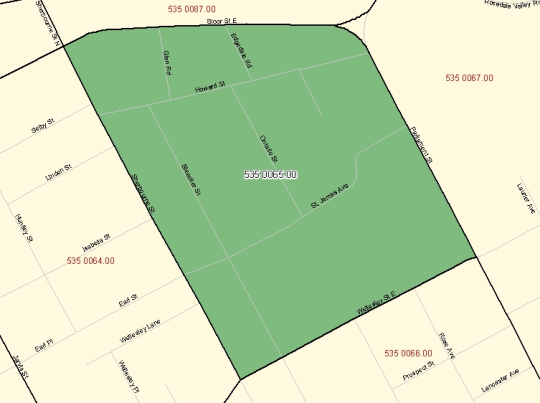
    If you pull up that geographic code in the 2011 Canadian census data (#5350065.00 in case you’re that nerdy), you’ll see a map boundary that looks like this:

    And you’ll also find a 2011 population density of approximately 60,915 people per square kilometer. Also pretty dense – though the population did decline from 2006.

    Now obviously St. Jamestown is only one example. The rest of the city is, by and large, far less dense. But maybe when our 2016 census data gets released next year, we’ll find that we’ve become even denser. I suspect we will.