Daily insights for city builders, delivered every morning at 6 AM ET. I’m Brandon Donnelly — a Toronto-based real estate developer and founder of Globizen. I’ve been writing here since 2013.

Month: May 2026

  • Ontario’s “new” new home HST rebate seems to be working

    May 31, 2026 · View original


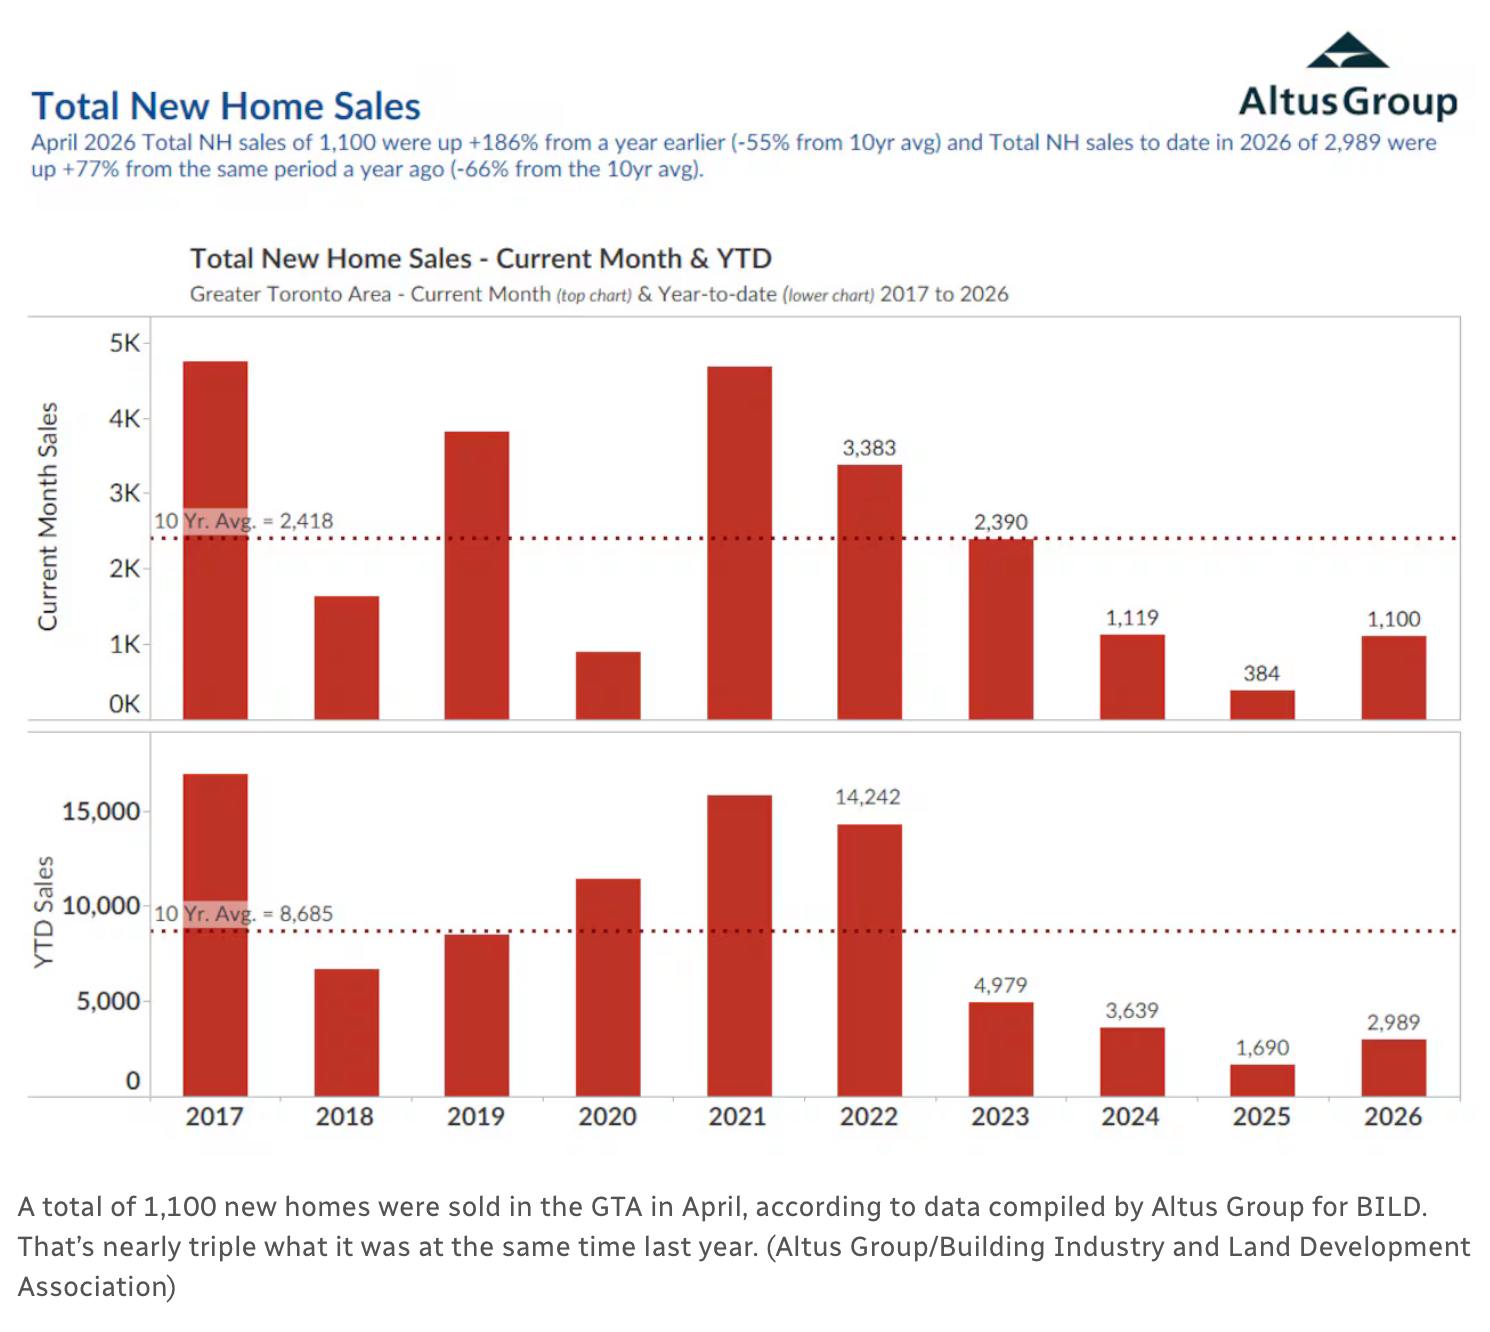
    According to recent data from Altus Group and BILD, a total of 1,100 new homes were sold across the GTA in April. This is a noticeable increase from 384 in April 2025, though it’s still below the 10-year average of 2,418.

    Importantly, this was the first month that new home sales could qualify for Ontario’s new HST rebate, and the data suggests that the program is starting to have a positive effect on the market.

    But let’s not forget that this policy is not yet fully enacted.

    The window for buyers is open and everyone fully expects the required federal legislation to pass, but that has not happened yet. The result is that there’s still friction around how exactly the rebate will be administered.

    As things become clearer, I suspect we will see an even greater uptick in new home sales.


    Cover photo by Patrick Tomasso on Unsplash

    Chart via the CBC

  • 1 Kid, 1 Condo

    May 30, 2026 · View original


    The countdown is on. Our baby girl will be arriving at some point in the near future (we’re on her schedule) and so I think you should all expect to see more baby-in-an-urban-condo-related content.

    If you’re familiar with planning in Toronto, you’ll know that there are specific urban design guidelines related to children in vertical communities. (The final 2020 report can be found here.) They include neighbourhood guidelines, building guidelines, and specific unit guidelines, which include, among other things, recommendations for “ideal” family units.

    Why all of this matters is that approximately 95% of the new housing built in the City of Toronto today is now multi-unit housing (buildings greater than 5 storeys). Our future is vertical. So even though only about 32% of all households with children currently live in a multi-unit community (Toronto proper figure), it’s not hard to imagine this number going up. Either that, or we’re left with more sprawl, plummeting birthrates, and a bleak, childless city.

    As I was writing this post, I asked my wife what she thought would be the biggest benefits and drawbacks of having a kid in a condo. On the positive side she said she likes the safety of being in a building and our nice walkable, urban community. On the negative side, her mind went straight to stroller management and general space constraints.

    Indeed, when you visit friends and they have a driveway big enough to park an aircraft, a basement with a climbing gym for the kids, and bedrooms bigger than many urban apartments, it’s hard not to think to yourself, “Yeah, you know what, maybe this would be nice!”

    Interestingly enough, neither of us thought once about elevators. We live in a mid-rise building and never have to wait more than a few seconds. Now onto stroller management. Right now, it’s sitting folded in our front hall closet:

    It fits nicely, but it’s obviously going to be work to constantly fold it up and put it away. We’ll see how that goes. We are, however, fortunate in that we have two floors in our place, so it is house-like in that there’s greater physical and acoustic separation between the main living areas and the bedrooms. We also have a good-sized outdoor space, but a backyard with grass it is not.

    Back in the day, I used to enjoy following a blog out of Vancouver called 5 Kids, 1 Condo. Adrian Crook stopped updating in 2020 (presumably his kids grew up), but it was a good example that home is not a housing typology; it’s both a physical and psychological space where humans (hopefully) feel a sense of comfort and belonging.

    As our urban home grows, I’m looking forward to sharing what we learn along the way on this blog. It feels extremely relevant to the work that many of us do as city builders.

  • Beautiful urbanism is not a housing affordability strategy

    May 29, 2026 · View original


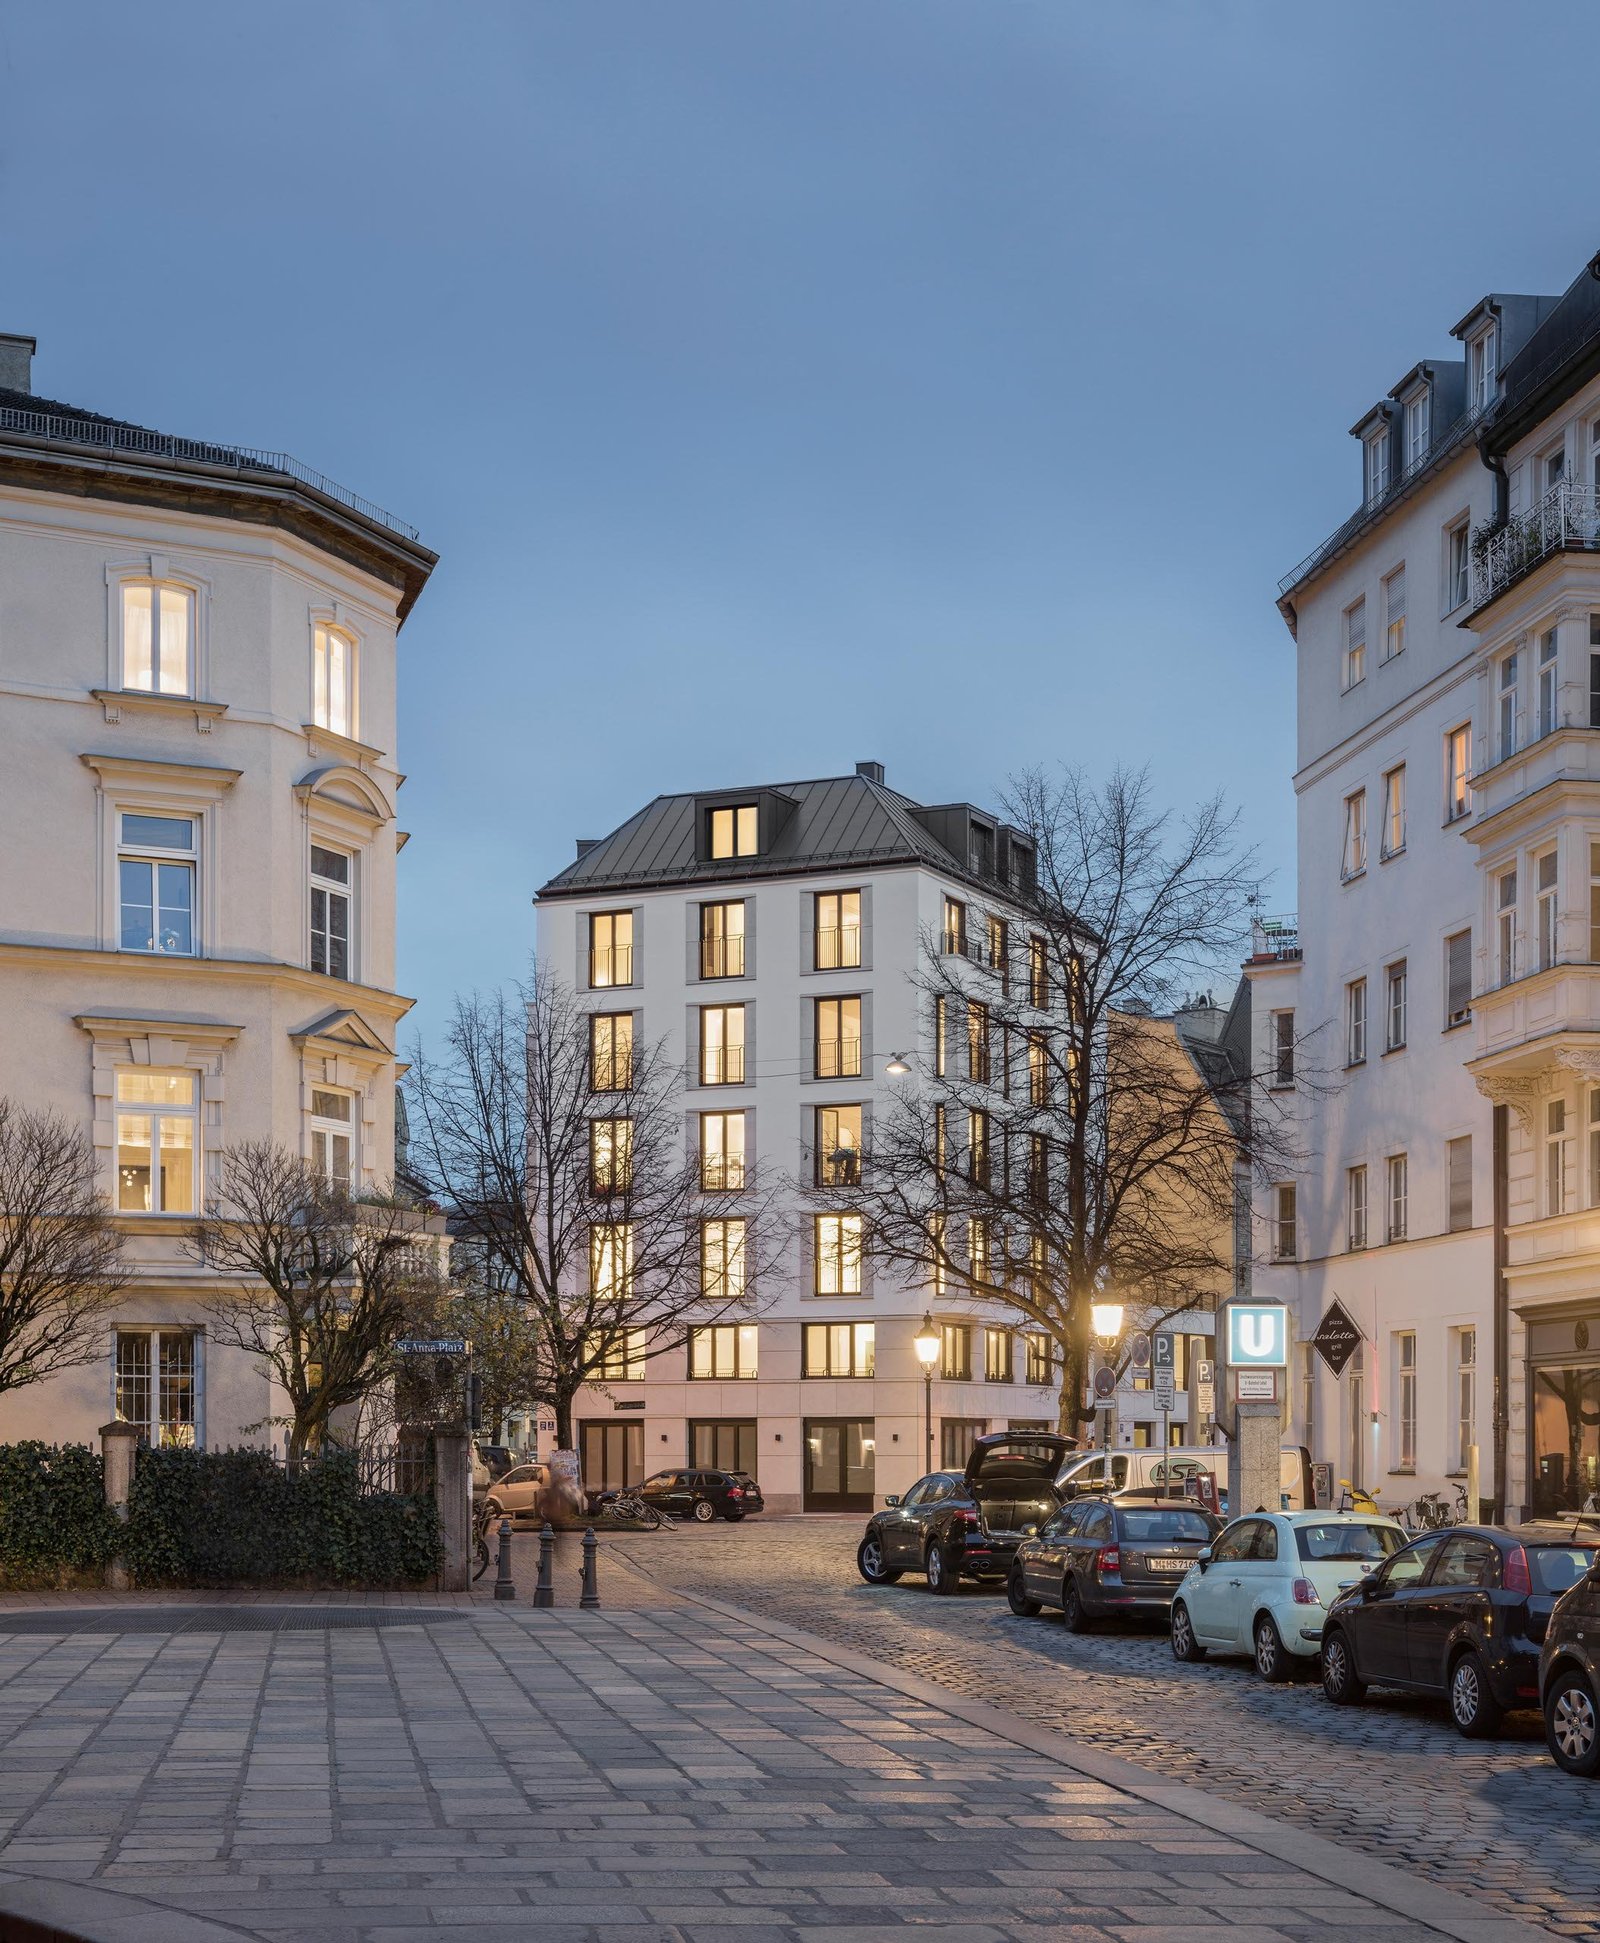
    I recently tweeted this photo of St.-Anna-Strasse 16 in Munich (the building in the centre) along with a pithy comment about how I really like the look and scale of this neighbourhood. It’s beautiful, right? The tweet blew up and, as of right now, it has over 170k views. Pithy comments with pretty pictures always seem to outperform anything more nuanced that I might share. But in the spirit of yesterday’s post about housing affordability, let’s dig a little deeper.

    Developed by Legat Living and designed by Munich-based Landau + Kindelbacher, the mixed-use building is located in Lehel, which I understand is one of the most desirable areas in the city. It’s about 960 m2 and has five apartments (ranging from 140 to 200 m2) and one commercial unit at grade. Each home has direct elevator access and its own landing. To give you a better sense of the suites, here’s a photo of the rear elevation:

    What is clear is that this is a luxury, boutique offering. Based on a cursory review of the Munich real estate market, Lehel seems to be the most expensive neighbourhood, with an average apartment price of €12,468.33/m2. If we apply this average to their smallest apartment, that’s a starting price of €1,745,566. But presumably, this isn’t your average building. It was completed in 2020, so I’m going to assume these homes sold for meaningfully more.

    All of this leaves us with a really beautiful building and a nice urban scale, but certainly not the secret to a magically affordable city. This is not a criticism of the project by any means. I stand by my original tweet. It’s a beautiful development, but it does demonstrate some of the affordability challenges of building urban. Legalizing urban infill housing is not a silver bullet in and of itself.


    Photos via Landau + Kindelbacher

  • Is Canadian urbanism failing?

    May 28, 2026 · View original


    So:

    > Urbanism is failing in Canada, and a two-decade-long effort to reduce sprawl through policies such as urban growth boundaries has caused sprawl to accelerate due to the leapfrogging effect, in which development is pushed out to smaller communities without transit, leaving middle-class workers facing long daily commutes back to the metros where their jobs are located.

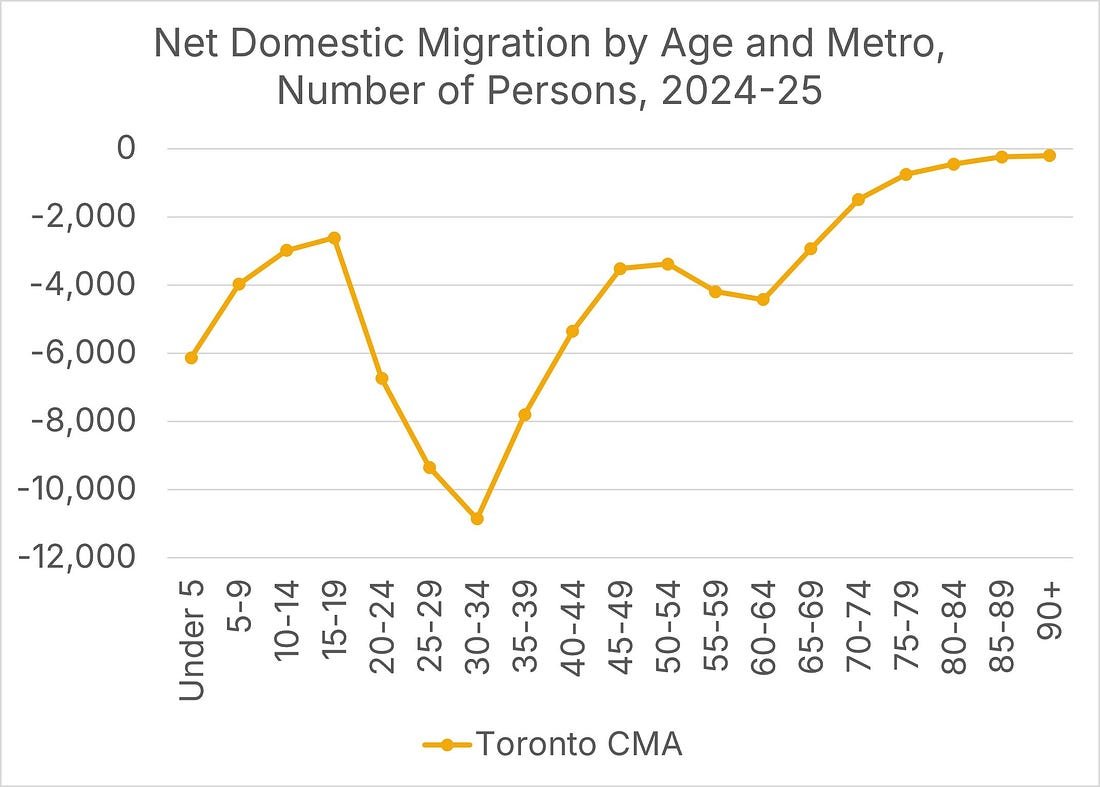
    Indeed, the data show that net migration out of Canada’s largest metro areas is particularly strong among those early in their careers (late-20s to mid-30s). In the words of Mike Moffatt from the Missing Middle Initiative, “Canadians are choosing affordability over density.”

    This statement highlights the inherent tension between dense, walkable communities and car-oriented sprawl. The former may be nice, better for the environment, and advantageous for agglomeration economies, but the kind of built form that comes along with it tends to be fundamentally more expensive to build.

    Now, we can get into a debate about transportation costs, environmental costs, and how people tend to discount the value of their time relative to direct costs, but regardless, it is clear that affordability is dictating where people move.

    So Moffatt is not wrong in stating that the communities that we urbanists often like to celebrate as “success stories” are, in fact, the ones that many young people are leaving. And in my view, this highlights a missing success criterion. Great design and urbanism are all well and good but, how attainable is the resulting housing?

    The most promising solution right now appears to be happening on the multiplex front. It’s the most cost-effective way to build multi-unit homes, and I think our goal should be to apply this same general approach — as-of-right, cost-effective builds — to larger and larger housing typologies.

    If we can unlock the same market enthusiasm for six-storey wood-framed builds, then I think we’ll really be on to something.


    Cover photo by Craig Cook on Unsplash

    Chart from the Missing Middle Initiative

  • The geographic inversion of New York’s subway ridership recovery

    May 27, 2026 · View original


    New York City is the most urban city in America, with the largest subway network by far, and yet, even here, ridership levels have yet to recover to their pre-pandemic levels. Recent data shows subway ridership hovering between 70% and 80% of 2019 levels, and the MTA anticipates that it will remain “at about that level through 2029.”

    The obvious explanation is that office workers continue to work from home on occasion, and that’s certainly a significant part of the story here. But it doesn’t appear to be the entire story.

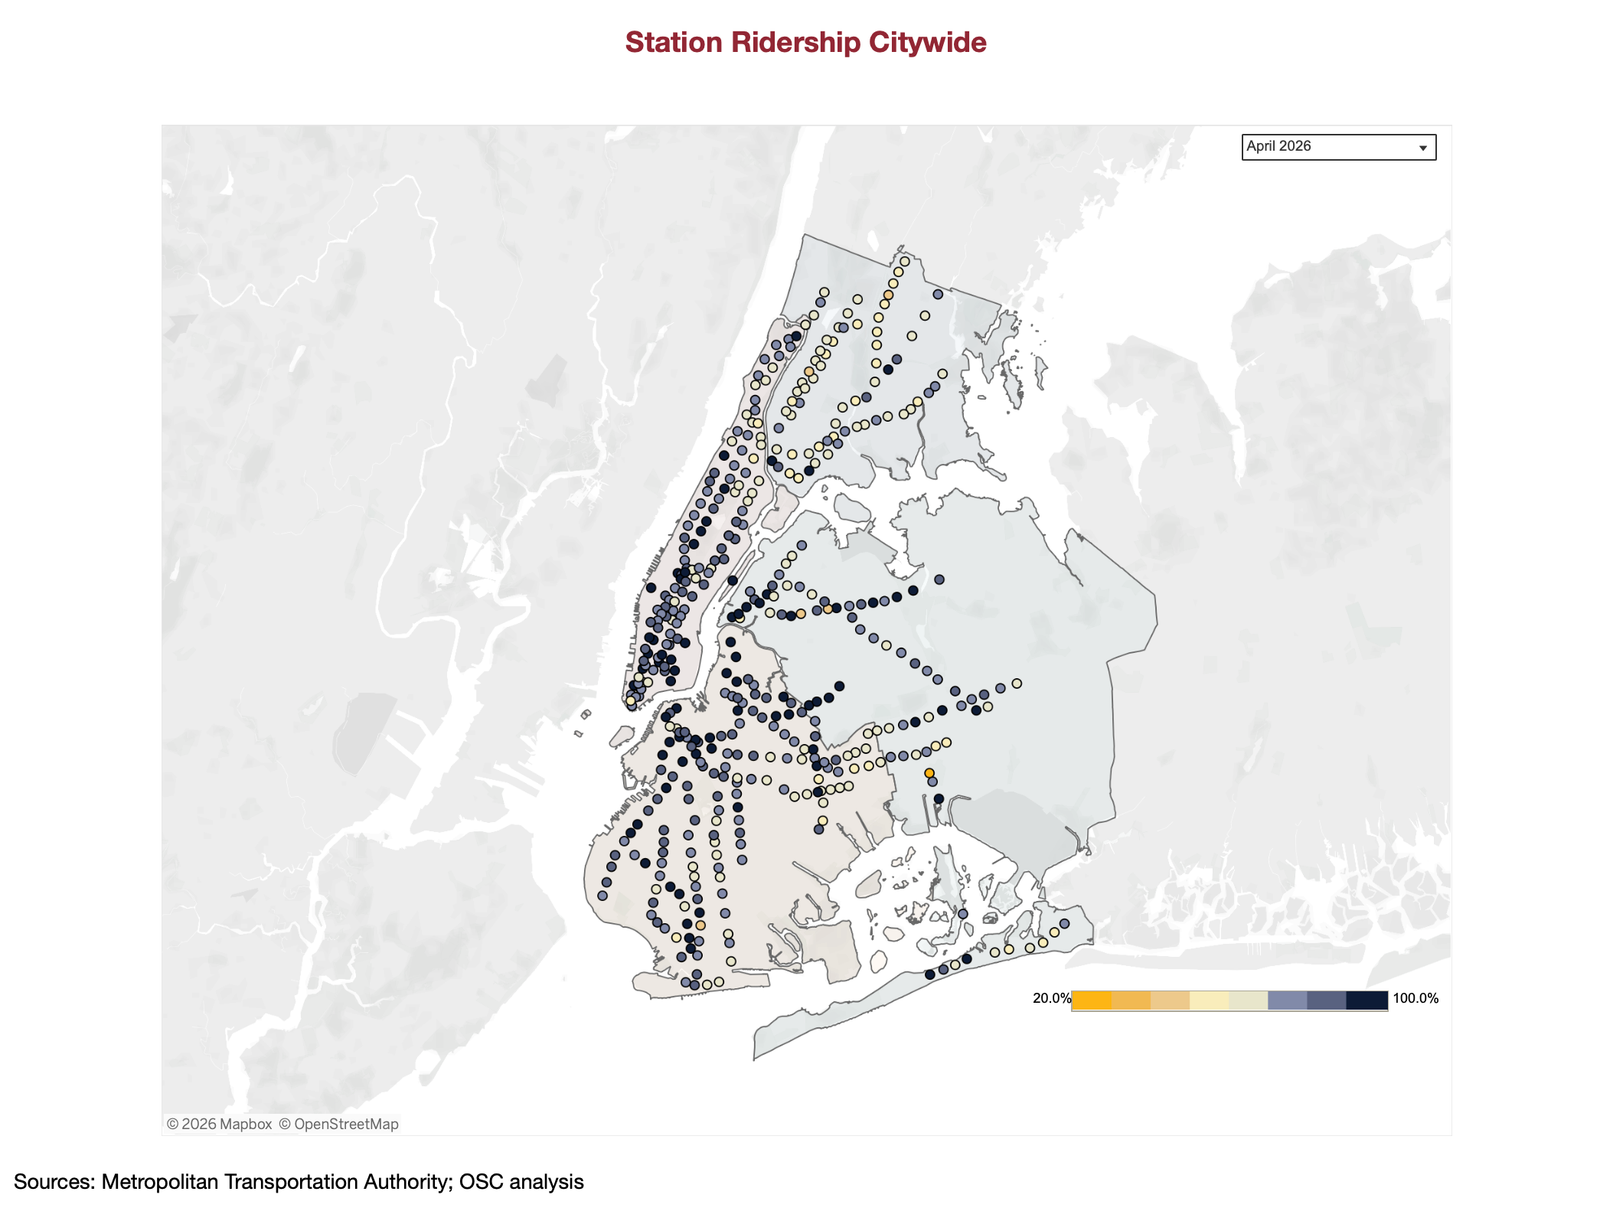
    For example, looking at station ridership recovery across the city, there visually appears to be a geographic correlation with areas in Upper Manhattan, the Bronx, and the outer boroughs in general not recovering to the same extent as Manhattan.

    In the early days of the pandemic, ridership levels were mostly correlated with median household incomes. Ridership remained higher in the outer boroughs, while residents in wealthier neighbourhoods simply worked from home. Since then, that correlation has weakened and the geography has inverted.

    This suggests to me that in addition to WFH, there has also been a structural mobility shift for many households. We know that car registrations in NYC spiked during the pandemic, and presumably that means some new mobility habits were formed.


    Cover photo by Igor Wang on Unsplash

    Chart from Subway Recovery Tracker

  • Toronto Tech Week

    May 26, 2026 · View original


    This week, May 25 to 29, is Toronto Tech Week. If you’d like to check out the event calendar, click here.

    What’s interesting about how the week is structured is that it’s not a traditional conference. It’s more of a decentralized, open platform where anyone can join or host an in-person event, as long as it serves the shared goal of showcasing Toronto as a city of builders. It feels very tech-appropriate, and it means you can tailor the week to your interests.

    I’m laser-focused on my own building right now (otherwise I’d be all over the it), but I am enjoying following it online and seeing the energy that it brings to our city. Toronto is one of the greatest cities in the world, and there’s no shortage of talented entrepreneurs working to build the future right here.

    What we do need to be better at, though, is celebrating the people taking risks and providing them with the capital and resources to make wild and crazy bets. But I’m sure that’s all happening right now at Tech Week. Go Toronto!

  • Customers, costs, and typologies in the next housing cycle

    May 25, 2026 · View original


    Because of how long it takes to build a building, real estate markets almost always overbuild at the top, and underbuild at the bottom (see yesterday’s post about the pig in the python). In a theoretically perfect economic model, supply would adapt instantly to changes in demand. But in the real world of development, this adaptation can take 5 to 10 years.

    At the same time, it’s not just about the quantity of real estate being delivered at any given time; it’s also a question of what kind of real estate. We talk a lot around here about this moment in time being a healthy reset for Toronto’s housing market (and other markets). But what exactly are we resetting? I find it helpful to think of it in terms of three prongs.

    First, there’s customer type. Who will be the buyers and tenants during the next cycle and what will they be looking for? For instance, when it comes to pre-construction condominiums, to what extent will individual investors factor in like they did during the last cycle? Many think they will play a much smaller role.

    Second, there’s the cost structure. The cost of building is changing, and hopefully we will see continued efforts to make housing more cost-effective to deliver. And third, there’s a question of building typology. As the demand profile changes and as costs evolve, it is naturally going to have an impact on the kind of buildings that get built.

    My gut is that we will see more housing geared toward end-users in medium-density builds, but only time will tell.


    Cover photo by Lennon Kong on Unsplash

  • Pig in the python

    May 24, 2026 · View original


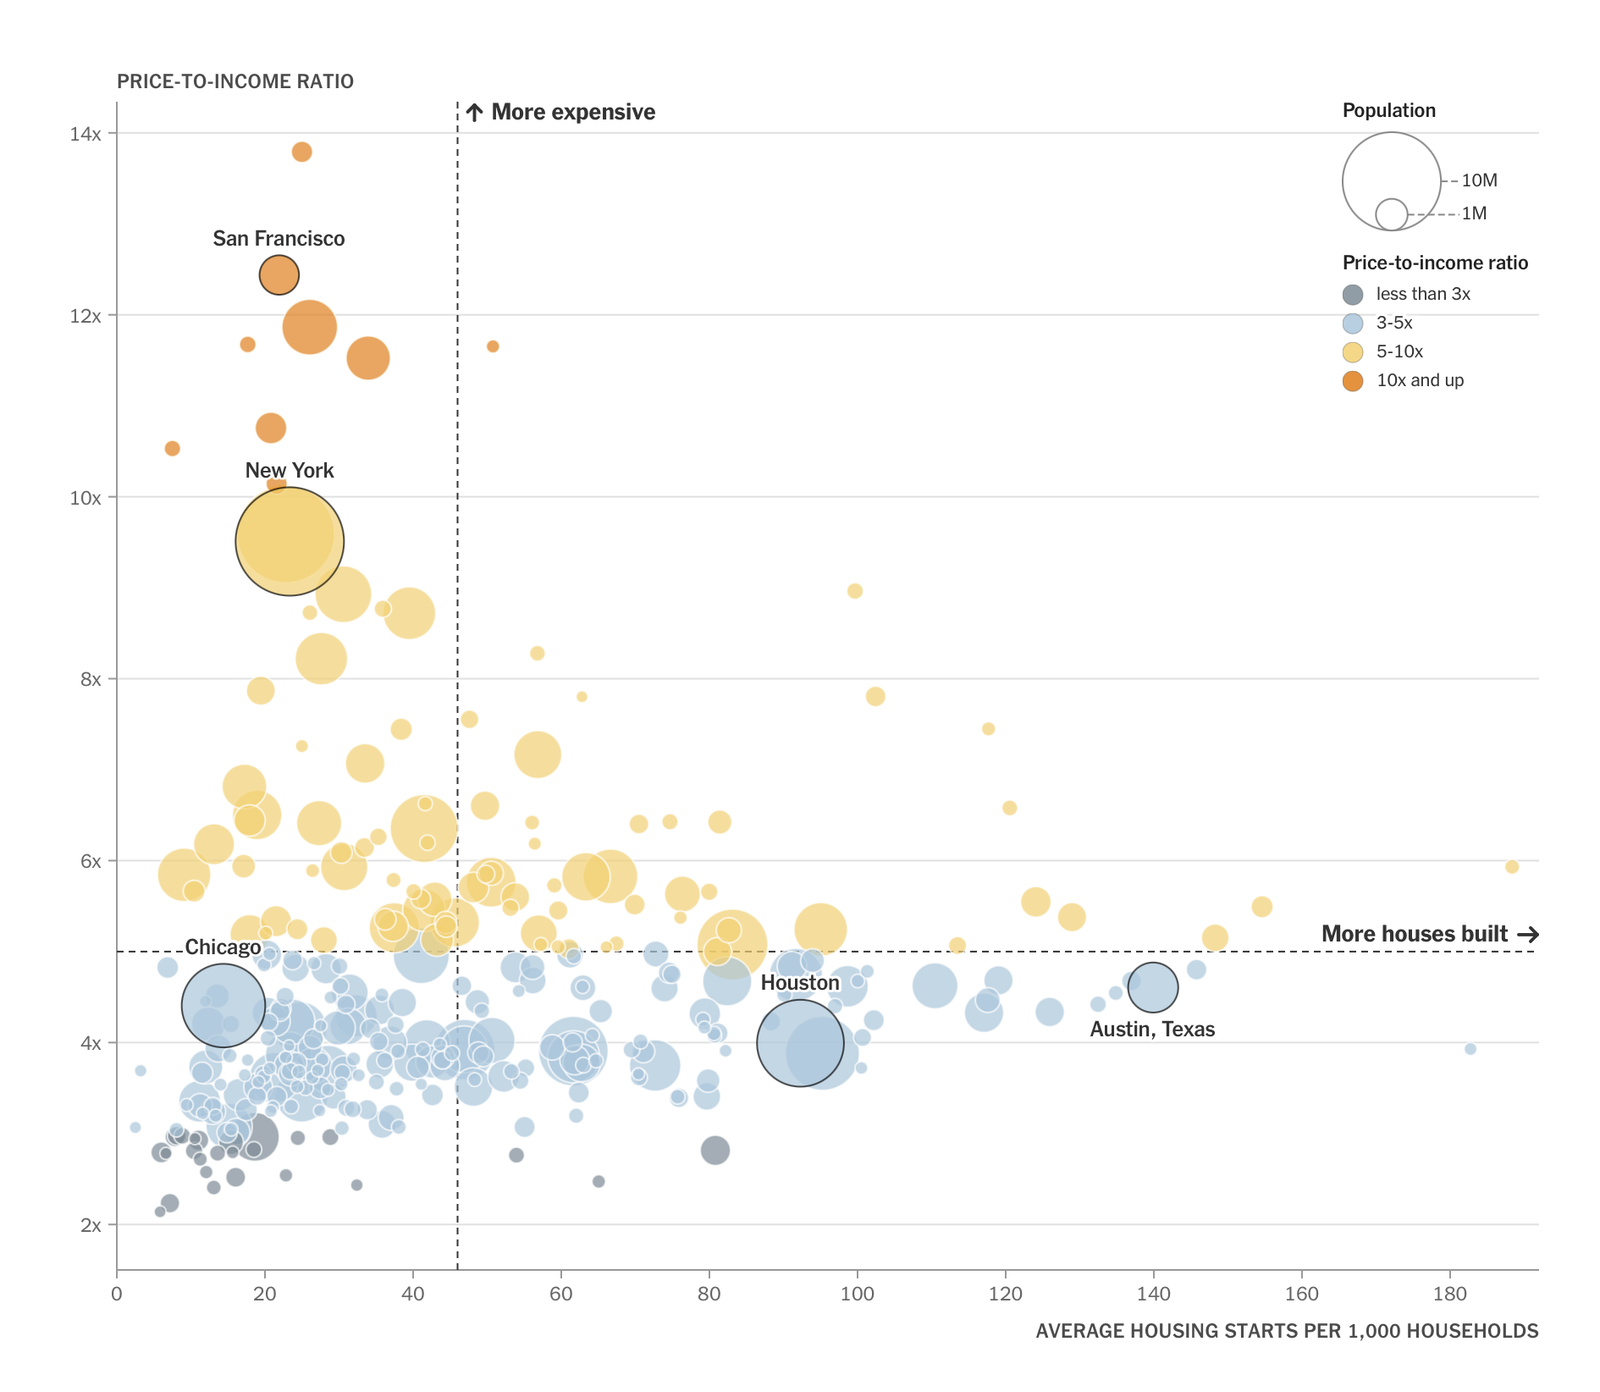
    Here is a chart that we have all seen many times before. This one is from a recent New York Times opinion piece called, “America Needs to Build More Housing” and it shows the relationship between home prices (the price-to-income ratio) and houses built (average housing starts per 1,000 households). In this scatter chart, the four quadrants are as follows:

    – Cities that don’t build a lot of housing and are expensive (San Francisco) – Cities that don’t build a lot of housing but are still relatively affordable (Chicago) – Cities that build a lot of housing and are affordable (Austin) – Cities that build a lot of housing but are still relatively expensive (Hilton Head Island)

    This last quadrant has the fewest number of data points and a number of the locations are resort or second-home destinations, which have their own unique market dynamics. Similarly, the lower-supply cities, like Chicago and Detroit, have managed to maintain some degree of affordability by virtue of the fact that their population and economic demand haven’t grown as quickly as in other cities.

    But generally speaking, the correlation is as one would expect: more homes equals lower prices. It is, however, worth pointing out that not all homes are created equal. The cost and time required to build a low-rise, wood-framed house in the suburbs is not the same as building a high-density, reinforced-concrete tower in the city.

    Still, we know that all forms of supply ultimately improve affordability in a market. With this in mind, how might one describe Toronto today? We’ve been told we’re in the midst of a housing crisis, and yet there are lots of available homes on the market, both to buy and rent. Indeed, it’s a buyer’s and tenant’s market. So what’s going on?

    Well, it’s important to keep in mind that a chart like this represents a long-term historical average and that building new housing generally takes a long time (too long, I might add). Right now, we could describe the Toronto housing market like the proverbial “pig in a python.”

    The market is in the midst of absorbing a huge influx of completed supply and, as our chart suggests, this is having a deflationary effect on home prices in the short term. However, once this pig gets digested, there’s absolutely nothing next in the pipeline to digest, and according to basic economics, we know exactly what that will mean for the market.


    Cover photo by Artem Labunsky on Unsplash

    Chart via the New York Times

  • Evaluating rent controls in a fully built out city

    May 23, 2026 · View original


    Paris has residential rent controls. They were put in place on a test basis starting on July 1, 2019 and, broadly speaking, they limit what rents can be charged on a per-square-metre basis according to the neighbourhood, rental type (unfurnished or furnished), number of bedrooms, and the period of construction.

    Since then, there have been various studies examining their effects. Here’s a recent one by Apur. In this report, the authors conclude that over the six-year period, the controls moderated rents by -5% compared to where they would have been had they been unfettered. Importantly, they also conclude that the rent control policies have had no meaningful impact on the city’s rental supply.

    However, it’s important to point out that “rental supply” means the supply of rental homes in buildings already built. The report does not talk about new construction. And as I understand it, the rent controls are more flexible for new construction. There’s also a complément de loyer (rent supplement) that developers and landlords can charge for new builds that are energy efficient and offer exceptional comfort or amenities.

    Regardless of the specifics, it’s interesting to think about rent controls in a city like Paris. The central part of the region, Paris proper, is already built out and constructs very little new housing each year. By some estimates, the net amount (factoring in existing units being demolished) is only something like 1,500 to 2,000 units annually. And if you consider new market-rate units, it’s an even smaller number.

    From a policy standpoint, this presumably means you’re a lot less concerned about new housing supply — at least in the central neighbourhoods — and more concerned about the overall affordability of the existing supply.


    Cover photo by Salomé Watel on Unsplash

  • Introducing Propeur

    May 22, 2026 · View original


    I sat next to a software developer at my friend’s wedding a few weeks ago, and I figured I would ask him the obvious question: “What percentage of the code that you write today is now being done through AI?” At first he was reticent to answer, but eventually he told me that it’s, like, the majority. That sounded right.

    I then decided to pull out my phone and force upon him something that I’ve been vibe coding. I’m sure he found this boring, but his response was interesting nonetheless. He said, “This is the future of software. It is going to be both highly personalized and built by actual users. And because of this, it’s going to be better software.” In other words, accountants will build what they need, photographers will build what they need, and real estate developers will build what they need.

    What I showed him was Propeur.com, a residential property management platform tailored toward small Ontario landlords that I have been building for my own purposes and as a tool that Globizen can use for its infill rental projects. It’s still early days and there are bugs to work out, but here’s what you can do so far:

    – Add your rental properties and receive a Monday morning email with a summary of what happened over the last week and what’s on the horizon. – Manage tenants and rental units, including move-in and move-out dates, and all of the critical dates surrounding rental increases. – Automatically track current debt balances and maturity dates. – Store all relevant property documents, and have them automatically labeled and categorized in the appropriate folders. – Create a public property profile for both on-market and off-market units (here’s an example). – Sync bank accounts and categorize expenses by property and unit. – Export transactions to a CSV, filtered by property, date, and revenue/expense category. – Log maintenance requests and automatically email them out to a contractor or maintenance person (the next step will likely be some kind of tenant portal). – Export tax reports at the end of the year.

    Again, it’s still very much a preliminary beta release and there are certainly bugs. But already, I find myself using it almost daily. If you’re a small landlord in Ontario and would like to give it a spin, you can sign up here. I’d love to get your feedback on the platform. And if it’s something you find useful, please feel free to drop me a line and I’ll buy you a coffee.


    Cover photo by Alexander Andrews on Unsplash