Daily insights for city builders, delivered every morning at 6 AM ET. I’m Brandon Donnelly — a Toronto-based real estate developer and founder of Globizen. I’ve been writing here since 2013.

Month: December 2025

  • The in-between space

    December 31, 2025 · View original


    I’m a big fan of the period between Christmas and when most of the world gets back to work in the New Year. It’s the only time of year that I know of where the email firehose shuts off, the social permission to do “nothing” turns on, and the world generally quiets down.

    I know that not everyone gets this time off. We all have different jobs. Earlier in my career, I used to always work these days between Christmas and the New Year because I couldn’t spare the vacation days. But if you are fortunate enough to have it off, it’s a unique time of the year.

    It’s a time for family and friends, and a good time for vacations that aren’t riddled with email and work anxiety. But it’s also a time that creates space for the mind to wander, and for me, it gives me a creative burst of energy.

    I’ve been trying to think of the best way to describe this feeling, and it truly feels like “mental space.” When work is “on,” it simply crowds out everything else. But a more accurate neuroscientific definition would be that we’re simply engaging different parts of our brains.

    Supposedly, when the mind is given “space” to wander — which is also referred to as wakeful rest — we engage a system in our brain known as the Default Mode Network. This network is thought to serve several different functions, including forming the basis for the self, thinking about others, remembering past events, and imagining possible future events. Generally, this makes it very good at connecting the dots, so to speak.

    The counterpart network is our Executive Control Network. This part of our brain is most active during focused, demanding, and goal-oriented tasks — so work.

    These two networks are also thought to be inversely correlated, meaning when one activates, the other often shuts down. But not always and not entirely. A 2018 research article by Roger E. Beaty et al. found that highly creative people have a unique brain “wiring” that allows these different neural networks to work together, rather than in opposition.

    What this suggests to me, as a cognitive neuroscience layperson, is that engaging our different brain networks is good for us. Sometimes it’s good to turn down executive control and give some space to default mode.

    And I find that this time of year is a perfect time to do just that.

    Cover photo by Milad Fakurian on Unsplash
  • Why rents crashed in Austin but not Miami

    December 30, 2025 · View original


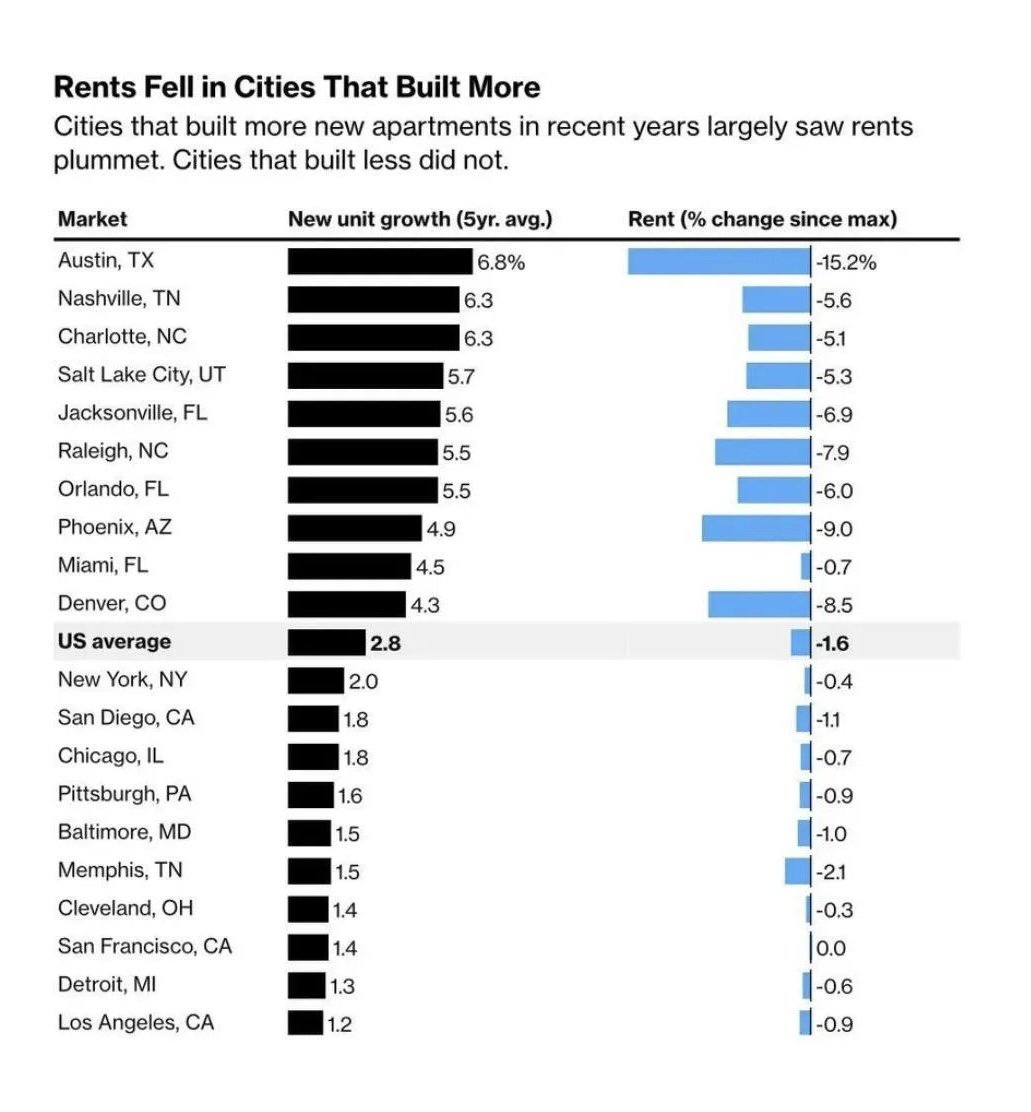
    One of the big housing stories of this year was that Austin has built a lot of new apartments and it is now causing rents to fall precipitously — by as much as 22%. The market is working.

    But as we also talk about on this blog, the benefits of new “luxury” housing don’t just apply to those who can afford it. Since real estate development happens on the margin — in other words, it’s based on the feasibility of the next unit of housing supply, not an average for the market — new market-rate housing typically needs to cater to the top end of the market. Otherwise, it wouldn’t be economically feasible to build it.

    However, study after study also shows that the delivery of any new housing in a city broadly tempers rents, including in a city’s oldest housing stock. This is true in virtually all cities:

    The above chart is from this recent Bloomberg article, talking about how “luxury apartments are bringing rents down.” But if you look closely, there is one city on this chart that appears to be an outlier: Miami.

    Despite adding a respectable number of homes, rents have not fallen as much as you might expect given the figures for the other cities on this list. The intuitive explanation is likely that Miami is in the midst of experiencing an extraordinary wealth transfer.

    For the five-year period through to 2022, it was estimated that some 30,000 New Yorkers with combined annual incomes of $9.2 billion moved to Miami-Dade and Palm Beach counties. It’s also an important capital safe haven for Latin America.

    I vividly remember looking at condo listings in Miami in 2008 and thinking, “Damn, this is cheap!” I even tried to find a job there after grad school, but at that time, it was no place for a new real estate developer. My best bet would have been something in loan workouts.

    Who could have predicted such an incredible transformation? It isn’t the third most important global city in the US according to the numbers, but it certainly has a lot of momentum right now. In this instance, new supply does not appear to be more than offsetting demand.

    Cover photo by Valeriia Neganova on Unsplash

  • The world has a new biggest city

    The UN’s 2025 World Urbanization Prospects report has reshuffled the global rankings, placing Jakarta at the top

    December 29, 2025 · View original


    It’s not always as straightforward as it may seem to measure the size of a city or urban region.

    There’s the problem of which urban boundary to use. And then once you’ve landed on that, there’s the additional problem of estimating how many people live within it. This can be particularly challenging when it comes to informal settlements, where there isn’t reliable population data.

    The most common approach is to use the continuous built-up area as the urban agglomeration, as opposed to any sort of “city proper” boundaries. And this is exactly what the United Nations has done in its latest World Urbanization Prospects report.

    Here, they have fundamentally revised their measurement methodology by using a new, so-called harmonized geospatial approach. If you’d like to nerd out on the specifics, you can do that here.

    But one of the key takeaways is that this new methodology has resulted in a reordering of the world’s largest urban agglomerations. At the top is now Jakarta, followed by Dhaka:

    Previously, Tokyo was thought to be the world’s most populous megacity, but it has dropped down to 3rd in this new report. And by 2050, it is forecasted to drop even further to 7th place:

    As we spoke about yesterday, the world’s economic center of gravity is rapidly shifting toward Asia. And that shows up in these charts.

    I have a strong desire to visit the largest cities in the world. It’s fascinating to see how such large urban clusters manage to organize themselves. There are always systems that naturally emerge to make things work, even if it feels chaotic on the surface.

    I’ve only been to 3 cities from the 2025 chart, so I have my work cut out for me.

    Cover photo by Rifki Kurniawan on Unsplash

  • Sticky cities, shifting world

    December 28, 2025 · View original


    Canadian geographer Mario Polèse’s book, The Wealth and Poverty of Regions: Why Cities Matter, is not new. It was originally published in 2010. But it’s perhaps a good follow-up to yesterday’s post about the untethering of wealth. Here’s an excerpt from a review of the book by Jeb Brugmann:

    > All cities, Polèse explains, share the same basic economic causes and effects. These are economies of localization (i.e., locating activities close together) and of urbanization (i.e., clustering lots of diverse activities together at scale). Polèse shows how these urban economies—usefully distinguished and defined in detail as economies of scale, proximity, diversity and concentration—combine with unique natural features and resource endowments, technology and infrastructure investments, national boundaries and market controls, and historical events to create quintessentially local and unique places. Every time he explains the status of another place—New York, London, Chicago, Paris, Montreal, the northern Mexico border, the North American west coast—he demonstrates again how the source code of geography combines with specific local and historical conditions to create a momentum of wealth or poverty.

    The rich may have the means to tax-optimize through physical mobility, but the draw to established urban clusters remains strong, which is why it can be a challenge to stay away from them for more than 183 days. There is a “stickiness” to established cities that is the result of momentum and compounding over centuries.

    Still, nothing is guaranteed, and there’s only so much that can be done if you’re swimming against a global landscape that is shifting away from you. Geography does matter. And today, the world’s economic center of gravity is rapidly shifting toward Asia. This is good for some cities and bad for others.

    Cover photo by Zhu Hongzhi on Unsplash

  • The great untethering of wealth

    December 27, 2025 · View original


    One of the themes we cover on this blog is the importance of place in a world where people are becoming increasingly untethered. While I’m a firm believer that great local places have enduring value, this does not mean that technology isn’t driving greater fluidity in the way people live, work, play, and optimize their taxes.

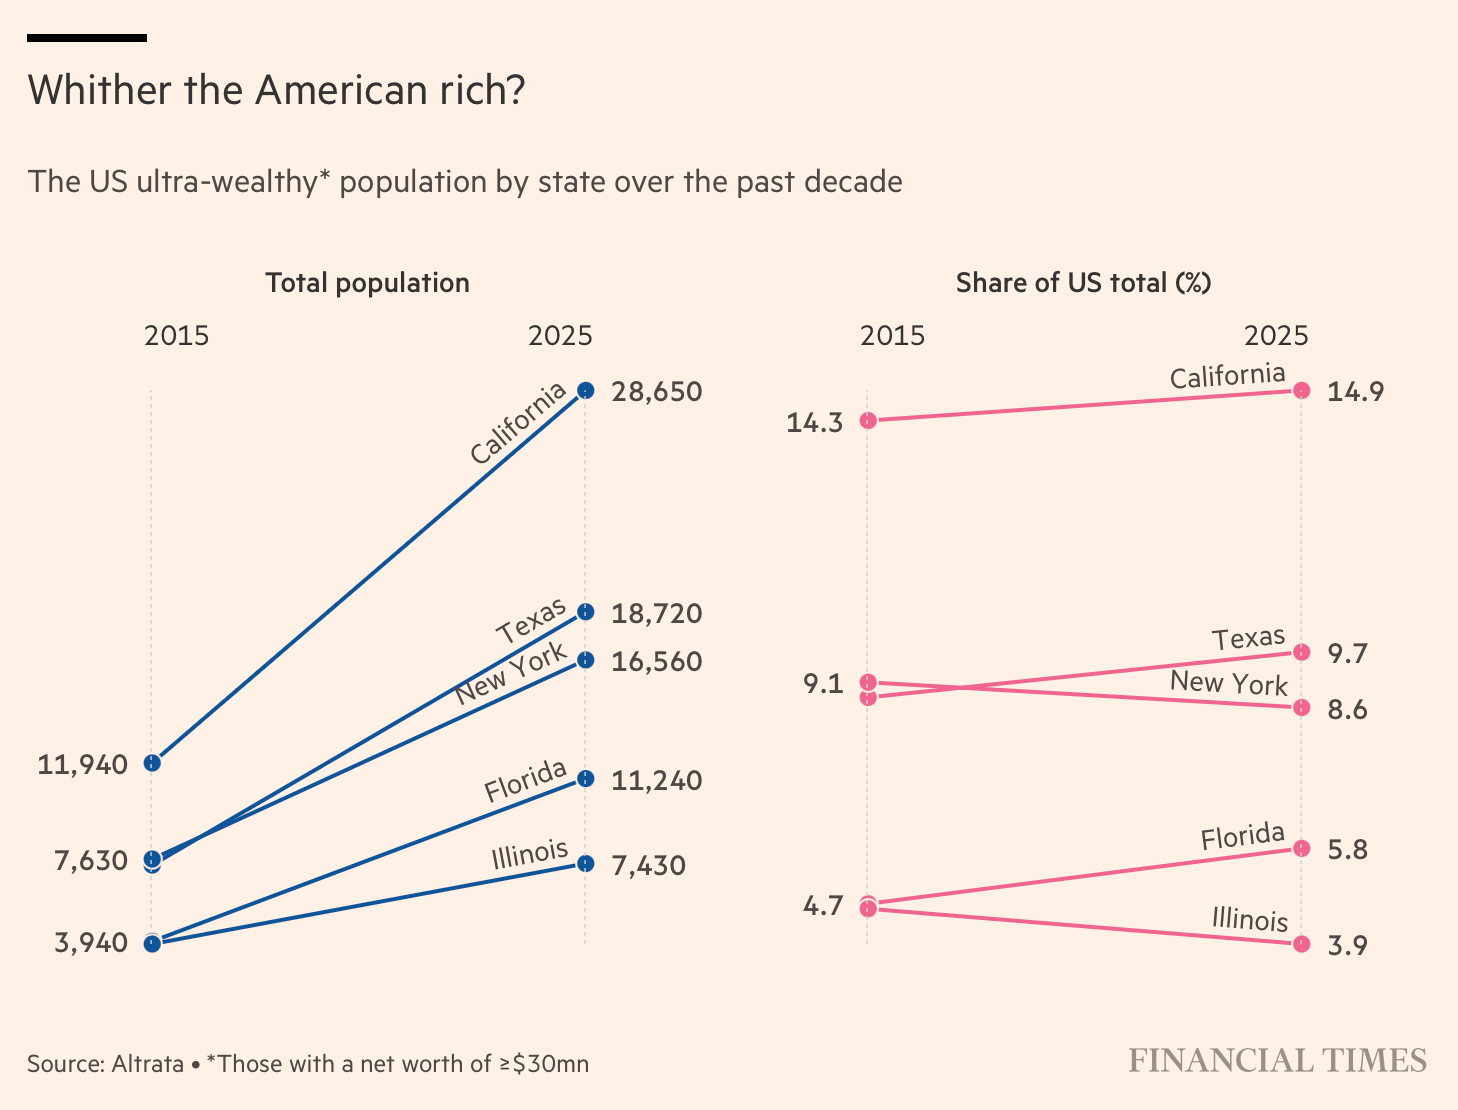
    Over the last decade, the population of ultra-wealthy Americans (those with a net worth greater than or equal to $30 million) has risen noticeably in two states: Texas and Florida. California, a high-tax state, still dominates; however, Texas has overtaken New York, and Florida has overtaken Illinois. Notably, both Texas and Florida have no state income tax — they also have warmer weather than New York and Illinois.

    As we have talked about before, there’s a longstanding migration trend in the US toward sun, urban sprawl, and lower taxes. But it’s not always as clear-cut as a rich person fully relocating to a lower-tax jurisdiction and completely severing ties. The enduring value of place means that many people still travel back and forth to meet whatever personal or professional obligations they might have.

    And today, there are apps, such as TaxBird, that will meticulously track the number of days you spend (or your phone spends) in each jurisdiction to ensure you don’t cross any important residency thresholds.

    The global standard is the 183-day rule (or roughly half a year). In many or most cases, if you are physically present in a place for more than 50% of the year, you are automatically considered a resident for tax purposes. But it’s not always this simple, so check with your tax advisor. Regardless, the untethering of life and work is surely allowing more people to tax-optimize in this way.

    None of this is surprising.

    As Charlie Munger used to say, “Show me the incentive, and I’ll show you the outcome.” But now we need to think about the longer-term ramifications for colder, higher-tax jurisdictions as capital and tax revenue continue to be siphoned off, not only to Texas and Florida, but to Dubai, Singapore, Hong Kong, Switzerland, Monaco and other places.

    Cover photo by Colin Lloyd on Unsplash

  • Where Americans flew in 2025

    The top United Airlines international destinations by US state

    December 26, 2025 · View original


    Whether you live in North Dakota or Texas, there’s a reasonable chance that when you travel internationally, you enjoy going to Cancun. Or perhaps you fly into Cancun and then go to a neighboring town like Tulum. United Airlines just released the following map showing the most-booked international destinations from every state for passengers traveling on United Airlines between January and October 2025. The top three destinations are London, Cancun, and Tokyo:

    First, it’s important to keep in mind that this data only includes people flying on United; it doesn’t capture all international air travel. Second, maps like this are necessarily going to be influenced by an airline’s biggest hubs. In the case of United, its hub-and-spoke model relies on major airports and routes like San Francisco-Tokyo and Newark-Heathrow.

    Still, specific destinations appear on this map for a reason. Cancun is the number one “vacation” airport for Americans, which is an incredible success story, because it wasn’t a place until the 1970s. Prior to Cancun, Acapulco was Mexico’s top resort destination, but it was becoming constrained, and the government needed a replacement conduit for extracting US dollars from the American middle class. So, they developed Cancun.

    The popularity of Tokyo is likely partly a result of a weaker yen, in addition to being an important Asian hub and an incredible place to visit. According to the Japan National Tourism Organization (JNTO), over 2.7 million Americans visited the country in 2024 — a 33% year-over-year increase and a 58% increase compared to 2019.

    The country also saw 3.7 million international visitors in January 2025, which is the highest ever for a single month. Countries like the US and Canada also set all-time records for January arrivals. Part of this, I’m sure, has to do with Japan’s legendary “Japow.” I was part of this year’s cohort, and I’ve never seen so much snow as I did on the island of Hokkaido.

    There are also very specific one-off relationships that appear on United’s map. The number one destination for the state of Arizona is, for example, Taipei. And this is being driven by a semiconductor boom, specifically Taiwan Semiconductor Manufacturing Company’s direct investment in the state. At the time, it was heralded as “the largest foreign direct investment in a greenfield project in American history.”

    So, there’s a lot that can be gleaned from a map like this. If we were to zoom out and look at all international air travel, we would likely see some reordering. I suspect Paris would jump ahead of airports like Vancouver, given its hub status for other airlines. But it’s unlikely you’d see a completely different list. Americans fly east to London, south to Cancun, west to Tokyo, and north to Toronto. These are the primary hub airports.

    Cover photo by Yu Kato on Unsplash

  • Merry Christmas

    December 25, 2025 · View original


    Wishing you all a Merry Christmas and a restful holiday break.

    Katharina Fritsch’s Madonnenfigur is one of the most iconic and polarizing works of contemporary German art. Based on a 12-inch, mass-produced souvenir statuette of the Madonna she found while traveling, Fritsch’s version stands 170 cm tall (her own height) and is coated in saturated, matte fluorescent yellow paint. This changes your perception of what would otherwise be a deeply familiar object (to most, at least). As far as I know, the artist has never clarified whether her work is intended to be religiously respectful or satirical — so that’s for you to decide.

    Art: Katharina Fritsch, Madonnenfigur | Madonna Figure, 1987

    Photo: Ivo Faber

  • A bias toward action

    December 24, 2025 · View original


    2025 was a tough year to be a real estate developer in Toronto. And it was a tough year for a whole host of reasons, not all of which you might immediately expect. In addition to it being challenging (and in some cases impossible) to underwrite new projects, raise capital, sell pre-construction homes and many other things, it was also a challenging market from a psychological standpoint.

    Real estate development is a business that arguably attracts “Type-A” personalities. These are people who stereotypically tend to be ambitious, driven, competitive, and impatient. Said differently, they tend to have a strong bias toward action and a strong internal locus of control. I’m certainly programmed this way. I have a real problem with free time, and I’m at my happiest when I’m achieving things. I’m sure that many of you are the same way.

    However, when the market is soft or shut off, the primary modus operandi of action gets neutralized. And since people with a strong internal locus of control believe that it is their individual actions that directly lead to successes and failures, this can create a psychological crisis. Am I the one failing? Is there anything else that I could be doing to create action, right now? (Simply waiting could be the correct answer.)

    The older I get, the more I realize that an important skill in life and business is managing your own psychology. In fact, it may be the most important skill of all. So, what I have been doing as of late is continually reframing the current market. Rather than focusing on what’s not happening, I like to remind myself that this market is surely presenting the greatest set of opportunities that I have seen in my real estate career.

    It may not feel like the typical kind of action right now, but everything is strategic preparation.

    Cover photo by Jānis Beitiņš on Unsplash

  • A look back at (almost) a year of New York’s congestion zone

    December 23, 2025 · View original


    It has now been almost a year since New York City implemented its congestion charge for the area of Manhattan south of 60th Street and, despite all of the critics, the results are overwhelmingly positive. Here are some of the most important data points:

    – Pollution is down by as much as 22% in the congestion zone area. – Traffic has declined by about 11% in the zone. As a reminder, traffic improved basically immediately following the $9 charge. – An average of 71,500 fewer vehicles entered the zone each day from January through to November 2025, totalling nearly 24 million fewer vehicles. – The congestion charge is forecasted to bring in $548.3 million in 2025, beating the initial goal of $500 million. (This revenue will be used by the MTA for bond issuances that will in turn fund further infrastructure improvements.) – Importantly, foot traffic in the zone is also up year-over-year compared to Manhattan as a whole (3.5% versus 1.4%, respectively). – Storefront vacancies in the zone declined more rapidly compared to Manhattan as a whole and the rest of the city. (Though the vacancy rate is still the highest in this area, presumably because of the higher rents in downtown and midtown.) – New York City’s sales tax revenue is also up 6.3% this year compared to the same period last year, outperforming all neighboring counties. This suggests that the congestion charge is not keeping shoppers away.

    So, why shouldn’t other North American cities follow New York’s lead?

    Cover photo by ian dooley on Unsplash

  • Why rent control isn’t “free”

    New research shows restrictive reforms can result in a 10% reduction in rental supply

    December 22, 2025 · View original


    One of the basic principles behind rent control policies is that you’re trying to make housing more affordable for some, while at the same time more expensive for others. Economics is the study of choice, and this is a choice, whether it gets talked about or not. Previously, we spoke about a memo from Howard Marks where he describes the impact of rent control in New York City. In economic terms, that impact looks like this:

    – Some people who couldn’t afford to live in New York City if rents were set by the free market get the opportunity to live in the city (their housing is more affordable) – Other people who would like to live in New York City and could afford higher rents can’t because there are no available apartments (rent controls reduce housing supply) – And lastly, landlords with unregulated apartments can command higher rents than would be the case if new housing supply were not being discouraged (their housing is more expensive)

    Today, let’s talk about a recent research paper (June 2025) published in the Journal of Housing Economics called, “Rent control and the supply of affordable housing.” What the authors discovered was the following:

    – Restrictive rent control reforms are associated with a 10% reduction in the total number of rental units available in a city – Restrictive rent control reforms led to an increase in the availability of units affordable to extremely low-income households – This was offset by a decline in the availability of units to other income groups, particularly those at slightly higher affordability thresholds

    Once again, we see the economic trade-offs inherent in supply-side interventions like rent control. It’s better for some and worse for others. However, governments tend to favor it because it’s “free” to them; the costs are borne by landlords and renters at higher affordability thresholds. I’ll let all of you comment on whether you think this is good or bad, but regardless, I think it’s crucial that we acknowledge the trade-offs being made.

    Cover photo by Benjamin Ashton on Unsplash