Daily insights for city builders, delivered every morning at 6 AM ET. I’m Brandon Donnelly — a Toronto-based real estate developer and founder of Globizen. I’ve been writing here since 2013.

Month: April 2025

  • We’ve lost product-market fit

    April 30, 2025 · View original


    Vancouver is in the same boat as Toronto. The Globe and Mail recently reported that the number of newly completed, unsold condominium suites in the city is expected to increase to 3,493 by the end of this year, which would be a 60% increase compared to the end of last year and one of the highest levels of unsold inventory in recent times.

    The profound change, as we know, is that individual investors have largely left the market. Also in the article is some commentary from Ryan Berlin, who is head economist of Rennie Intelligence. According to Rennie’s data, investors made up about 50% of their buyers from 2020 to 2023. In 2024, this number dropped to around 25%. And so far this year, the number is ~7%.

    At the same time, the math is not mathing for developers:

    > Real estate appraiser David Eger, vice-president of Western Canada for Altus Group Ltd., gave the example of an older Vancouver apartment block within the Broadway Plan that is currently on the market for $12.2-million. To achieve a profit margin of 10 per cent of total costs to redevelop the site, the developer would have to pay drastically less, around $3-million for the property. That’s based on a rent of $5.50 per square foot, or $3,300 a month for a 600 square-foot unit.

    In some ways, all of this is what housing critics wanted: “Too many speculative investors are buying new homes and outbidding actual end users.” But now they’re not. So where are all the end users? Aren’t we in a housing crisis? This is the paradox of our current market. But I think the lesson is that a housing crisis does not necessarily equal a housing shortage in all segments of the market.

    Another way to think about it is that the inventory that is now accumulating has lost product-market fit. The market used to be a lot of investors, but now it’s not. So either the market needs to change again or the product needs to adapt to what the market wants today. And I suspect that, even in today’s market, there would be strong demand for more affordable family-oriented housing.

    The challenge is that our industry and our cost structures are not currently set up to deliver this kind of product. In software, it’s relatively easy to pivot in search of product-market fit. But it’s not so easy in real estate. Using the above example from appraiser David Eger, you’d need a negative land value (i.e. a subsidy) in order to be able to feasibly deliver more affordable family housing. That is, larger homes at a lower per square foot rent.

    But I think this is how all city builders should be thinking right now. We should be viewing this point in the cycle as an opportunity. It’s an opportunity to ask ourselves: what does the housing market want and how could we actually deliver it? Then it’s time to get creative and figure out how to pivot our collective product. There are, of course, lots of levers we can pull.

    Cover photo by Nate Foong on Unsplash
  • Tree ring model of culture and politics

    April 29, 2025 · View original


    I like thinking about new things, and so I like this recent post by Vitalik (the Ethereum crypto guy) talking about what he calls “the tree ring model of culture and politics.” The basic insight of the model is the following:

    > How a culture treats new things is a product of the attitudes and incentives prevalent in that culture at that particular time. > > How a culture treats old things is primarily driven by status quo bias.

    To explain why the world seems to work like this, he uses the analogy of tree rings, which are also called annual rings or growth rings. Trees grow in diameter each year and the result is a set of successive rings.

    Importantly, each tree ring is a result of the conditions that the tree experienced during its growing season. A wide ring typically suggests a favorable growing season and a narrow ring suggests a stressful growing season.

    Once the growing season is over, the ring becomes set, which is why dendrochronology is a thing, and why tree rings can be used to tell us about what happened in the past.

    The parallel with culture and politics is that it’s far easier to shape new things during their initial growth cycle, then to try and do it later. Because once the growth cycle is over and it becomes an old thing, attitudes are then guided by the status quo. They become set.

    To quote Vitalik: “What is easier is to invent new patterns of behavior that outcompete the old, and work to maximize the chance that we get good norms around those.” This makes a lot of sense to me and it’s a reminder to stay open to new things.

    Cover photo by Aleksandar Radovanovic on Unsplash

  • The life and times of Citi Bike #32606

    April 28, 2025 · View original


    Aaron Gordon, who is a data reporter at Bloomberg News, has been working on his coding skills. And so for absolutely no reason whatsoever, he decided to map out the life of one of New York’s Citi Bikes, specifically Citi Bike #32606. The dataset is pre-pandemic because Citi Bike stopped publishing unique bike identifiers for each trip around 2020. But based on historical data and far as we know, #32606 is the most-used traditional bike (i.e. not an e-bike) in the history of the Citi Bike network.

    It began its life on October 15, 2017 at 11:08am in Park Slope, Brooklyn, and then went on to accomplish 7,060 miles (~11,361 kilometers) and 8,624 trips over a period of 806 days. This works out to an average of just over 10 trips per day. In total, this bike traveled the equivalent of a return trip from New York to Los Angeles, and then a short trip up to Burlington, Vermont. And it was all done with only leg power.

    Here’s the visual mapping that Aaron created:

    Aaron W. Gordon (@agordon.me)

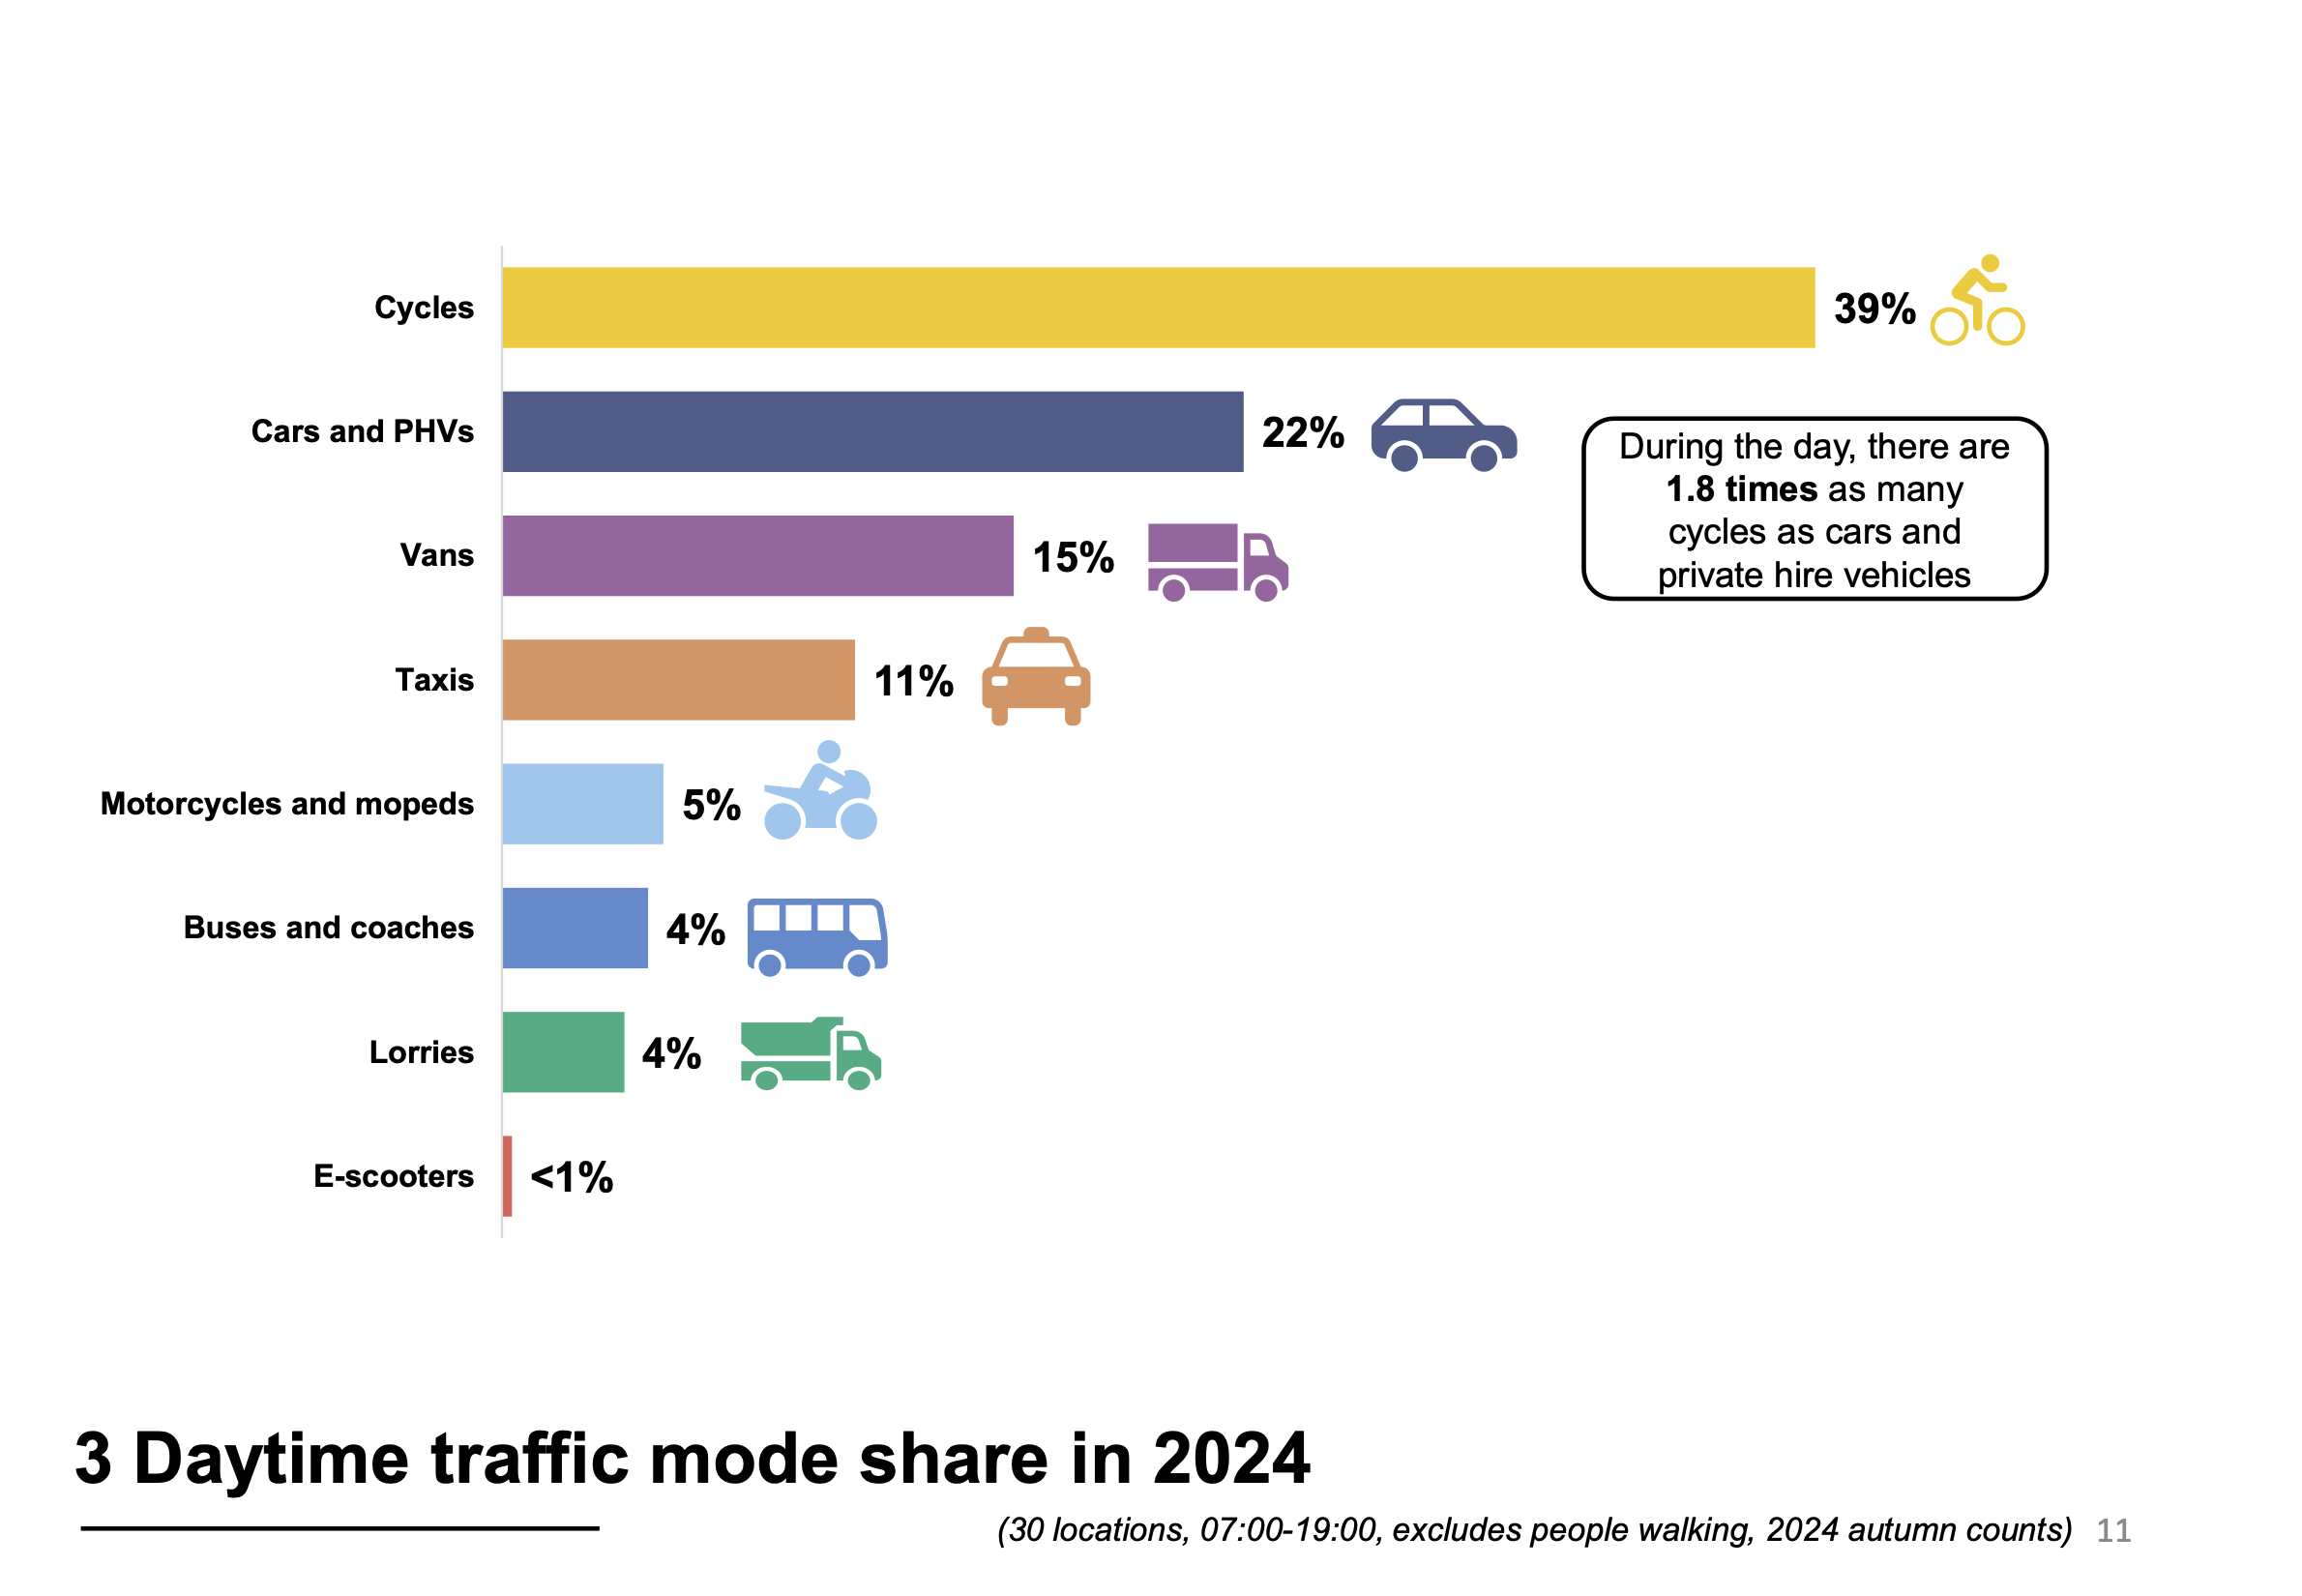
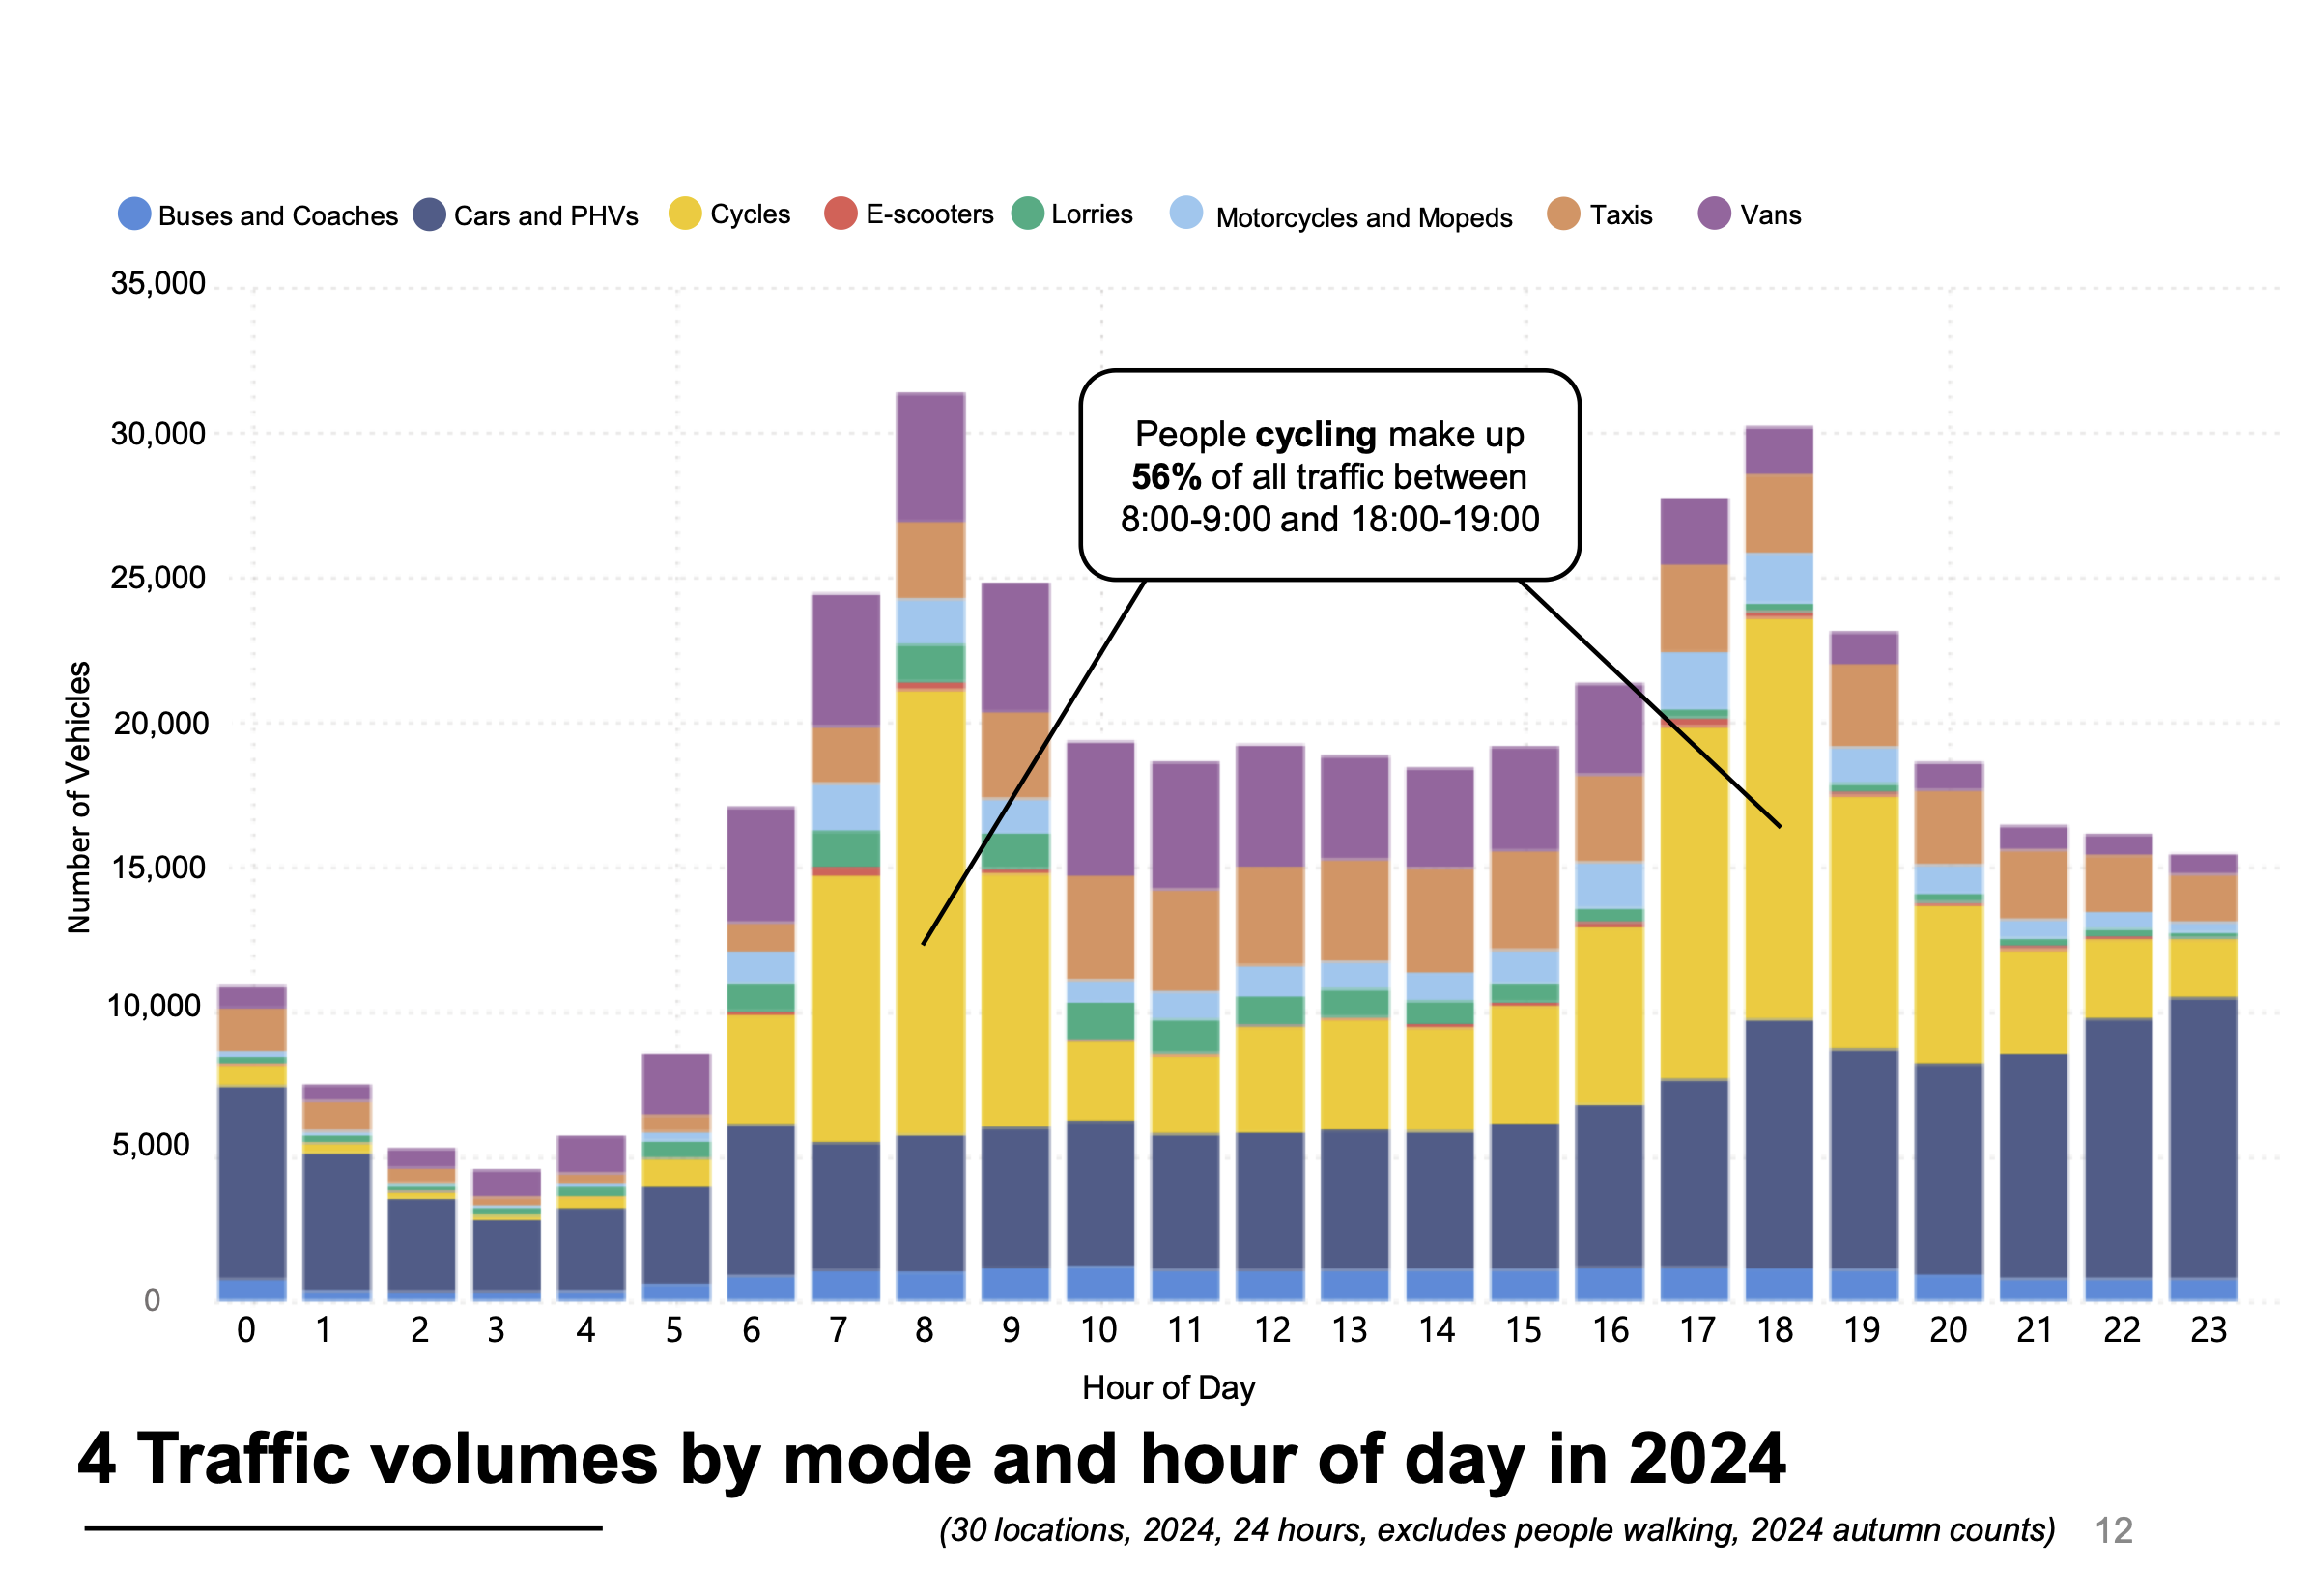
    What I love about this passion project is that it starts to show just how impactful something as simple as a single shared bicycle can be for a city. These bike networks are relatively new, but they’re already doing a lot of heavy lifting when it comes to urban mobility. Earlier this week, we learned that in the City of London, cyclists now make up 2x the number of people in cars. And that of the people cycling, 17% of them do so using a shared bicycle.

    In the case of New York, the Citi Bike network had ~128,000 active members and ~34,000 bikes as of February 2025. What you’re seeing above is the story of just one them.

    Cover photo by Spenser Sembrat on Unsplash

  • Looking back at the Toronto real estate market in the 90s

    April 27, 2025 · View original


    Longtime readers of this blog might remember a post that I published back in 2016 where I talked about the genesis story of Toronto-based developer David Wex and his company Urban Capital Property Group. In it, I wrote about his first project at 29 Camden Street in the Fashion District. It had a total of 55 condominium suites and an average price per square foot of ~$195. And it took somewhere around 2 years to pre-sell enough of the suites for construction financing.

    The reason I bring this up today is because when I originally wrote the post, it seemed so far from reality. In 2016, I said that these same 55 suites could be sold within 2 hours at $800 psf! But now things have changed once again. The market realities that David was facing in the mid-90s with Camden Lofts feel remarkably similar to today. Selling even 55 suites might not be a sure thing. And this is the first time in over 2 decades that the market has been like this.

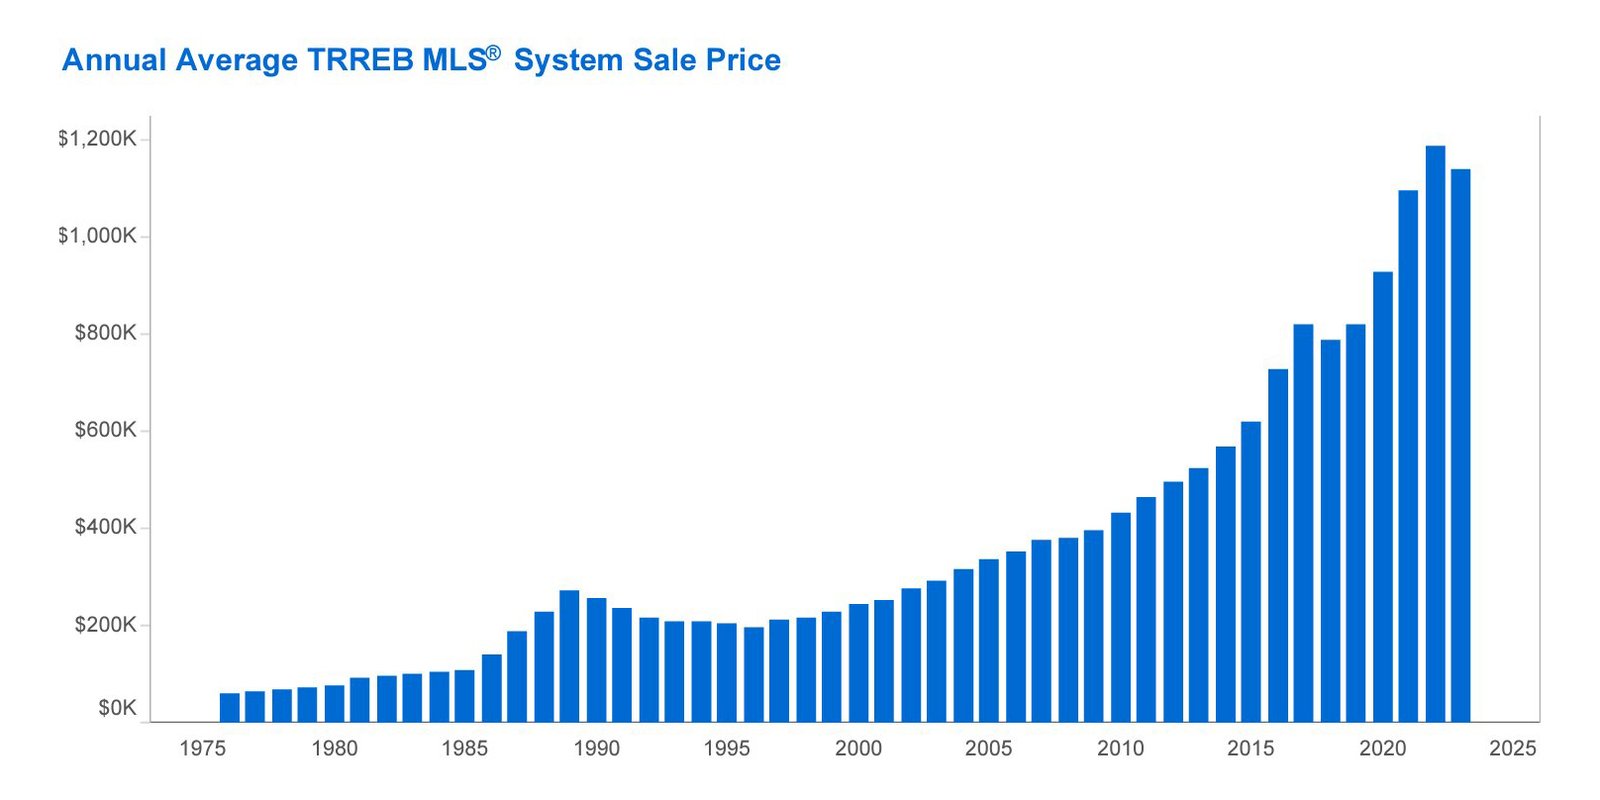
    So for fun, let’s consider what happened in the late 80s and 90s. The Toronto housing market peaked in 1989 at an average price of approximately $273,698 (according to the Toronto Regional Real Estate Board). It then went on to decline 27% over the next 7 years, finally bottoming out at approximately $198,150 in 1996. So it took around 8 years for the market to stabilize.

    Of course, the market took even longer to return to its 1989 peak. The average home price crossed $275,000 in 2002, which means it took 13 years in nominal dollars. However, $275k in 1989 is the equivalent of around $610k in today’s dollars. So in real dollars, it actually took until 2011 for the market to return to its prior peak, which is some 22 years later!

    I’m not arguing that the exact same thing will play out with this cycle. Who knows, Toronto is a different city. But I have suggested that 2028 could be the year where we’re on the other side of this downturn. The average home price peaked, most recently, in 2022 at ~$1,194,600. Since then, it has come down by around 8.5% (as a broad average). If the market does turn positive in 2028, that’ll be 6 years after the peak.

    Only time will tell.

    Chart from the Toronto Regional Real Estate Board; cover photo by Melvin Lai on Unsplash

  • Zurich’s clever (but underrated) solution to traffic congestion

    April 25, 2025 · View original


    > Tweet: Traffic is horrible in Toronto and it will only get better once we fully embrace a post-car future. Everyone driving around most of the time just isn’t going to work for a city region of our scale.

    We talk a lot about mobility and traffic congestion on this blog — particularly in the context of Toronto — and that’s because it remains a problem and we continue to avoid any sort of big and meaningful moves. Instead, we like to politicize the problem and find scapegoats, such as bike lanes. So I think it’s important to have regular reminders that we do actually know how to address this problem. It’s a choice we and other cities can make.

    Here are three examples and possible solutions:

    Copenhagen: Over 60% of residents use a bicycle to commute to work or school. It is one of the most bike-friendly cities in the world. You’ve probably heard this before and are prepared to say, “yeah, well, we’re not Copenhagen.” But it’s important to point out that neither was Copenhagen. In the early-to-mid 70s, the modal split for bikes was somewhere between ~10-15%. – Singapore: This is one of my favorite examples. Singapore is home to the world’s first congestion charge zone (1975). And it operates on a dynamic pricing model, meaning that traffic congestion is continually monitored and road prices are adjusted to ensure that traffic always flows at certain minimum speed. It’s a highly effective tool and there’s no shortage of global case studies. Here’s Miami. – Zurich: Despite being one of the wealthiest cities in Europe, car ownership is relatively low (~40-45% of the population, compared to ~60-65% in Toronto). This is due to a great public transit system (Swiss trains and stuff) and because of strict parking policies, among other things.

    Zurich has a hard cap on the number of parking spaces in the central part of the city. It is set at 1990 levels, which works out to about 7,600 total parking spaces.). What this means is that if somebody, like a big bad developer, wants to build off-street parking, they need to simultaneously reduce the parking supply somewhere else. You can’t exceed the cap.

    This obviously discourages car usage and moderates the demand for city streets, but it also serves as a clever way to slowly replace on-street parking with better uses, such as an enhanced public realm. This policy has been in place since 1989 and it has had a dramatic effect on car usage. Between 2000 and 2021, the share of car trips in the city decreased from 40% to 29%.

    I know that many of you will scoff at these solutions and think “yeah, there’s no way.” But this is how you make traffic better. You reduce demand and use our finite amount of road capacity more efficiently. So we can either make bold moves or we can continue to complain about traffic.

    Cover photo by Claudio Schwarz on Unsplash

  • Fastest growing cities in Canada and the US

    April 24, 2025 · View original


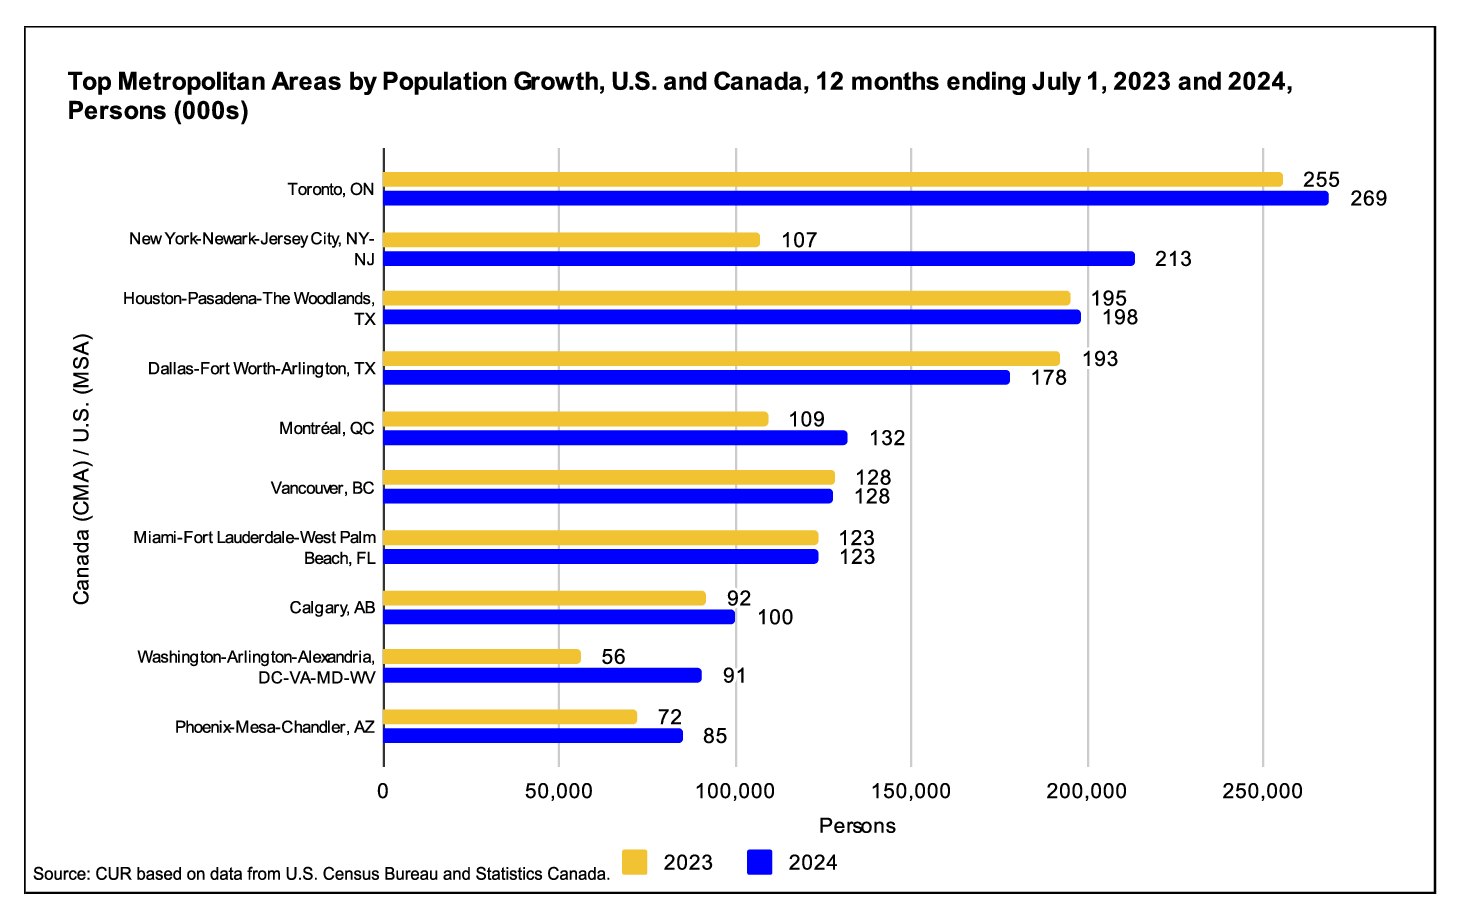
    Toronto may not be selling that many new condominiums these days, but population growth remains high across the region. For the 12-month period ending July 2024, the Toronto census metropolitan area added approximately 269k people. And for the 12-month period ending July 2023, it added about 255k people. In the context of Canadian and American cities, this makes it the fastest growing metropolitan area for two years running (see above chart). Lower immigration targets are expected to bring this number down going forward, and so it’ll be interesting to see what these numbers look like for the period ending this summer, but this is still over half a million people in two years. I think it’s also noteworthy that our housing market turned and pre-construction sales slowed around the middle of 2022, and yet our population growth and immigration levels remained the highest in Canada and the US for at least another two years. Maybe this lag helps us recover sooner than some might expect.

    Chart from the Centre for Urban Research and Land Development at TMU; cover photo by Mikayla Martorano on Unsplash

  • Miami condo market has turned

    April 23, 2025 · View original


    When I was in Miami at the end of last year for the Elevate real estate conference, I was given the impression that every new development project has a luxury brand associated with it and that buyers from all over the world still have an insatiable demand for the city. The Toronto developers in the room had no choice but to commiserate amongst each other and make up excuses for why abundant sunshine and low taxes couldn’t possibly be that nice.

    But things seem to be changing quickly in Miami. I am seeing reports that the condominium market continues to soften and that unsold inventory is starting to accumulate. This seems to be happening for a bunch of reasons: lots of supply, relatively high interest rates, higher insurance costs (due to climate things), more stringent reserve funding requirements (following the tragic collapse of the Surfside tower), and perhaps even the hostile environment that the US is now creating for foreigners.

    I don’t have clear data for the pre-construction side of the market (like I do for Toronto), but typically you need a strong resale market to support new development. And that’s because pre-construction pricing tends to be higher than resale pricing. If the latter is softening, then the value proposition for something new is weakened. On top of all this, there’s right now a risk premium on US assets. The country is being viewed as less safe.

    So it’s easy to be bearish.

    If any of you have any direct insights on the South Florida market, please leave a comment below.

    Cover photo by Tomas Lundahl on Unsplash

  • What removing development charges could do to apartment rents

    April 22, 2025 · View original


    Over the years on this blog, we have spoken about at least two ways to think about development pro formas. In the purest academic sense, you could say that pro formas are a way to determine the value of development land. You start with your forecasted revenues, deduct all of your expected costs, and then at the end you’re left with some amount of money that can be spent on land. Said differently, land becomes the “residual claimant” in your financial model.

    This is an important exercise, but in practice, pro formas sometimes (oftentimes?) need to be worked in the opposite direction. Meaning, the land price is what it is, development charges just increased, and now you’re trying to figure out a way to make the math work. In this direction, you could say that you’re undergoing a “cost-plus exercise.” The costs are the costs and now you’re trying to figure out some justifiable revenue figure that will make everything work.

    If you do this latter exercise for a new rental apartment in Toronto today, you will end up with a rental rate that is likely hovering somewhere around $5 per square foot. This is a broad generalization and every site is of course different, but for the purposes of this post, let’s assume it’s $5. What that means is that a 500 square foot one-bedroom apartment will rent for $2,500 per month and a 1,000 square foot three-bedroom will rent for $5,000 per month.

    A lot of people like to look at rental rates and say, “oh my, greedy developers are charging too much.” But the reality is that this is what the cost-plus exercise is telling developers. There isn’t the option of just charging less because there’s only so much you can do about costs.

    In fact, because development happens on the margin, some degree of optimism is often required to make new projects feasible. What I mean by this is that $5 psf may be what you need to make the project feasible, but there may be zero market comps in your submarket to actually support it. So in order to move forward, you just have to believe that in the future this will be the market rent.

    This is harder to do in Toronto today because rents are not growing, they are declining. I personally believe that will quickly reverse once new housing completions fall off a cliff, but it doesn’t change the fact that it’s harder to underwrite rental growth in this kind of market environment. And because it’s harder to underwrite rental growth, it’s harder to make projects work.

    The other consideration is that pushing rental rates higher is naturally going to slow down absorption. The Law of Demand tells us that as the price of something increases, the quantity demanded decreases. So you take on more risk in multiple ways when you push rates. As a developer, I’d rather be in a position where I could underwrite lower rents and feel more confident about leasing up the building quickly.

    One way this could obviously be done is to lower costs. So as an exercise, I opened up one of our rental pro formas and removed just two cost items: development charges and parkland dedication. The result, in this particular instance, is that we could lower our average rent by almost $300 per month and still have a more or less equally feasible project. That’s meaningful.

    A cynic would say that developers will still charge the higher rent, but again, I would argue this isn’t necessarily true, especially in this market. A cheaper cost structure means that more sites / projects become feasible and that developers should now face lower market risk. I’ll take that. I’ll take a full building with minimal vacancy and lower turnover.

    Cover photo by taufiq triadi on Unsplash

  • Growth paying for a lot of stuff

    April 21, 2025 · View original


    I am of the strong opinion that, as a general rule, development charges should aim to capture the costs and impacts directly attributable to new development. This is why I prefer the term “impact fee” as opposed to “development charge.” The latter makes it seem like a generic catch-all tax. But that’s not the intent. The intent is that “growth pays for growth.” At the highest level, this makes sense and sounds good. So with all the talk of lowering/eliminating DCs to help with housing affordability, I think a lot of people are rightly wondering: Is this actually feasible? What fees are actually needed to fund growth-related infrastructure? Let’s talk about this today.

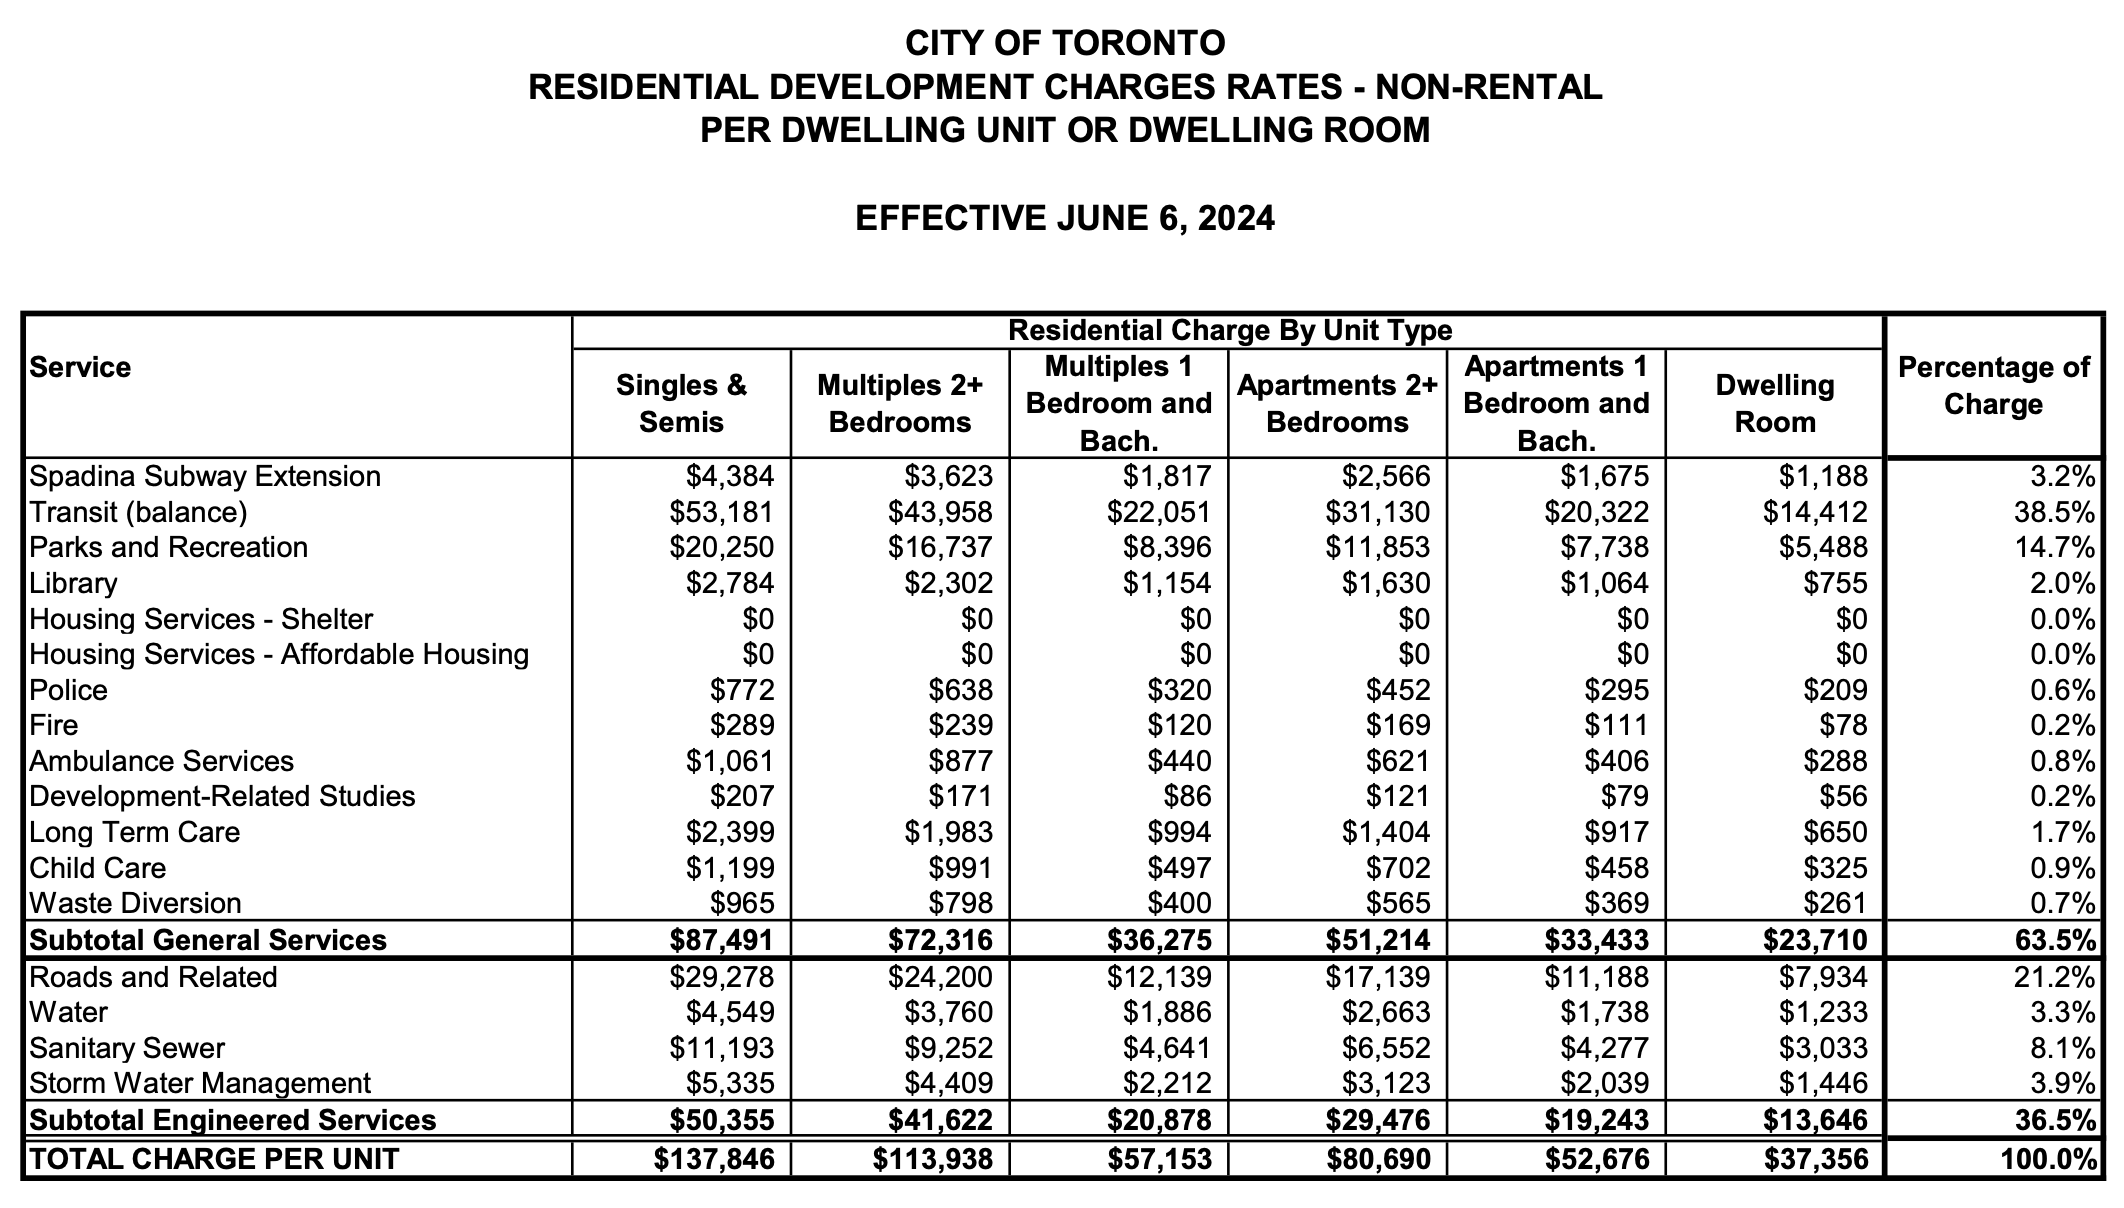
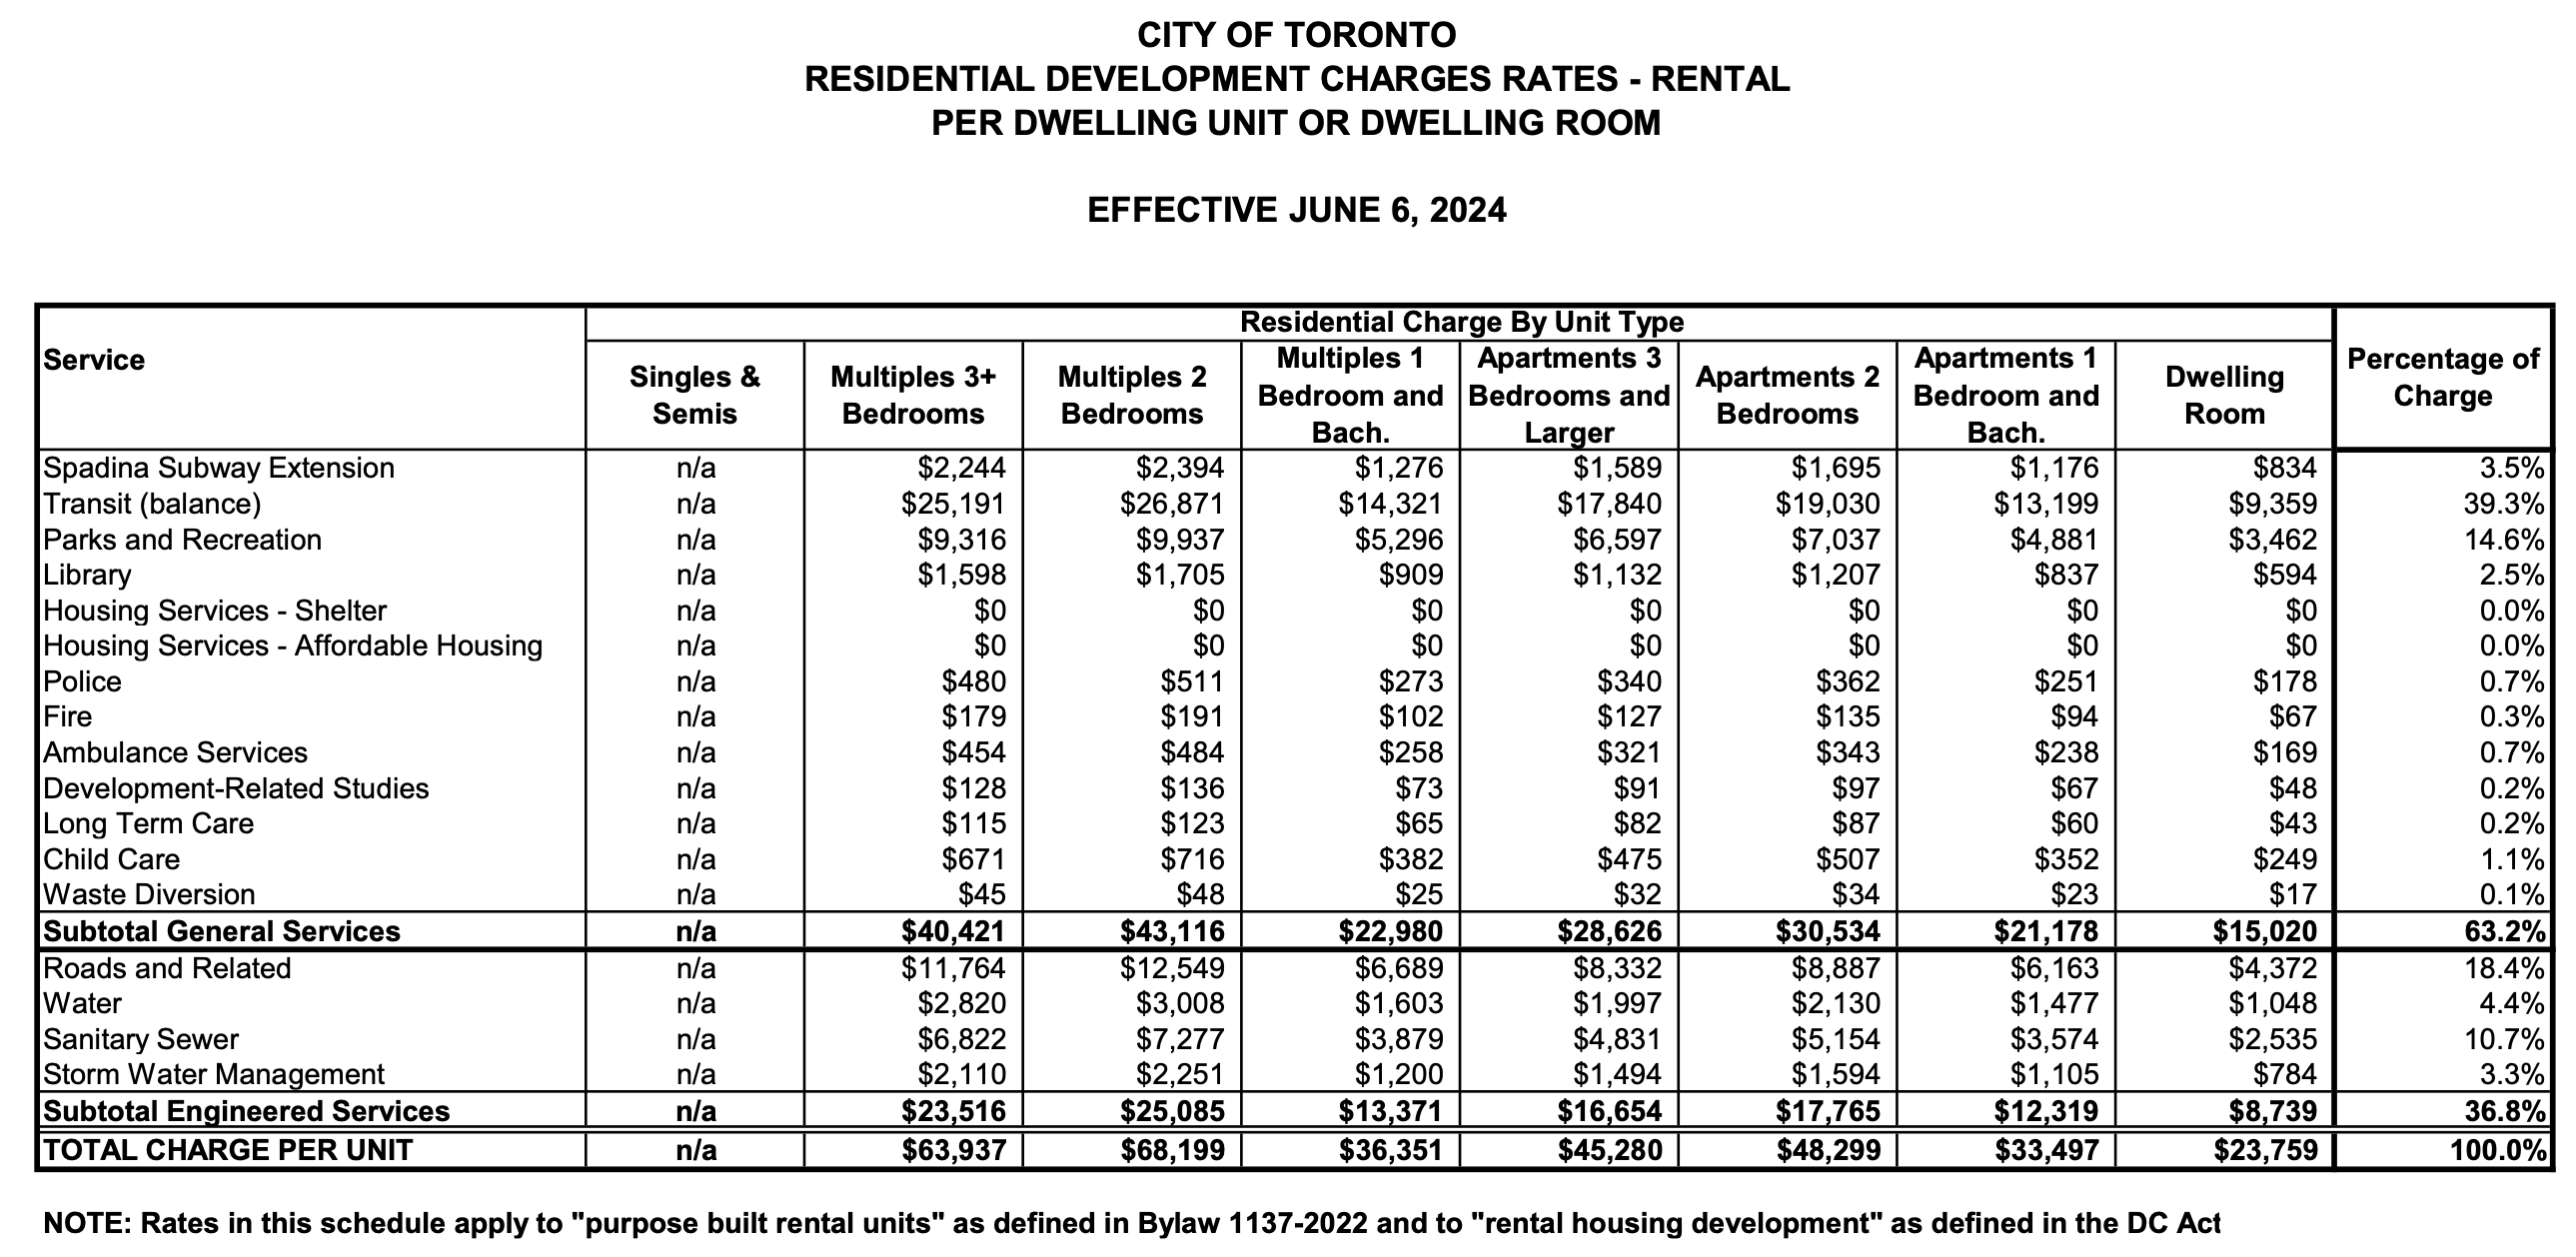
    For reference, here are the development charge rates effective June 2024 in the City of Toronto.

    Non-rental housing:

    Rental housing:

    In other words, if you were building 3-bedroom family-sized condominiums, the development charge would be $80,690 per home. And if you were building 3-bedroom family-sized rentals, the development charge would be $45,280 per home. But keep in mind that in addition to the above development charges, there are also other charges like the Community Benefit Contribution (Section 37), Parkland Dedication, Education Charges, Development Application Fees, HST, and so on.

    Growing development charge reserve funds

    Looking at just DCs, Ontario municipalities collected about $17.5 billion in development charge revenue over the last five years (according to the Missing Middle Initiative). But importantly, these same municipalities only spent $11.8 billion. The rest is sitting in DC reserve funds. Why is that? Well, part of this could be explained by timing. DCs are typically collected when a developer is issued their first building permit. But the costs associated with growth-related infrastructure may not happen at exactly the same time.

    Except that these reserves have been growing. From 2010 to 2022, DC reserve funds across Ontario have increased from $2.6 billion to $10.7 billion (again, according to the Missing Middle Initiative). This is a 316% increase over 13 years. And in the case of Toronto — Ontario’s largest city — reserves have grown 891% over the same period. This suggests that these charges aren’t accurately tuned to actual impacts, because, in theory, these reserves should trend toward zero over long periods of time, as growth-related infrastructure costs are incurred.

    Nexus between development charges and the impacts of new development

    Let’s get a little more specific. Over the last five years, DCs generated about $450 million for social services across Ontario. This includes things like long-term care, affordable housing, day cares, and public health; all of which are important and good things. But can all of these things be considered growth-related impacts? In other words, is it fair to say that because new housing got built, we now need more long-term care homes? I don’t think so. Long-term care homes are certainly needed, but I don’t think it’s fair for new home buyers and renters to shoulder this cost.

    Who is paying for the renaming of Dundas Square?

    Let’s consider another example. Back in 2014, Toronto City Council decided that Dundas Square should be renamed. I personally don’t think this was at all necessary, but it got approved and the cost to do so was estimated at $335,000. At the time, it was also decided that this would be paid for through Section 37 funds as opposed to “taxpayer money.” Section 37 of the Planning Act used to function in practice as “let’s make a deal.” It was a way for cities to extract money from developers in exchange for allowing more density. This has since been replaced by the Community Benefits Charge framework, but the intent is the same:

    > Section 37 of the Planning Act authorizes the City to adopt a community benefits charge (CBC) by-law and collect CBCs to pay for the capital costs of facilities, services and matters that are required to serve development and redevelopment. CBC funding will help support complete communities across Toronto.

    In funding it in this way, the City of Toronto took a position. It basically said, “renaming Dundas Square is important to the city. We must do it. But we don’t want all Torontonians to pay for it. We only want new home buyers and renters to pay for it.” Because that’s the effective outcome of using funds charged only to new developments. Is that fair? Once again, I don’t think so. Because it’s not reasonable to say that because new housing got built, it’s now imperative that we rename Dundas Square. The two are unrelated matters.

    By and large, this is the issue that many take with development charges. It doesn’t appear to be “growth just paying for growth.” It’s growth paying for a lot of stuff. And it has a direct impact on housing affordability. In tomorrow’s post, we’ll expand on this last point and talk about what lowering/eliminating DCs could mean for apartment rents.