Daily insights for city builders, delivered every morning at 6 AM ET. I’m Brandon Donnelly — a Toronto-based real estate developer and founder of Globizen. I’ve been writing here since 2013.

Tag: wall street journal

  • Why Phoenix is ground zero for algorithmic home buying

    I have been writing about algorithmic home buying on the blog since Opendoor launched back in 2014.

    I don’t have anything new to report on that today, but this recent article from the WSJ is interesting in that it talks about why Phoenix, in particular, has become ground zero for algorithmic home buying, as well as for institutional investors looking to buy cheap rentals.

    Across Opendoor, Offerpad, and Zillow, nearly 500 homes are now being purchased — largely by software — in Phoenix each month:

    One of the reasons why Phoenix is well suited to these platforms is that the housing stock is cheap and fairly homogenous. (The WSJ calls it “stucco sprawl.”) This makes it easier for the algorithms to put a value on the homes.

    A big chunk of the housing stock is also relatively new. Just over 36% of it was built in 2000 or later. And it tends to trade fairly often. Below is the percentage of homes in 2018 that were resold within a year of purchase.

    It’s also worth noting that Arizona is a non-recourse state, meaning you’re typically not personally liable if you default on your home mortgage. You simply hand back the keys. So it’s viewed as a fairly risk tolerant state, which may be one of the reasons why Phoenix’s median home price chart looks like this:

    I’ll end with this quote from the article: “It’s the dawn of e-commerce for real estate,” said Zillow Chief Executive Rich Barton. “Phoenix is ground zero.”

    Charts: WSJ

  • Aman New York’s $180 million penthouse

    This morning I was reading about Aman’s new condo and hotel project in New York, which is planned for the 100-year-old Crown Building at 730 Fifth Avenue. It will have 83 hotel rooms and just 22 homes, and be the first urban condominium for the resort company.

    Owned by OKO Group, the hospitality company is mostly known for their “sleek, minimalist hotels in secluded, far-flung destinations,” according to the WSJ. Rooms go for upwards of USD 2,500 per night and they, supposedly, have a rabid customer base known as “Amanjunkies.”

    What’s interesting about this project is that (among other things) it’s a bet the Aman brand will translate to an urban context and drive above-market pricing. And it will do it at a time when the ultra high-net-worth segment of the market in NYC has been cooling because of a new “mansion tax” and probably other factors.

    The five-storey penthouse, which will be built into the building’s “crown,” is asking USD 180 million. If/when it sells, it will break the record for the most expensive home ever sold in the city on a square foot basis at $14,358 psf.

    If you subscribe to the WSJ, you can read the full story here. I find it valuable to see how projects position themselves.

    Rendering: Aman

  • More than 1 in 4 Americans now live alone

    The percentage of single-person households in the US has been steadily increasing since the 1960’s (though the rate of increase has moderated in recent decades). As of last year (2018), 28% of Americans lived alone, according to the US Census Bureau. So about 1 in 4 households. This is in comparison to 13.1% of households in 1960.

    Here is a chart from a recent WSJ article on the topic:

    Not surprisingly, this is changing how marketers target households. Affluent, single-person households in urban areas have proven to be a boon to product makers because they tend to spend more per person and they tend to value time > money. Of course, this phenomenon also has implications for those of us who work as city builders.

    For more historical household tables from the US Census Bureau, click here.

  • Uber’s seed investors made this much money

    $UBER went public on Friday. Notwithstanding the initial stumble, Uber will go down in history as one of the most lucrative venture capital investments of all time.

    The stock is down from its IPO price of $45 per share, but at that price, the initial seed investment of $510,000 that First Round Capital made back in 2010 was worth about $2.5 billion on Friday.

    Here is a list of some of the other notable investors from Uber’s seed round and what their initial investments grew to over the course of 9 years (chart from the WSJ):

    Of course, for every Uber, there are many more failed companies. And for every investor who turns $5,000 into nearly $25 million, there are many more who decided to pass on the opportunity.

    In the case of Uber, many early investors couldn’t see how the product could go mainstream. It initially started upmarket with limousines, which was actually a clever way to hack the chicken-and-egg problem that plagues marketplaces.

    Many also wondered how many metro areas outside of San Francisco had the kind of urban density and supply and demand drivers to support this kind of a service.

    Today, some nine years later and many billionaires later, lots of people — including myself — are still wondering: Will Uber turn out to be a great (i.e. profitable) business? Hindsight is always 20/20.

  • Climate gentrification is reshaping coastal cities

    Last year, Jesse Keenan, Thomas Hill, and Anurag Gumber of Harvard University, published a research paper called, Climate gentrification: from theory to empiricism in Miami-Dade County, Florida.

    What they were trying to uncover was a possible relationship between climate change and single-family home pricing in places, like Miami, that are vulnerable to sea level rise and flooding. This phenomenon is colloquially referred to as “climate gentrification.”

    One of the things that they uncovered through their work was, in fact, a positive correlation between the rate of price appreciation of single-family homes in Miami-Dade County and incremental measures of higher elevation. In other words: there’s value in higher ground.

    Recent reports (like this one from the WSJ) that Little Haiti in Miami is experiencing a surge in investment, seem to, at least partially, support this finding. Little Haiti sits about twice as high as Miami Beach, which is only about 4 feet above sea level.

    Here is a diagram from the WSJ showing the change in home prices since 2018:

    I’m not sure that this diagram necessarily reinforces the above finding. Mid-Beach in Miami Beach is shown as having an 8% gain, and yet it sits, like pretty much the rest of the Beach, within a 100-year floodplain. But already Miami is looking to manage the impacts of, “gentrification that is accelerated by climate change.”

  • The WeWork of vacation rentals

    The word on the street is that Sonder — the marketplace for vacation rentals and competitor to Airbnb — is close to finalizing a $200 million investment round that would value the company at $1 billion.

    I first wrote about Sonder back in 2016 after I met someone from their business development team here in Toronto. I have yet to stay in a Sonder, but I’ve looked at their rentals a few times.

    One of the main differences between Sonder and Airbnb is that the former head leases their rental supply. And they do this by trying to go higher up on the food chain and partner with developers and real estate operators.

    In this regard, they are similar to WeWork. And it allows them to sit somewhere in between Airbnb and a conventional hotel. The supply is distributed, but the service offering is more consistent.

    Of course, this arguably makes their business model slower (they have to negotiate leases) and more costly (they’re committing to fixed costs). So it becomes a question of: How valuable is that consistent service offering?

    Lately when I travel, I’ve been trending more toward hotels, as opposed to Airbnb-like rentals. I like the experiences that many hotels are now focused on creating and I like knowing that if my flight arrives late (in a place like Brazil), I’ll be able to get into my room.

    I guess consistency does matter.

    Photo by Spencer Watson on Unsplash

  • Young people are driving a lot less

    As a kid growing up in the suburbs, I got my driver’s license the day I turned 16. Being able to drive was a big deal. But we know that this desire to drive has been changing in profound ways. Here’s some recent stats on the percentage of licensed drivers in the US by age (taken from the WSJ):

    In 1983, about 46% of 16-year-olds had a driver’s license. By 2014, this number had dropped to 24.5%, which is the lowest it has been in recent years, and was probably impacted by the broader economy. As of 2017, this number was up to about 26%.

    If you’re a car company, I would imagine that these are pretty important numbers. They represent the top of the sales funnel. Most people probably like to have a driver’s license in hand before they go out and buy a car.

    Supposedly, some people in Detroit are betting that young people will still eventually buy a car. And when they do, it’ll be a nice big one like an SUV or a truck. But, the data suggests that it is not just young people who are eschewing driving.

    Here’s some data from the University of Michigan Transportation Research Institute (via NPR), looking at the proportion of licensed drivers in the US by all age categories:

    While the biggest drop has certainly happened among younger generations, licensing is still down for older cohorts. Based on these numbers, we don’t hit parity until somewhere around 50 to 54 years old.

    And the only cohorts where licensing has increased significantly are when people reach over 55. Over 70 is up by a huge margin — more than the drop among 16 year olds — which is probably a symptom of people living longer.

    Some of this decrease among young people can probably be attributed to delayed family formation and people living in denser urban environments, where it is more convenient to get around without a car. But I don’t think that’s all of it.

    Which suggests to me that the race to autonomy is a pretty important one to win.

  • Liquidity network effect

    Uber filed its S-1 last week in anticipation of going public in May. The WSJ reported on it, here. These are always interesting documents because you get access to previously private information. Here we can see that Uber’s ride-hailing market share in the US is down to 67% (as of February 2019) from 78% two years earlier. Revenue from this business line — which is the company’s biggest — also seems to have levelled off (chart from the WSJ):

    The ride-hailing business today has become a commodity. A lot of people, myself included, simply check to see which service is the cheapest (usually it’s Uber vs. Lyft). So this space feels to me like a giant race to build the biggest network and get to something new, whether that be autonomous vehicles or delivery drones. Uber calls this creating a “liquidity network effect.” Here’s an excerpt from the S-1:

    We have a massive, efficient, and intelligent network consisting of tens of millions of Drivers, consumers, restaurants, shippers, carriers, and dockless e-bikes and e-scooters, as well as underlying data, technology, and shared infrastructure. Our network becomes smarter with every trip. In over 700 cities around the world, our network powers movement at the touch of a button for millions, and we hope eventually billions, of people. We have massive network scale and liquidity, with 1.5 billion Trips and an average wait time of five minutes for a rider to be picked up by a Driver in the quarter ended December 31, 2018. Every node we add to our network increases liquidity, and we intend to continue to add more Drivers, consumers, restaurants, shippers, carriers, and dockless e-bikes and e-scooters. We also hope to add autonomous vehicles, delivery drones, and vertical takeoff and landing vehicles to our network, along with other future innovations. Our strategy is to create the largest network in each market so that we can have the greatest liquidity network effect, which we believe leads to a margin advantage.

    If you’d like to download a full copy of their filing, click here.

  • How Japan increased its housing supply

    River Davis’ recent article in the Wall Street Journal about Tokyo’s generally flat home prices had me, again, wondering about demographics. I mean, aren’t their demographics working in reverse? They have an aging population, low immigration, and a low birthrate. But Tokyo, which represents about 11% of Japan’s total population, is still growing. And their home price index looks like this compared to San Francisco and New York:

    Davis’ argument, which of course has been made by others before, is that deregulation has allowed housing supply to actually keep up with demand. Land use policies were relaxed to allow taller and denser buildings to be built and some degree of decision making (I’m not sure how much) was moved to the central government in order to counteract the NIMBY problem that invariably attaches itself to local politics.

    The result is housing numbers that look and compare like this:

    In Tokyo last year, housing starts came in around 145,000, according to Japan’s land ministry. This figure is on par with the total number of new housing units authorized last year in New York, Los Angeles, Boston and Houston combined, based on the U.S. Census Bureau data. The same feat was achieved in 2017.

    If we are to normalize against New York, it looks like this:

    And the belief seems to be that it is working:

    “A reason why housing prices in Japan are not rising as fast as in New York, for example, is the large number of housing starts,” says Masahiro Kobayashi, a director general at the Japan Housing Finance Agency, a state-run entity which supports the housing market by purchasing home loans.

    One sentence that really stood out for me in the article is this one here: “Private consultants were given permission to issue building permits to speed up construction.” If any of you have tried to pull a building permit for a large project in Toronto, you’ll know that it can take a very long time (understatement). Maybe it is the same in your city. Should we be looking at this?

    Charts: WSJ

  • Uber to go public in 2019

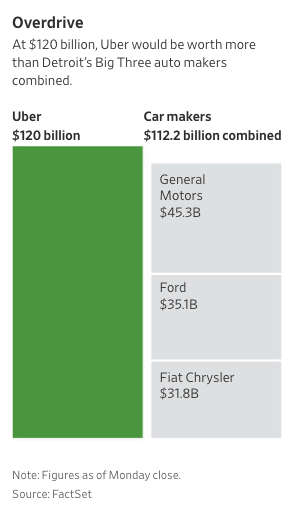
    Last week it was announced that Uber had confidentially filed for an IPO (right after Lyft did the same). It could go public as early as Q1 of next year. And supposedly, a valuation of $120 billion is being tossed around. The company last raised money in August of this year (from Toyota) at a $76 billion valuation.

    image

    Here are a few other interesting figures from a WSJ article published in the fall:

    – Uber has indicated that it doesn’t expect to be profitable for at least another 3 years. This year it is expected to hit between $10 and $11 billion in revenue, compared to $7.78 billion last year.

    – First Round Capital invested about $1.6 million in Uber’s first two fundraising rounds (2010 and 2011). If the company does in fact reach a valuation of $120 billion in the public markets, that early investment will be worth $5 billion. (First Round sold some of their shares to SoftBank in January and I’m not sure if the above figure accounts for that.)

    – Over 50 companies have invested in Uber since its founding, not including a slew of individual investments from people like Jeff Bezos of Amazon.

    On a related note, Fred Wilson, who is far more knowledgeable on this topic than I, recently published a post talking about the relationship between the private and public markets and what could happen to (tech) valuations in 2019. 

    It’s a good follow-on read to the above.

    Figure: WSJ