Daily insights for city builders, delivered every morning at 6 AM ET. I’m Brandon Donnelly — a Toronto-based real estate developer and founder of Globizen. I’ve been writing here since 2013.

Tag: toronto

  • Only 2 new single-family homes sold in Toronto last month

    Altus Group just released its January (2018) sales figures for the new home market in the Greater Toronto Area.

    – 1,251 new homes sold last month. 886 of these (or 70.8%) were condominium apartments (everything from stacked townhouses to high-rises).

    – This is down from 2,429 homes in 2017 and 2,118 homes in 2016.

    – Almost half of the new home sales (609 homes) came from Toronto alone. And almost all of these (607 homes) were condominium apartments. Only 2 new single-family homes sold in the city last month.

    – Benchmark price for single-family homes was $1,229,454, which is a 19.6% increase from January 2017.

    – Benchmark price for condominium apartments was $714,430, which is a 40.8% increase from January 2017.

    That last increase really stands out. I did a double take.

    But as we’ve talked about before, low supply and high prices seem to be pushing more buyers toward condos – and larger ones at that.

    Recently we’ve been seeing an increase in both average unit sizes and prices per square foot.

    According to Altus, sales of new single-family homes in the GTA last month were the lowest for a January since before 2000.

  • Global mobility index

    Below is a short video that was created by the MIT Senseable City Lab, World Economic Forum and TomTom for a study on how people move in 100 cities around the world. They call it the Global Mobility Index.

    It shows congestion levels (using real-time traffic data from TomTom), commute times, and an estimate for the percentage of trips that could be shared if people were willing to wait up to 5 minutes.

    In the case of Toronto, they estimate that 99% of trips could be shared and that it would increase average speeds by ~7.9 km/h and reduce overall traffic levels by ~44.09%.

    Their solution to solving traffic congestion is a cocktail that involves car-sharing, bike-sharing, and public transit. It’s about developing a “mobility portfolio.” Seems sensible.

    I found myself wanting more information and data after watching the video. Still, it was interesting to see what the authors describe as the “pulse of our cities.”

    If you can’t see it below, click here.

    [youtube https://www.youtube.com/watch?v=ciJEHGMtpWc?rel=0&w=560&h=315]

  • Drone footage of Chicago’s riverfront

    Dezeen just published the below video of Chicago’s revitalized riverfront. The Chicago Riverwalk extension and renovation was completed in 2016 by Boston-based Sasaki Associates and Ross Barney Architects, and the video is by Chang Kim. It does a great job showcasing the city’s enviable connection to the water. If you can’t see it below, click here.

    [youtube https://www.youtube.com/watch?v=7T9xH2C-Ggk?rel=0&w=560&h=315]

    On a separate but somewhat related note, I am continually impressed by the work that is coming from filmmakers, vloggers and YouTubers like Casey Neistat and Sam Kolder (who, by the way, is from Toronto). Individual content creators continue to change the way we all consume content and, consequently, the way companies now need to market.

  • Centralized taxi branding vs. decentralized ride fulfillment

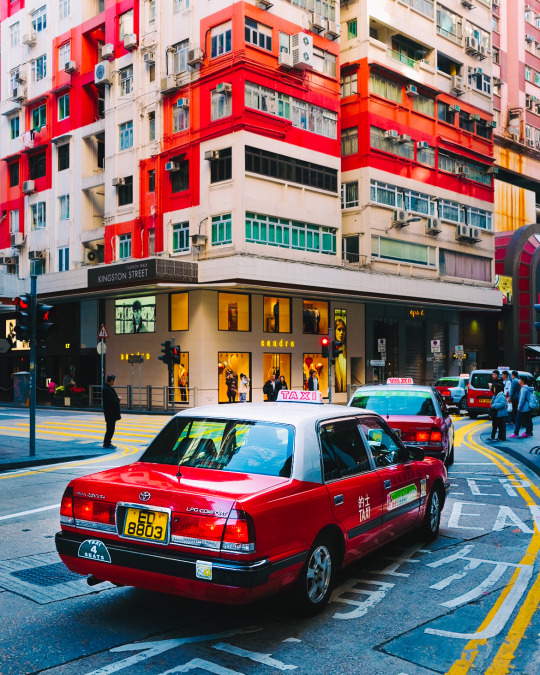
    Back in 2013, when this blog was in its infancy, I argued that Toronto needs a consistent taxi brand. Since nobody was reading the blog at the time, I am sure that most of you have never read this post. I even forgot about it, until last night when I posted this photo of Hong Kong to Instagram:

    It reminded me of the role that taxis play in city branding. This photo is clearly of Hong Kong. But take away the taxis in the foreground and I would really have to think in order to identity it. I would then be searching for street signs and looking to see what side of the road the cars are driving on.

    Now, a few things have changed since 2013. Back then I didn’t have the same appreciation for decentralized ride hailing (Uber and Lyft), though I did have the same distaste for the taxi cartel. And I recognize that there is a tension between centralized taxi branding and a decentralized approach to ride fulfillment. 

    I’m not exactly sure how to solve this problem, but maybe it gets easier with autonomous vehicles and probable changes to the way consumers own, or don’t own cars. I believe it’s important for places and cities to have specificity. If you have any thoughts, please leave a comment below. 

    (I am trying to respond to all comments on this blog, because I’m finding it impossible to respond to all blog related emails. Sorry.)

  • Why east sides are often poorer than west sides

    In a recent Spacing article, called Pollution and the fall and rise of urbanism, Dylan Reid argues that one of the reasons why urbanism declined in the 20th century was because of industrial pollution. (There are, of course, other contributing factors beyond just pollution.)

    This article is the first time I have come across a study supporting the widely held belief that pollution and prevailing windows are the reasons for why the east sides of many former industrial cities are poorer than the west sides. Here is more on that from the article:

    People recognized and understood that pollution had an impact on them, and they tried to avoid it if they could afford to do so. Have you noticed, for example, how in so many cities (Toronto included), the east side is poorer than the west side? It’s because the prevailing winds in Europe and North America are west to east, and they blow pollution to the east side. A fascinating study by economists Stephan Heblich, Alex Trew and Yanos Zylbergerg quantified this effect, identifying how 19th century pollution was dispersed eastwards and showing that the most polluted areas were also the poorest. 

    What the authors discovered is that not only did pollution cause a geographic sorting based on wealth, but that there’s also a certain degree of persistence to it. This makes sense if you think about it. Pollution in our cities has waned significantly and yet here we are still remarking and talking about east vs. west.

    It goes to show you just how long lasting the impacts of our city building decisions can be.

  • How should mid-sized cities really compete?

    Jennifer Keesmaat – the former chief planner of Toronto – recently published an article in Maclean’s called: Toronto’s unaffordable. Why can’t Halifax or Saskatoon take advantage? Her argument: 

    “The hard truth is that many mid-sized cities won’t win the future because they are stuck on a suburban growth model. If the future is green and walkable, they will be left behind.”

    The model city that is held up is Portland – a terrific mid-sized city of only 640,000 people that has used progressive land use policies to build a livable and dense urban center. (In all fairness, the Portland MSA has over 2.4 million people.)

    Now, if you’re a regular reader of this blog you’ll know that I have a penchant for dense urban centers. I live and I work downtown. And I would happily trade square footage for a more sensible commute and lower transportation costs.

    But after I read the article, I couldn’t help but think that progressive land use policies, alone, aren’t enough. Cities, like social networks, experience network effects. That’s why there’s so much talk these days of winner-take-all urbanism.

    All of this is not to say that progressive urban policies are a bad thing. Quite the opposite. I just think there are many other factors at play if we’re talking about taming the hegemony of our global cities.

  • My even shorter Amazon HQ2 shortlist

    Amazon released its shortlist of HQ2 cities this morning. Below are the 20 metropolitan areas. They were selected from 238 bids, so this shortlist represents 8.4% of the original pool.

    • Atlanta, GA
    • Austin, TX
    • Boston, MA
    • Chicago, IL
    • Columbus, OH
    • Dallas, TX
    • Denver, CO
    • Indianapolis, IN
    • Los Angeles, CA
    • Miami, FL
    • Montgomery County, MD
    • Nashville, TN
    • Newark, NJ
    • New York City, NY
    • Northern Virginia, VA
    • Philadelphia, PA
    • Pittsburgh, PA
    • Raleigh, NC
    • Toronto, ON
    • Washington D.C.

    I saw some people on Twitter say that they were surprised to see Toronto and Miami on this list. I was not. If you remember, I publicly predicted on this blog that Toronto would be selected for Amazon HQ2.

    That said, I thought it would be fun to guess at an even shorter list from Amazon’s shortlist. I have no knowledge of Amazon’s actual selections process, but if I had to guess, here is who I would cross off the list:

    • Atlanta, GA
    • Austin, TX
    • Boston, MA
    • Chicago, IL
    • Columbus, OH
    • Dallas, TX
    • Denver, CO
    • Indianapolis, IN
    • Los Angeles, CA
    • Miami, FL
    • Montgomery County, MD
    • Nashville, TN
    • Newark, NJ
    • New York City, NY
    • Northern Virginia, VA
    • Philadelphia, PA
    • Pittsburgh, PA
    • Raleigh, NC
    • Toronto, ON
    • Washington D.C.

    That leaves us with a list that looks like this:

    1. Boston, MA
    2. Miami, FL
    3. Montgomery County, MD
    4. Newark, NJ
    5. Northern Virginia, VA
    6. Toronto, ON
    7. Washington D.C.

    So why this list? I’m probably wrong, but my reasons are as follows:

    – I think Amazon will opt for a metro area on eastern time.

    – There seems to be a predilection for areas around Washington D.C., so I left Montgomery County and Northern Virginia. 

    – As wonderful as it is, New York City feels too center ice for Amazon – at least in my view. But maybe Newark places them in the catchment area.

    – The area needs to be of a certain scale so Amazon doesn’t overpower it and they have enough human capital to draw from.

    – Miami is my sleeper bet. Most people think of it simply as a resort town, but there’s a huge percentage of foreign born residents and powerful arts/design scene.

    – Talent is number one, which is why I left Boston and Toronto and why I continue to believe in Toronto. Toronto is more dynamic than Boston.

    If I had to pick just three from the above shortlist, my bets would be, in alphabetical order: Boston, Toronto, and Washington D.C. What are yours?

  • 2017 was a record year for housing starts in Canada, but…

    According to Bloomberg (using data from CMHC), 2017 was a surprising record year for housing starts in Canada: 219,675 units. This is the most since 2007 and is up from 197,916 units in 2016.

    The explanation: job growth (nearly 400,000 new jobs) and population growth were both more robust than expected.

    Multiple unit project starts are also up significantly with 142,840 units starting in 2017. This is a 15% increase from the prior year. Of these units, 102,516 of them were “apartment-like homes.”

    But all of this is nationwide data. Look at what happened in Toronto and Vancouver:

    The increased activity mostly sidestepped land-constrained Toronto and Vancouver, the country’s two most expensive markets, but was robust in the suburbs and less pricey surrounding cities. Starts in Toronto fell 1 percent to 38,738 in 2017, while declining 6 percent in Vancouver to 26,204 units.

    This is not because of a lack of demand. It’s becoming systematically more difficult and more costly to build new housing in these two markets.

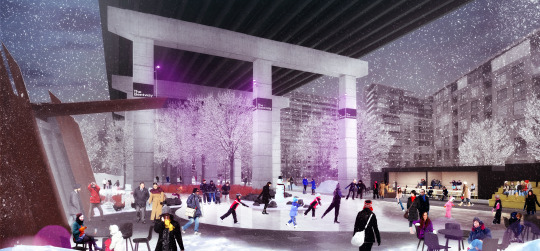
  • Bentway skate trail opens in Toronto

    The new Bentway skate trail officially opened this weekend in Toronto. Click here for the hours and for info on skate rentals.

    Here are a some photos from blogTO. And here and here are two posts that I previously wrote about the Bentway project. (I still really like the original “Under Gardiner” moniker, but maybe the Bentway will grow on me.)

    The skate trail (220m track) is only the first section of the larger 1.76 km Bentway project, but I am excited to check it out. I plan to do that next weekend.

    As I mentioned before, the Bentway project is a great example of rethinking neglected urban spaces. This area under the Gardiner Expressway was/is a wasted opportunity. I’m glad we’re doing something about that.

    Image: The Bentway

  • Inside-outside

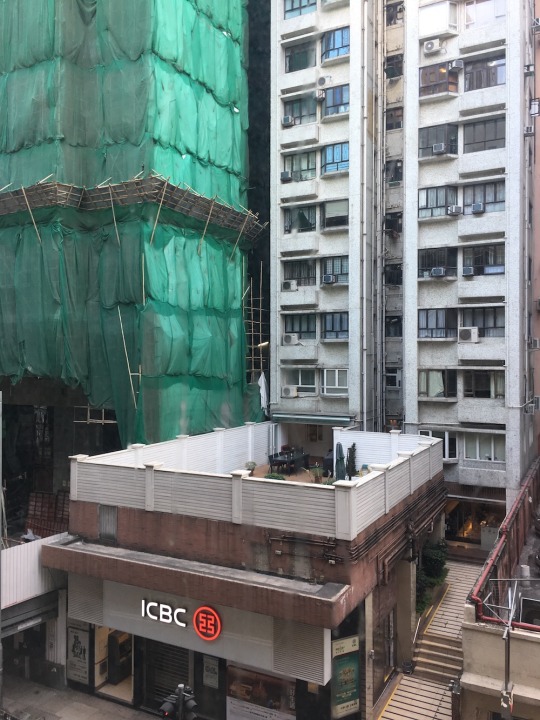
    Take a look at this photo from Central in Hong Kong and note the MEP (mechanical, electrical, and plumbing) systems running up the cutout in the middle of the tower. Also note the bamboo scaffolding next door and the epic terrace on top of the ground floor bank. The building on the opposite side put parking on top of its podium.

    image

    I was told that systems are commonly run on the outside of buildings here to maximize interior square footage. Again, space is a precious commodity in this city. But it also speaks to not having to worry about freeze-thaw cycles. Winter in Hong Kong has so far equaled me walking around in a t-shirt.

    These exposed systems look ugly as all hell, but I suppose they also mean not having to break open drywall when you have a problem.

    I am fascinated by the relationship that buildings have between interior and exterior space. In cold cities like Toronto we are forced to hermetically seal off our buildings from the elements. We have to worry about thermal bridging and about heat tracing cold spots.

    But in a city like Hong Kong I would imagine that the greater concern is stifling heat and humidity. All of this comes through in the built form.