Daily insights for city builders, delivered every morning at 6 AM ET. I’m Brandon Donnelly — a Toronto-based real estate developer and founder of Globizen. I’ve been writing here since 2013.

Tag: tokyo

  • Homes built in the past year

    I’m on a flight right now reading the latest issue of Monocle Magazine in a seat that barely accommodates the length of my femur. This month’s issue has their annual ranking of the top 25 cities in the world.

    Munich is first, which is not unusual for their ranking methodology. It generally scores well. Quality of life is high. Crime is low. The economy is strong. Beer gardens are fun. And you’re close to the Alps for snowboarding.

    One stat that caught my attention — and it’s not included for all of the cities — is the number of homes built in the past year. Presumably this is all housing units in the metro area — for sale, for rent, subsidized and so on.

    Here are their (clearly rounded) numbers. The order is as they appeared in the ranking, but again, not ever city included this stat.

    • Munich: 8,300
    • Tokyo: 150,000
    • Copenhagen: 5,000
    • Berlin: 11,000
    • Madrid: 1,600
    • Hamburg: 7,000
    • Melbourne: 5,100
    • Helsinki 4,400
    • Stockholm: 7,000 (18,000 in Greater Stockholm)
    • Sydney: 39,000
    • Hong Kong 17,000
    • Vancouver 22,600
    • Amsterdam 5,100
    • Kyoto 8,900
    • Dusseldorf 2,600
    • Barcelona 1,000

    Some of these numbers appear to stand out, such as the counts for Tokyo, Sydney and maybe Vancouver. But it’s hard to draw any conclusions around housing supply and housing affordability.

    Melbourne and Amsterdam allegedly have the same number of homes built over the past year, but according to Monocle the metro areas of Melbourne and Amsterdam have populations of 4.85 million and 2.4 million, respectively. This also says nothing about their growth rates.

    So which one is doing a better job of addressing housing demand? I’m not sure.

    But it was still interesting to see that Tokyo delivers somewhere around 150,000 homes a year. Tokyo is somewhat unique globally in that it’s a big city — one of the biggest — that somehow manages to gracefully balance both scale and quality of life.

    Photo by Elias Keilhauer on Unsplash

  • Firm Profile: APOLLO Architects & Associates

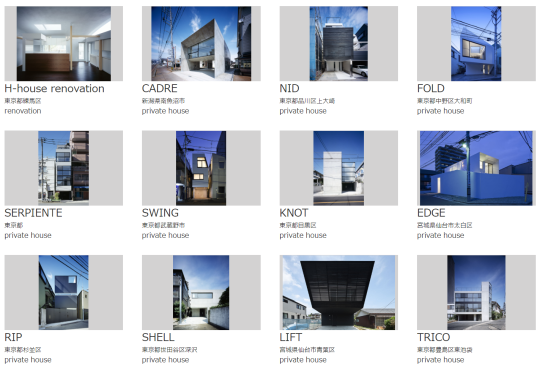
    This afternoon my friend Gabriel, of Gabriel Fain Architects, sent me the work of APOLLO Architects & Associates. They are based in Japan and South Korea. Here is a preview of some of their “private houses”:

    There is a lot that I love about these homes. 

    I love their simplicity. Look at this handrail detail. Nothing more than what is absolutely necessary.

    I love their modesty. Many of the above homes hover around 150 square meters and many of them are much much smaller. 

    I love that each project’s description starts by talking about the owners and the site conditions, signaling that each home represents an individual response tailored to both the occupants and the context.

    And I love that many of these homes have been built on unthinkably small parcels of land in dense urban settings; parcels that would be dismissed as entirely useless in other parts of the world. 

    The site area for this home is 46.53 square meters and the building’s footprint is 36.93 square meters.

    Of course the Japanese housing market is a unique place. It’s worth pointing that out. 

    But as I browsed through what are effectively custom single family homes, I couldn’t help but be reminded that there’s a fine line between need and want.

    Small can be very beautiful. But small is also subjective.

  • Multi-Unit Housing in Urban Cities: From 1800 to Present Day

    I just ordered a copy of Multi-Unit Housing in Urban Cities: From 1800 to Present Day by Katy Chey. I figured this was a book that we should have hanging around our office. I also like to support the Daniels Faculty.

    The book covers the following multi-unit housing typologies:

    • Back-to-backs in Birmingham
    • Tenements in London
    • Haussmann apartments in Paris
    • Tenements in New York
    • Tong lau in Hong Kong
    • Perimeter block, linear block and block-edge in Berlin
    • Perimeter block and solitaire in Amsterdam
    • Space-enclosing structures in Beijing
    • Kyosho jutaku in Tokyo
    • High-rises in Toronto

    In addition to each typology, the book analyzes the connection between the housing type and the city. Why did certain typologies flourish where they did and how have they helped to define their city?

    It reminds me of what I was trying to do with some of my recent posts about Hong Kong’s typical tower plan, albeit with far less rigor than what I am sure has been applied to this book.

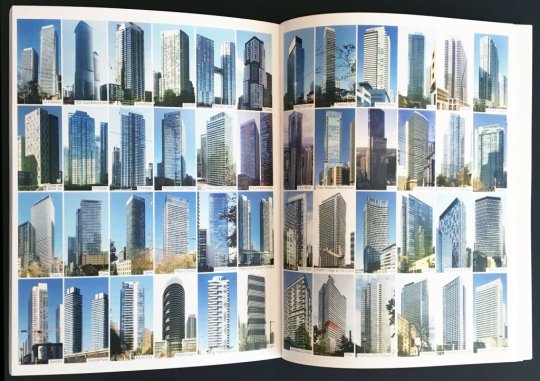
    I am also curious to read what has been written about high-rises in Toronto. It goes to show you just how defining the current real estate cycle has been for this city. That’s our multi-unit housing typology.

    Image: Daniels Faculty. My multi-unit home made the book.

  • MOMO TOKYO

    Last summer, photographer Parker Woods spent two weeks walking over 100 miles in Tokyo with a peach-colored (”momo” in Japanese) backdrop and a metal c-stand. He used this accessory to “contextualize his first encounter with Japanese culture.”

    In some cases, it functions as you would expect: as a backdrop for the new people that he encountered along his walking journey. 

    But in other cases, the backdrop is simply inserted into the urban environment. Sometimes rolled up amongst a pile of metal tubes. And sometimes fully erected in the middle of a busy road.

    This is an interesting photography project based in one of my favorite cities in the world, and so I wanted to share it on the blog. All of his photos were shot on Kodak film. It’s also giving me some ideas for my own photos.

    If you’d like to buy a copy of the book ($40), you can do that here. There’s a limited run of only 250 copies. If you’d like to read a bit more about the project (and see a few additional photos), you can do that here on VSCO.

    Image: Parker Woods

  • Top 10 city regions by GDP (and comparable countries)

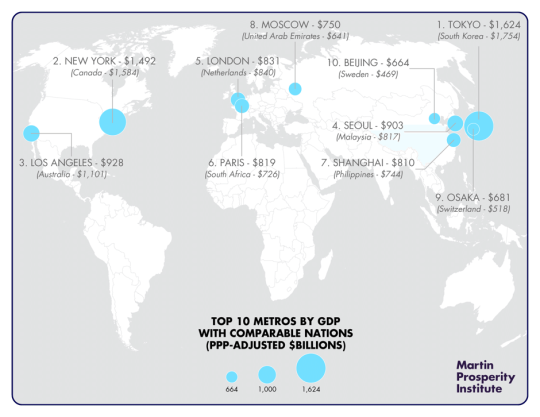
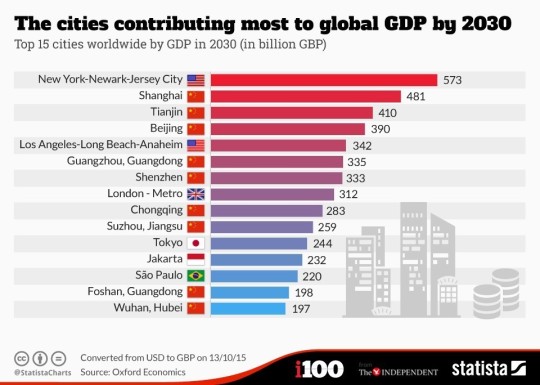
    Below is a mapping (by Taylor Blake of the Martin Prosperity Institute) of the top 10 metro economies in the world by GDP at purchasing power parity. In brackets, is a country with a comparable GDP.

    Tokyo is the world’s largest metro economy with ~$1.6 trillion in GDP. This is greater than the GDP of all of Canada. New York City is number 2 with ~$1.5 trillion in GDP, which is only slightly less than Canada.

    The point of all of this – which Richard Florida argues here – is that the global economy is, today, powered by metropolitan areas. And yet our governance structures do not reflect this new reality.

    Here’s an excerpt from Florida’s article:

    “Cities really are the new power centers of the global economy—the platforms for innovation, entrepreneurship, and economic growth. But when it comes to fiscal and political power, they remain beholden to increasingly anachronistic and backward-looking nation-states, which has become distressingly obvious with the rise of Trumpism in the United States and populism around the world.”

    Florida has been arguing this for years and I’ve really gotten behind it. The above chart is a good reminder just how big and wealthy some cities have become in today’s economy. 

  • Escalator etiquette

    image

    I am one of those people that gets annoyed when people don’t follow proper escalator etiquette. The etiquette being: stand on the right; walk on the left. Some cities – London and Tokyo come to mind – are draconian about this.

    But it turns out that this is not always the best way to optimize throughput. A recent study conducted in London found that during peak periods – such as the morning rush hour – it is actually better for everyone to stand still.

    What they found was that when 40-60% of people chose to walk up on the left, maximum throughput was 115 passengers per minute. But when everyone stood still maximum throughput increased to 151 passengers per minute.

    The reason for this is that walking takes up more space than staying put on one step. When demand is low, this has no impact on capacity. But as soon as people start slowing down to avoid the set of legs in front of them, a bottleneck occurs and capacity starts to drop. 

    This is not dissimilar to what happens in traffic jams. Imagine if during peak periods all of the cars could separate themselves by only a few inches and travel at exactly the same (slow) speed. That’s not going to happen until self-driving cars hit the road, but it would be more efficient than the current chaos of distracted drivers starting and stopping.

    All of this being said, since this finding only applies during very busy times, I plan to continue being annoyed when proper escalator etiquette is not followed.

  • The long and narrow of property affordability

    image

    Lots sizes and dimensions vary from city to city, as well as from neighborhood to neighborhood. They come in many different shapes and sizes from long and narrow (common in Toronto) to rectangular or even wide and shallow. Charlie Gardner wrote a terrific post on this last year where he used Bing Maps to illustrate some of these differences. Tokyo, for instance, is shown as having more rectangular lots (32′ x 38′), whereas Buffalo is shown as having more long and narrow lots (30′ x 175′). Charlie then asks: why the prevalence of inefficient long and narrow lots? These dimensions obviously produce long and skinny houses.

    As he rightly points out in his post, there are economic reasons for this. Assuming you’re starting with deep blocks and lots, then there’s going to be a natural tendency toward subdividing and going long and skinny. That’s because the key dimension is frontage onto the street. The more frontages you create, the more front doors can be built, the more lots with access to the Mississippi can be created, etc. And that’s how you end up with 10-12′ wide row homes, which also helps to address overall housing affordability. This is not a new phenomenon.

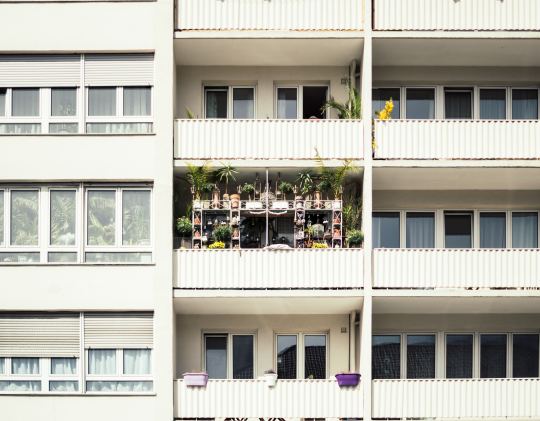
    To further demonstrate this point, let’s look at how this phenomenon has translated into the condo market – specifically the mid-rise condo market here in Toronto. In this case street frontage morphs into window frontage (access to light). That’s now the guiding dimension. In a 1 bedroom apartment, that dimension might be something around 6-7m. That allows you to have both a bedroom and a living room with a window. So it makes for a great 1 bedroom or 1 bedroom + den apartment. (I’m ignoring corner suites for this thought exercise.)

    However, a tension often arises when you begin to look at larger suites, such as 2 bedrooms and 3 bedrooms. The obvious response would be to simply give over more window frontage. So instead of 6-7m, the suite may get 10m. This would allow you to create a split 2 bedroom apartment (both rooms get windows) with a living room in the middle. This would be considered a highly desirable floor plan.

    But up until now we’ve been ignoring the depth of the apartment. And as is the case with lot dimensions, this can have an impact on the amount of street/window frontage that gets designed. We’ve talked a lot about mid-rise buildings before on this blog and one of the challenges here in Toronto is that the 45 degree angular plane guideline produces deep floors on the bottom of the building and narrow floors on the top. Given this, it would not be unheard of to end up with 12m apartment depths on some of the lower floors.

    The counter argument would be that nobody is forcing these larger floor plates. Simply carve the building back. But the economic reality is that the margins are so thin on mid-rise buildings, that it would be inconceivable to give up this floor area. You have to max out the envelope.

    Why does this matter? Well let’s assume that the average downtown Toronto condo will cost you $857 per square foot. Using back of the envelope math, that means that the above 6m x 12m apartment (1 bedroom) could cost around $663,000 (774 square feet x $857 psf). And that the above 10m x 12m apartment (2 bedroom) could cost around $1,106,000 (1,291 square feet x $857). 

    These are obviously big numbers. Question becomes: Who will be able to afford these?

    So naturally the design exercise becomes about reducing the size of the apartments and often this means reducing the amount of window frontage. Of course when you do this, it means that one or more of the bedrooms will need to be pulled back from the front windows, which is how you end up with inset / recessed bedrooms (indirect light) and long and narrow apartments. These are often pejoratively referred to as “bowling alley suites”, but they are driven by a push for greater affordability.

    Again, this is not a new phenomenon. It is simply a trade-off that gets made. It’s the long and narrow of property affordability.

  • Ian Gillespie: It’s not about business

    The founder of Westbank, Ian Gillespie, recently sat down with Bloomberg TV to discuss the Toronto and Vancouver real estate markets; his Mirvish Village (Honest Ed’s) redevelopment project; affordable housing; and the markets he is and plans to be focused on (Vancouver, Toronto, Seattle, Tokyo, San Francisco).

    I like the part where he says that he’s really not that interested in business.

    If you can’t see the video below, click here.

    https://www.bloomberg.com/api/embed/iframe?id=6542ca85-017c-436e-aefc-25d8f4bb9b66

  • World’s best city brands

    Resonance Consultancy – they do brands and strategies for places and products – has just released a new report called: World’s Best City Brands – A Global Ranking of Place Equity.

    With all of these sorts of rankings, it really depends on the research methodology being used and the rigor in which it is being applied. In this case, they evaluated each city based on “six pillars of equity”:

    1. Place: Perceived quality of a city’s natural and built environment
    2. Product: A city’s key institutions, attraction and infrastructure
    3. Programming: The arts, culture and entertainment in a city
    4. People: Immigration and diversity of a city
    5. Prosperity: Employment, GDP per capita entertainment in a city and corporate head offices
    6. Promotion: Quantity of articles, references of a city and recommendations online

    What’s perhaps unique about this study is that it combines measurable statistics with “visitor perception metrics” – data that they mined from social media. Here’s an excerpt from the methodology page:

    “Our team became interested in the way visitors and citizens themselves influence the identity and perception of cities. Increasingly, they do it through their evaluation of experiences on social media and via the comments, images and reviews they share with family, friends and people around the world. These opinions and attitudes, much more than traditional marketing, influence the way people perceive places today.”

    This is a fascinating shift for city brands and is something that we have discussed before on this blog. All of us are now involved in telling the story of the places in which we live and visit.

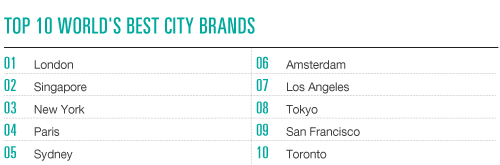
    The entire report is well done and worth a read. It’s also a free download (you’ll need to enter your contact info). But below are the top 10 world’s best city brands. Not really any surprises for me. What about for you?

    image

  • The rise of paradiplomacy

    In the words of Mike Bloomberg, then mayor of New York: “We’re the level of government closest to the majority of the world’s people. We’re directly responsible for their well-being and their futures. So while nations talk, but too often drag their heels, cities act”. Whereas diplomacy is carried out for the state, paradiplomacy is executed for the population.

    Rodrigo Tavares has an interesting article up at the World Economic Forum talking about the rise of foreign policy and international relations at the local level. The argument is that as cities rise (and they are certainly rising) paradiplomacy is inevitable.

    He admits that the diplomatic networks tend to be stronger for regions who have “flirted with sovereignty.” Regions such as Quebec, Catalonia, and Scotland are given as examples. However, this shift is by no means exclusive to them. Lots of examples in his article.

    It is also manifesting itself very differently compared to at the national level. And that’s part of the advantage. One example is London & Partners, which is an arm of the City of London that sells consulting services to other cities and nations who want to replicate its successes. Do nations do this?

    I have argued before on this blog that our governance structures do not accurately reflect today’s urban reality. Rodrigo’s article is a reminder that we continue to underestimate the role of cities in the global economy.

    I’ll end with this chart from his article:

    image