Daily insights for city builders, delivered every morning at 6 AM ET. I’m Brandon Donnelly — a Toronto-based real estate developer and founder of Globizen. I’ve been writing here since 2013.

Tag: sydney

  • Best new tall building of 2023

    The Quay Quarter Tower in Sydney has been just been awarded the “best new tall building” of 2023 by the Council on Tall Buildings and Urban Habitat (CTBUH). Deigned by 3XN and BVN, it’s a great adaptive reuse story.

    The project is a renovation and expansion of an existing 1970s building. And the team managed to retain 65% of the original structure (slabs, columns, and beams) and 95% of the original core.

    This results, according to their calculation, in 12,000 tons of embodied carbon savings. The equivalent of 35,000 flights between Sydney and Melbourne. At the same time, the team managed to add 45,000 m2 of new floor area to the site by grafting new slabs onto the existing ones.

    But let’s get back to these carbon savings.

    According to this site, there are 37 direct fights between Sydney and Melbourne each day. That’s about 13,505 flights per year, meaning that the carbon savings from not fully demolishing this building (and starting fresh) are equal to about 2.6 years of people not flying back and forth between these two cities.

    If you consider how long buildings typically last (this one was relatively young at under 50 years), it kind of makes buildings seem less bad. Of course, we’re only talking about and comparing embodied carbon. There’s also the ongoing operation of the building.

    In any event, a deserving project. Congrats to the team. For more on the project, click here.

    Photo via Dezeen

  • How Sydneysiders got to work in 2021

    I’m not sure how much you can actually glean from this Australian Bureau of Statistics data (taken from this recent New Geography article):

    The data was collected on August 20, 2021 and, at that time, there were still a number of pandemic lockdowns in place. But consider the fact that during the last census (2016), Sydney’s “work @ home” share was only 4.9% and that its transit share was 26.2%.

    Where Sydney is sitting today is obviously somewhere between where it was in 2016 and where it was in 2021. Who knows where exactly things stabilize — that is largely unknowable — but at least I got to use “Sydneysider” in a blog post title.

  • The fast-foodification of cities

    Greg Isenberg recently wrote about what he refers to as the fast-foodification of everything — including cities. His arguments are that (1) we have reached peak sameness (Toronto is largely indistinguishable from, say, Sydney) and (2) the best brands and companies going forward will be local, unique, and community-driven.

    I don’t know how to assess whether we have reached peak sameness, but I do know that, whatever we are experiencing right now, is at a minimum 100 years in the making. The International Style (of architecture), which emerged after WWI, is exactly what the name suggests. The intent was to fashion an approach to architecture that worked anywhere in the world. Location, climate, and context were all irrelevant.

    This approach has been widely criticized for the reasons you might expect and for the reasons that Isenberg outlines in his post. But sameness is not exclusively the result of European architects who wanted to eschew ornament and local flourishes. As the world continues to globalize and become “smaller”, there is an inevitability to this growing and continued sameness. Business wants economies of scale.

    But there is no question that, more than ever, people are craving unique and local experiences and places. And if you can create that in our globalized world, you are going to win.

  • An architect’s lot

    In this short video about the Harry and Penelope Seidler House in Sydney (which is a beautiful heritage-listed modernist house), Penelope talks about how her and her late husband, Harry, used to drive around looking for the ideal block of land in which to build their own home.

    When she begins to talk about the property they ultimately chose (pictured above), she is about to call it a challenging lot, but then immediately corrects and says that it is “an architect’s block” — it’s steeply sloping. I thought this was interesting for two reasons.

    One, there are countless examples of famous homes built into steep and sloping terrain. Think, for example, of the Douglas House by Richard Meier. A personal favorite. And two, I myself am drawn to these sorts of lots. Topography creates challenges, but also opportunities. It forces you to engage the site and also really study the section as you design.

    Is this really an architect thing?

    Image: Monocle

  • Short Lane in Surry Hills

    Just look at these deep cantilevered balconies and this board-formed concrete. Let’s also not forget the fine-grain retail and small mid-block laneway.

    Designed by Woods Bagot for Komplete Construction, the “Short Lane” project was completed in the Surry Hills neighborhood of Sydney in 2018. It has 22 suites — each with both north and south exposure — and is about 1,900 square meters in total. So the average suite size looks to be somewhere in the range of 80 square meters.

    Here’s a peak inside:

    And here are those cantilevered balconies again:

    I have no idea what the entitlement process is in Sydney for a project like this. If you do, please share it in the comments below. But this is undoubtedly an attractive scale and type of infill housing, something that I think should be encouraged and allowed as-of-right. No multi-year rezoning process. No complicated site plan process. Just cool infill housing.

    Photos: Woods Bagot

  • Qantas pilots new 20 hour ultra long haul flight from New York to Sydney

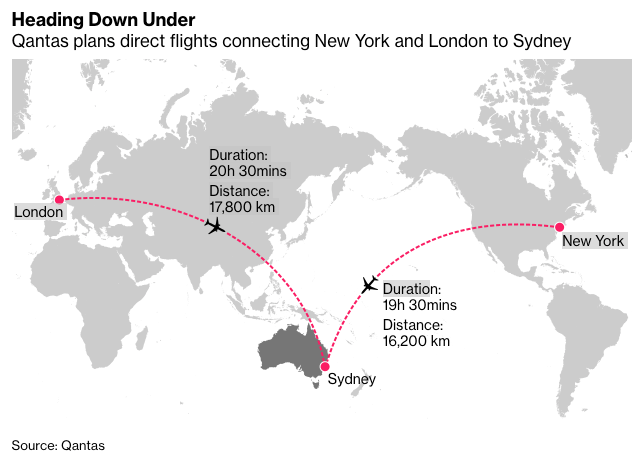
    Over the weekend, Qantas Airways set a new record with a nonstop ultra long haul flight from New York to Sydney. At a distance of 16,200 kilometers and a duration of 19 and a half hours, this is now the world’s longest flight. Though, this was still a test voyage. It remains to be seen whether this will be a commercially viable route. The company also plans to offer a similar ultra long haul from London.

    It’s fascinating to think about the logistics that go into a flight like this. The flight took off with its fuel tanks maxed out at 101 tons. But according to Wired, the loss factor on each additional ton of fuel is about 60% simply because of the additional weight. In other words, most of the incremental fuel to get all the way to Sydney just gets cannibalized by the heavier load. Wow. That doesn’t feel all that sustainable.

    Similarly, every ten passengers roughly equates to one ton (200 pounds per person). So there’s a balancing act between reducing weight (optimizing fuel consumption) and maximizing revenue (adding lots of people). There’s also a question of how best to price discriminate across economy, premium economy, and first class.

    Initially these ultra long haul flights were imagined to be flying hotels, where people could sleep, workout, and do all sorts of other things while they traveled halfway around the world. But the economics didn’t work. Too much wasted space on non-revenue generating items.

    The other interesting thing about these ultra long haul flights is how much work goes into passenger comfort, specifically around our body’s natural rhythms. Angus Whitley of Bloomberg was onboard this maiden voyage and he talks about how the food they served — spiced with things like chili and lime — was designed to fire up your clock when you shouldn’t be sleeping.

    And this isn’t new a feature of ultra long hauls. Qantas already employs things like hot chocolate laced with tryptophan in order to help people sleep onboard. I’m not great at sleeping on planes, generally because I don’t fit in the seats very well. But maybe it’s because I’ve been passing on the hot chocolate.

    Image: Qantas via Bloomberg

  • Prime residential pricing in 10 global cities

    The below graphs are taken from a recent (June 2019) report by Knight Frank on “prime” residential pricing across the world. They define “prime” as generally being the top 5% of each market by value. What these graphs show are the spread between the average price of a prime property and the top price achieved in that market.

    The most expensive market is Hong Kong. The average price of a prime property in 2018 was USD 4,251 per square foot (or USD 45,760 per square meter) and the top price achieved was in 2016 at USD 28,154 per square foot (or USD 303,051 per square meter).

    Using the 2018 average, a 350 square foot studio apartment would run nearly USD 1.5 million (or almost CAD 2 million), assuming there are “prime” studios available in the market. Remember, we are talking about the top end of the market.

    If you’d like to download a copy of the full report, you can do that over here.

  • Supply is up and rents are down in Sydney

    The Sydney Morning Herald recently reported that an oversupply of apartments has started to put downward pressure on rents and upward pressure on vacancy rates in the city. Here are a few excerpts from the article:

    Sydney is in the grip of an apartment building boom, with 30,880 multi-unit dwellings built last year, a record for any Australian city. There were 16 multi-unit projects finished in the first three months of 2019, adding another 1948 units.

    These numbers are flowing through Domain.com.au, where 17,500 units were listed for rent in June 2017, and ballooned to 32,680 listings in June 2019. The result has been landlords asking for $25 a week less median rent than last year.

    Sydney-wide rental vacancy rates have almost doubled from 1.7 per cent 2017 to 3.2 per cent this year. But on the upper and lower north shore, in the hills district and Sydney CBD, apartments are sitting vacant at more than twice this rate, SQM data shows.

    The narrative here is that you can build your way to lower rents. Make supply exceed demand, and this is what will happen.

    But in this case, something else has also impacted the demand curve: China.

    Beijing has made it harder to get money out of the country in recent years and their overall economy has slowed. China’s economy is thought to be growing at its slowest rate since 1992 (which is when the country started official record keeping).

    The above article suggests that about 80% of new construction apartments in Sydney were sold to investors over the last few years. More than a few were probably Chinese. Though I have no idea if that is an accurate number.

    What is unclear, to me, is whether this doubling of rental listings over the last two years is a result of previously bought supply simply making its way through the system, or if current market conditions have encouraged more owners to put their units up for rent.

    Whatever the case may be, supply is up and apartment rents appear to be coming off slightly in Sydney.

  • A new typology of cities

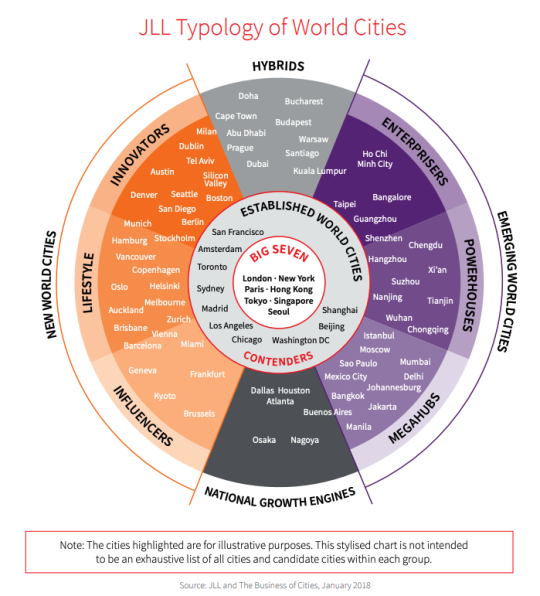
    Earlier in the week, my friend Rodney Wilts of Theia Partners sent me a JLL report called, World Cities: Mapping the Pathways to Success. I am admittedly only getting around to it now.

    The report proposes a new typology of world cities that looks like this:

    image

    It is based on 10 overall categories of cities, grouped into 4 main buckets. The first bucket is “Established World Cities”, within which there is the “Big Seven”, and then the “Contenders.”

    The Real Estate Highlights that accompany each category of city is a good place to start if you’re looking to do a quick scan of the report.

    Here’s a taste:

    One-quarter of all capital invested in commercial real estate globally currently lands in one of the “Big Seven” cities. And London and New York are easily at the top.

    Cities that recently graduated from “New World City” status – namely Toronto, San Francisco, Sydney, and Amsterdam – are all struggling to address housing and infrastructure deficits.

    “Lifestyle” cities – such as Vancouver, Auckland, and Oslo – are some of the most active investment markets. Biggest rental growth for prime offices (since 2000) in the “New World Cities” category.

    Click here for the full report.

  • Average January temperatures by global city

    In Edward Glaeser’s book, Triumph of the City, he argues that the average temperature in January is the single best variable to predict which U.S. cities have grown the most over the last century. Indeed, from July 2015 to July 2016, 10 of the 15 fastest growing large metro areas in the U.S. were in the south. Follow the sun and sprawl.

    Given this phenomenon, I thought it would be interesting to look at the world’s most influential cities (i.e. global cities) through this lens. Because let’s face it, New York and London aren’t all that warm in January. 

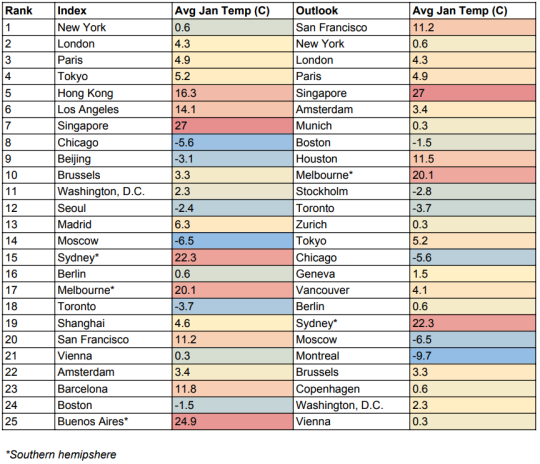
    Below are the top 25 global cities (taken from A.T. Kearney’s 2018 Global Cities Report), along with their average January temperature (taken from here). Note, there are two rankings. On the left is their global cities index. And on the right is their global cities outlook, which evaluates current potential. Cities that improved their economics & governance made the biggest leap on the right.

    image

    First of all, it’s interesting to see San Francisco jump so significantly in their outlook ranking. This has everything to do with tech and innovation. It’s also important to note that a handful of the above cities are located in the southern hemisphere, so “average January temperature” doesn’t mean the same thing (probably should have normalized to their winter).

    Montreal wins the award for the coldest city in this ranking. And there’s really only one city, Singapore, with a tropical climate. Though there are others, such as Hong Kong and Sydney, that would fall under subtropical. All of this isn’t enough for us to start inferring anything, but perhaps colder and more temperate climates aren’t such a bad thing for economic growth.