Daily insights for city builders, delivered every morning at 6 AM ET. I’m Brandon Donnelly — a Toronto-based real estate developer and founder of Globizen. I’ve been writing here since 2013.

Tag: shanghai

  • The sensing power of taxis

    The latest project out of MIT’s Senseable City Lab examines the “sensing power of taxis” in various cities around the world. Looking at traffic data, they determined how many circulating taxis you would need to equip with sensors if you wanted to capture comprehensive street data across a particular city. This might be useful if you wanted to measure things like air quality, weather, traffic patterns, road quality, and so on.

    What they found is that the sensing power of taxis starts out unexpectedly high. It would only take 10 taxis to cover 1/3 of Manhattan’s streets in a single day. However, because taxis tend to have convergent routes, they also discovered rapid diminishing returns. It would take 30 taxis (or 0.3% of all taxi trips) to cover half of Manhattan in a day, and over 1,000 taxis to cover 85% of it. A similar phenomenon was observed in the other cities that they studied: Singapore, Chicago, San Francisco, Vienna, and Shanghai.

    However, if you look at the percentage of trips needed to scan half of the streets in a city, Manhattan has the lowest rate at 0.3%. Vienna is the highest at 9%. But I’m not sure if this is a function of the utilization rate of their taxis or if it has something to do with urban form. Singapore has a similarly low rate (0.44%), but its street grid looks nothing like that of New York’s.

    Here’s a short video explaining the project:

  • The capital of the future: Shanghai

    Joe Berridge’s recent opinion piece in the Globe and Mail makes the case for why Shanghai is destined to become “the capital of future.” Brash city building, massive scale, and entrepreneurial hustle are among some of the reasons why he believes the city is on a path to global supremacy. And similar to other great capitals, it has benefited from a strategic geographic position on an important waterway — in this case the Yangtze River.

    By way of comparison, Toronto is said to be the fastest growing urban region in both North America and Europe right now. We add somewhere around 125,000 people each year. Shanghai, on the other hand, is adding between 700,000 and 800,000 people each year — much of it from internal migration. The city currently has a population of around 24 million people and it is expected to grow to somewhere between 35 and 45 million people by 2050. (Figures from the Globe.)

    Notwithstanding all of our successes as a global city region, as I was reading Berridge’s piece I couldn’t help but come back to this comparison. Shanghai opened its first subway line in 1993. Today it has one of the most extensive networks in the world; whereas, it would probably take Toronto this long to figure out if that first line should be light rail or a below-grade subway. And we haven’t even gotten to the number of stops yet.

    But that’s one of the differences between top-down and bottom-up city building: speed.

    Photo by Denys Nevozhai on Unsplash

  • Cumulative electric vehicle sales around the world

    When I was shopping for a new car last year I gave serious thought to buying an electric vehicle. In fact, it is what I initially set out to do. But I couldn’t find a model that I liked and I didn’t feel like the charging infrastructure was in place for me to go on snowboarding trips to places like Quebec or Vermont. So I went with an ICE vehicle. But we all know it is only a matter of time before we hit that tipping point, which is why 100% of the parking spots at our Junction House project will be ready for an electric vehicle charging station.

    According to a recent briefing from the International Council on Clean Transportation (ICCT), there were 3.1 million electric passenger vehicles in use around the world at the end of 2017. Almost all of them (98%) were located in China, Europe, Japan, and the United States, and nearly half of them (44%) were located in just 25 cities. Shanghai leads the world (or at least it did at the end of 2017) with 162,000 cumulative sales since 2011. This represents 5% of all global electric vehicle sales during this time period.

    The footnote to this is that most of Shanghai’s electric vehicles are actually plug-in hybrid electric vehicles, whereas in the case of Beijing — which is second only to Shanghai in terms of cumulative sales — it is virtually all battery electric vehicles. Digging even deeper, if you look at the share of electric vehicles sales in each city, it becomes clear that, on a per capita basis, the real leader is actually Norway. Between 40-50% of all cars sold in Oslo and Bergen were electric in 2017.

    Here is a chart from the ICCT:

    What is clear from these leading cities is that there are supportive policies and incentives in place to accelerate the adoption of electric vehicles. The chicken-and-egg dilemma, which is what I ran into, is that you really need the installed charging capacity. The ICCT estimates that the top 25 electric vehicle markets have about 24x the available charging per capita compared to other cities. That certainly helps.

  • China has a lot of people

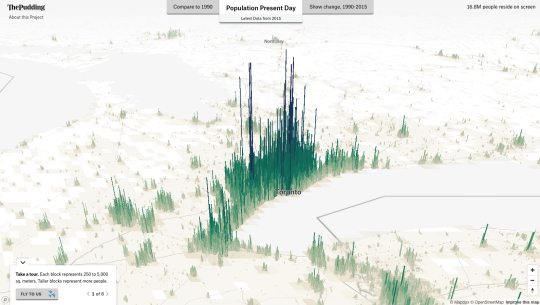
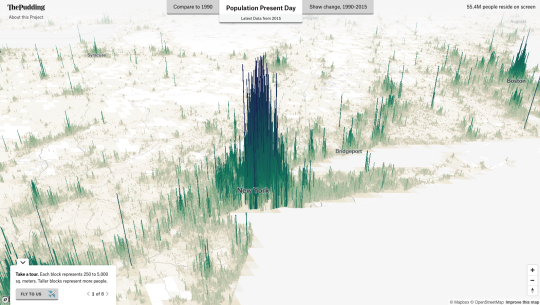
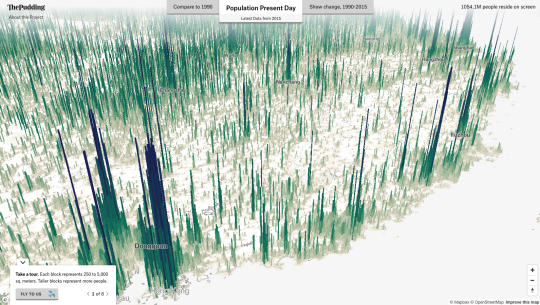
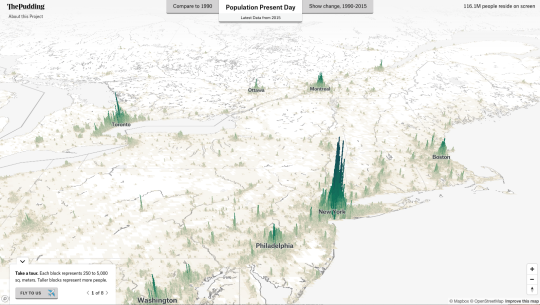
    Matt Daniels over at The Pudding recently visualized the world’s population in this spiky 3D map. You need to take a look. Better on desktop.

    The data is from 2015, but you can also compare it to and show the change from 1990.

    Here is the Greater Toronto and Hamilton region (16.8 million people reside in this screen grab):

    Here is the New York City region (55.4 million people reside in this screen grab):

    And here is China (1.054 billion people reside in this screen grab):

    I tried to capture both Shanghai and Hong Kong in this image. Guangzhou, Hong Kong, and Shenzhen are currently in the mist of forming a 40 million-person megalopolis.

    If we pan back over to the northeastern United States and Central Canada – keeping the same scale as the above image from China – it looks like this:

    These last two images say a lot. 

  • Price of 432 square feet in Hong Kong and the future of the region

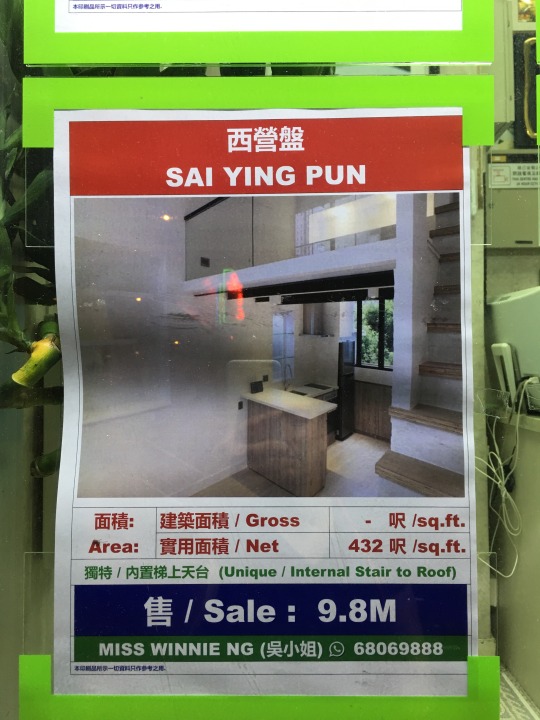
    I came across this Hong Kong apartment listing earlier in the week. Sai Ying Pun is the neighborhood.

    image

    HK$9.8 million = C$1,554,833 based on today’s exchange rate (1 CAD = 6.30293 HKD).

    At 432 square feet (net), that’s C$3,599 psf. But I have also been told that new buildings here could easily fetch C$5,000 psf and probably much more.

    There’s certainly a tremendous amount of wealth in Hong Kong. However, the topic of discussion right now is the new money being generated in mainland China.

    I am curious what all of this could mean for Hong Kong, it’s place within the PRC, and for real estate long-term.

    Hong Kong’s Basic Law stipulates that the region shall maintain a capitalist system and that its current way of life shall be preserved outside of the PRC. 

    But that constitutional document is set to expire in 2047 – fifty years after the handover from the British. And one would assume that China would favor more, rather than less, integration. 

    Already the Cantonese language – the official language of HK along with English – seems to be getting diluted in favor of the “speech of the officials.”

    So what will Hong Kong look like by the middle of the 21st century? Will it simply become a “second city” to Beijing and Shanghai?

    Place your bets in the comments below. Or call Miss Winnie.

  • 738,000 single-family homes were built last year in the US

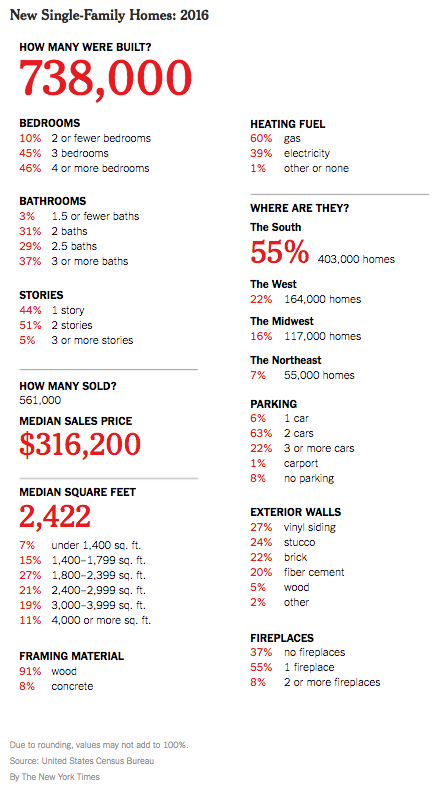
    The New York Times recently published “a portrait of new single-family homes” in the US in 2016. Here’s that portrait:

    For those of those living in dense urban centers, this portrait is perhaps a reminder that in many other places a large single-family home can be had for about the price of a studio apartment.

    Nothing in the above portrait likely surprised you, but it’s interesting to note that over half of all new single family homes delivered last year were in “The South.” Only 7% were built in the dense northeast.

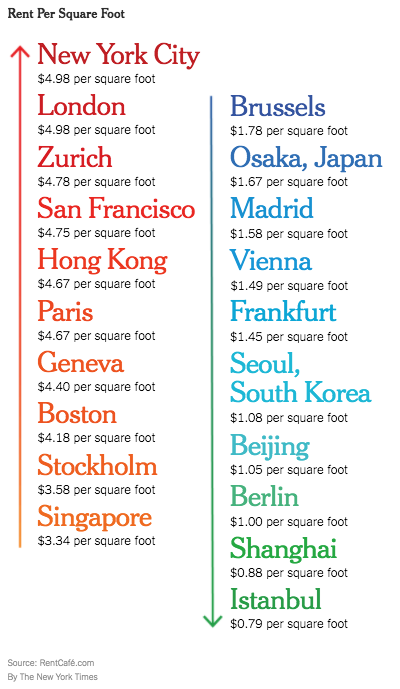
    The New York Times also recently looked at “international rents per square foot” using data from RentCafe. Here they are:

    New York City sits at the top with an average rent of $4.98 psf. This is across all boroughs. I am surprised by how low some of these international rents are. But averages rarely tell you the whole story.

    In any event, I do think that these two graphics start to speak to the economic spikiness that we are seeing across the US. 

  • The rise of paradiplomacy

    In the words of Mike Bloomberg, then mayor of New York: “We’re the level of government closest to the majority of the world’s people. We’re directly responsible for their well-being and their futures. So while nations talk, but too often drag their heels, cities act”. Whereas diplomacy is carried out for the state, paradiplomacy is executed for the population.

    Rodrigo Tavares has an interesting article up at the World Economic Forum talking about the rise of foreign policy and international relations at the local level. The argument is that as cities rise (and they are certainly rising) paradiplomacy is inevitable.

    He admits that the diplomatic networks tend to be stronger for regions who have “flirted with sovereignty.” Regions such as Quebec, Catalonia, and Scotland are given as examples. However, this shift is by no means exclusive to them. Lots of examples in his article.

    It is also manifesting itself very differently compared to at the national level. And that’s part of the advantage. One example is London & Partners, which is an arm of the City of London that sells consulting services to other cities and nations who want to replicate its successes. Do nations do this?

    I have argued before on this blog that our governance structures do not accurately reflect today’s urban reality. Rodrigo’s article is a reminder that we continue to underestimate the role of cities in the global economy.

    I’ll end with this chart from his article:

    image

  • Prime property appreciation around the world

    Every year for the last decade, Knight Frank has published something called The Wealth Report. I’ve written about it before, but it’s basically a look at “prime property” and global wealth.

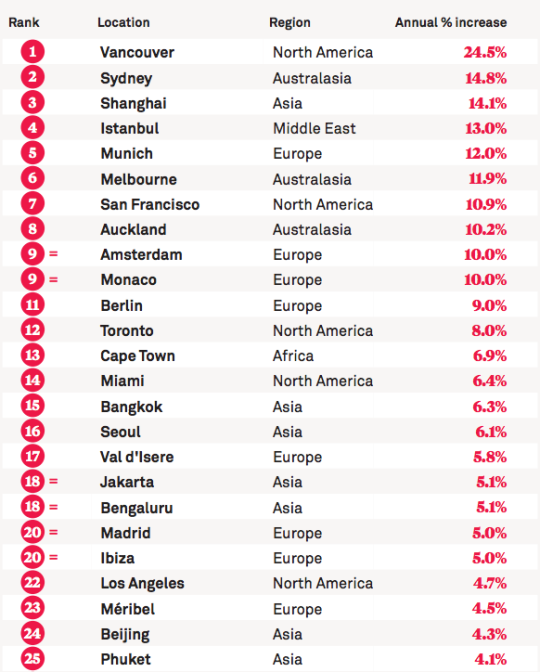
    As part of the report, they have something called the PIRI 100. It’s their “Prime International Residential Index”, which looks at luxury residential property prices around the world. They generally define “prime property” as being the top 5% of each market according to value.

    This year, the top 25 locations in their PIRI 100 are as follows (for the most part, the data is up to December 2015):

    image

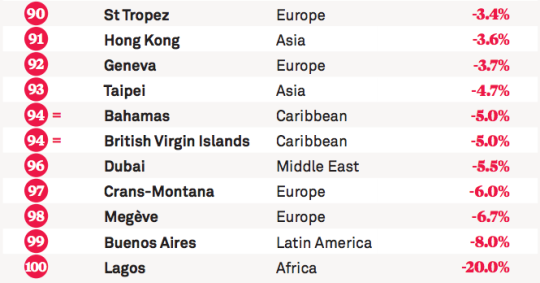
    Here in Canada, we like to talk about the insanity of the Vancouver and Toronto real estate markets. This list helps to put that into perspective. Even by global standards, Vancouver is at the top of the pack by quite a significant margin. 

    It’s worth noting that since this is a “prime property” index, it’s pretty safe to assume that the buyer profiles for these sorts of properties would have a significant international bias. So in a way, this list is really about global capital flows.

    Here are the bottom 10 locations on this year’s list:

    image

    If you’d like to see the full list, click here.

  • A new era of (digital) globalization

    McKinsey recently published a report called Digital globalization: The new era of global flows.

    The overarching thesis is that we are transitioning to a data-driven global economy:

    “Flows of physical goods and finance were the hallmarks of the 20th-century global economy, but today those flows have flattened or declined. Twenty-first-century globalization is increasingly defined by flows of data and information. This phenomenon now underpins virtually all cross-border transactions within traditional flows while simultaneously transmitting a valuable stream of ideas and innovation around the world.”

    One of the benefits of this shift is that it has become easier for emerging economies and individuals from all around the world to participate.

    Of course, not all countries and cities are participating equally. In their report, McKinsey ranks the top cities according to five global flows. In each case a proxy was used:

    “Unfortunately, data on global flows are not available at the city level. However, we have obtained data that serve as proxies for each of our five global flows. Container port volumes approximate goods flows; airport passenger volumes serve as a proxy for goods, service, and people flows; the ranking of cities in the Global Financial Centers Index by the Z/Yen Group provides an indication of financial flows; the number of foreign-born residents in a city measures people flows; and Internet bandwidth approximates data flows.” 

    Using this methodology, they believe that the world only has 8 truly global cities right now: New York, Los Angeles, San Francisco, London, Singapore, Shanghai, Hong Kong, and Dubai. They are the colored cities listed below:
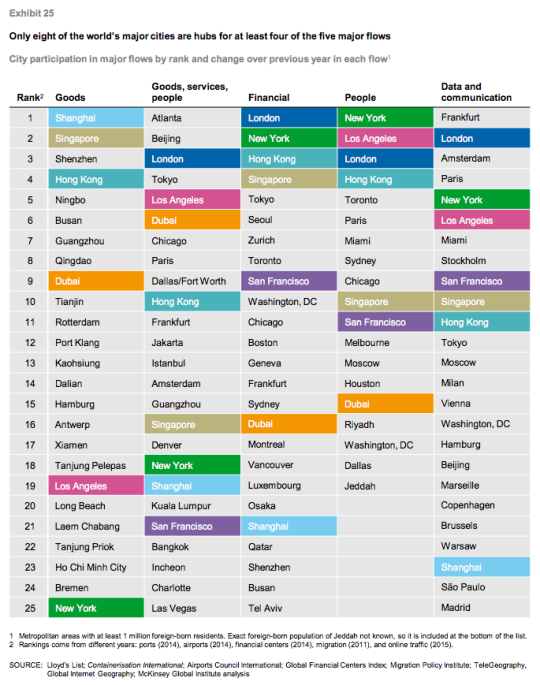
    I always take these city rankings with a grain of salt. This stuff is not easy to quantify and a lot depends on the methodology that you use. 

    For instance, Atlanta sits on the top of “goods, services, and people” because it has the busiest airport in the world according to passenger volume. (It’s the primary hub of Delta Air Lines.) But is that enough to assert that Atlanta is #1? Maybe. Maybe not.

    In any case, the report is packed full of information. If you’d like to take a look, click here.

  • Residential population densities compared

    The following diagrams were taken from LSE’s Urban Age website. I’ve sorted them from lowest to highest peak residential population density. In each case I’ve also included the year of the dataset. 

    It’s amazing how much these simple extrusion diagrams can tell you about the city. It also shows you that high population densities don’t necessarily need to equate to tall buildings. Barcelona, in particular, stands out for me.

    Berlin (Peak residential density: 21,700 people/km2, 2009)

    image

    Stockholm (Peak residential density: 24,900 people/km2, 2012)

    image

    London (Peak residential density: 27,100 people/km2, 2013)

    image

    São Paulo (Peak residential density: 29,380 people/km2, 2009)

    image

    Mexico City (Peak residential density: 48,300 people/km2, 2009)

    image

    Barcelona (Peak residential density: 56,800 people/km2, 2013)

    image

    New York (Peak residential density: 59,150 people/km2, 2012)

    image

    Shanghai (Peak residential density: 74,370 people/km2, 2011)

    image

    Istanbul (Peak residential density: 77,300 people/km2, 2013)

    image

    Hong Kong (Peak residential density: 111,100 people/km2, 2013)

    image

    Mumbai (Peak residential density: 121,300 people/km2, 2013)

    image