Daily insights for city builders, delivered every morning at 6 AM ET. I’m Brandon Donnelly — a Toronto-based real estate developer and founder of Globizen. I’ve been writing here since 2013.

Tag: real estate

  • A sensible purchase price

    “Investing is an activity in which consumption today is foregone in an attempt to allow greater consumption at a later date. “Risk” is the possibility that this objective won’t be attained.” -Warren Buffet

    Warren Buffet published his annual letter to Berkshire Hathaway shareholders this past Saturday. I always enjoy reading his letters and I have been doing it for years. If only he wrote a daily blog.

    One of the things he talks about in this year’s letter is why Berkshire wasn’t very acquisitive in 2017:

    In our search for new stand-alone businesses, the key qualities we seek are durable competitive strengths; able and high-grade management; good returns on the net tangible assets required to operate the business; opportunities for internal growth at attractive returns; and, finally, a sensible purchase price.

    That last requirement proved a barrier to virtually all deals we reviewed in 2017, as prices for decent, but far from spectacular, businesses hit an all-time high. Indeed, price seemed almost irrelevant to an army of optimistic purchasers.

    Some of you in the real estate game might be feeling similarly. But he ends the section with these words of advice: 

    In the meantime, we will stick with our simple guideline: The less the prudence with which others conduct their affairs, the greater the prudence with which we must conduct our own.

    Buffet has a way of simplifying things. He also, clearly, has a way of remaining disciplined.
  • Only 2 new single-family homes sold in Toronto last month

    Altus Group just released its January (2018) sales figures for the new home market in the Greater Toronto Area.

    – 1,251 new homes sold last month. 886 of these (or 70.8%) were condominium apartments (everything from stacked townhouses to high-rises).

    – This is down from 2,429 homes in 2017 and 2,118 homes in 2016.

    – Almost half of the new home sales (609 homes) came from Toronto alone. And almost all of these (607 homes) were condominium apartments. Only 2 new single-family homes sold in the city last month.

    – Benchmark price for single-family homes was $1,229,454, which is a 19.6% increase from January 2017.

    – Benchmark price for condominium apartments was $714,430, which is a 40.8% increase from January 2017.

    That last increase really stands out. I did a double take.

    But as we’ve talked about before, low supply and high prices seem to be pushing more buyers toward condos – and larger ones at that.

    Recently we’ve been seeing an increase in both average unit sizes and prices per square foot.

    According to Altus, sales of new single-family homes in the GTA last month were the lowest for a January since before 2000.

  • Jets and real estate

    Jackson Hole Airport (JAC) has one runway. It is 6,300 feet long by 150 feet wide and it was originally constructed in 1959. In 1965, the first of many proposals was put forward to lengthen the runway to 8,000 feet so that jets could fly into the airport. But it was never adopted. Subsequent proposals were made in 1992 and 1999, but they were again highly contentious and similarly never adopted. The runway remains 6,300 feet long.

    However in the early 1980s jets began using the existing runway and the area started to boom. According to this old New York Times article from 2002, the town’s growth exactly parallels the introduction of jet service at JAC. The town doubled from 9,000 people in 1980 to 18,000 people in 2000. Its per capita income also shot up from a steady $20,000 in 1984 to more than $67,000 in 2011 – making Teton County one of the richest in the US.

    Tourism destinations and second home markets like Jackson Hole are heavily dependent on access. In 2003, a total of 211,788 passengers flew through JAC airport and, in 2016, it was over 340,000 people. But second home markets are also the first to get hit during macroeconomics shocks. Following the 2008 financial crisis, passenger volumes at JAC didn’t recover until 2014.

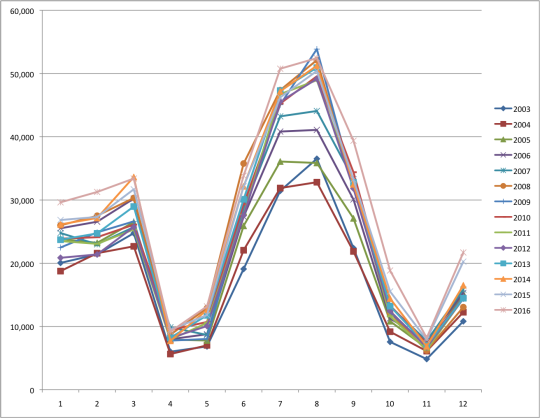
    If you look at air traffic throughout the year you’ll also see that it is highly seasonal. Below is a chart showing monthly passenger volumes at JAC from 2003 to 2016 (data from the Bureau of Transportation Statistics). Some of you may be surprised to see that more people visit Jackson Hole in the summer, compared to the winter. But what’s perhaps even more conspicuous is the sharp drop off during the swing seasons.

    image

    I am thinking about all of this not only because I just got back from Jackson Hole, but also because I am very interested in the demand drivers that fuel the real estate in many of these mountain towns. It’s easy to get it wrong. Unlike major urban centers – which often operate under a perpetual supply deficit – you can’t just build and necessarily expect people to come.

    Revelstoke Mountain Resort, for instance, first opened in 2007 with grand aspirations of building one of the largest ski resorts in North America. But they got crushed in 2008 and have never fully recovered – at least relative to their original plans. Maybe the answer is a bigger airport.

  • Price of 432 square feet in Hong Kong and the future of the region

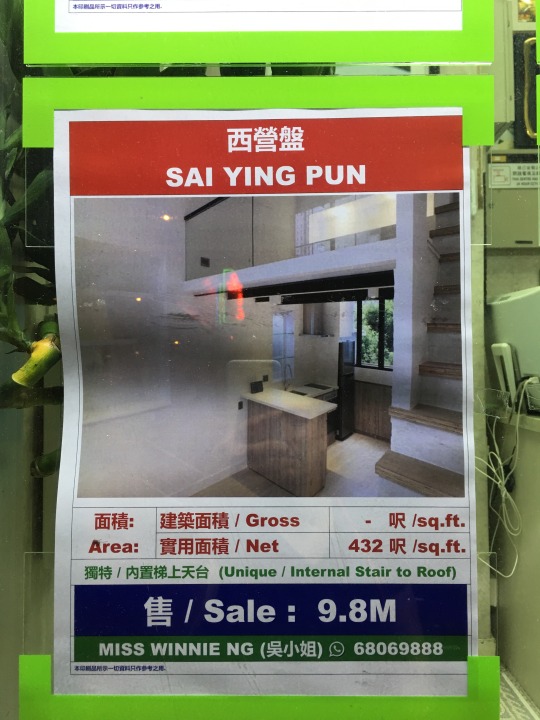
    I came across this Hong Kong apartment listing earlier in the week. Sai Ying Pun is the neighborhood.

    image

    HK$9.8 million = C$1,554,833 based on today’s exchange rate (1 CAD = 6.30293 HKD).

    At 432 square feet (net), that’s C$3,599 psf. But I have also been told that new buildings here could easily fetch C$5,000 psf and probably much more.

    There’s certainly a tremendous amount of wealth in Hong Kong. However, the topic of discussion right now is the new money being generated in mainland China.

    I am curious what all of this could mean for Hong Kong, it’s place within the PRC, and for real estate long-term.

    Hong Kong’s Basic Law stipulates that the region shall maintain a capitalist system and that its current way of life shall be preserved outside of the PRC. 

    But that constitutional document is set to expire in 2047 – fifty years after the handover from the British. And one would assume that China would favor more, rather than less, integration. 

    Already the Cantonese language – the official language of HK along with English – seems to be getting diluted in favor of the “speech of the officials.”

    So what will Hong Kong look like by the middle of the 21st century? Will it simply become a “second city” to Beijing and Shanghai?

    Place your bets in the comments below. Or call Miss Winnie.

  • 2017 year in review

    I just finished going through my list of 2017 goals. I didn’t accomplish everything I wanted to, but I did manage to check off a number of professional and personal goals.

    Some of the remaining goals have been pushed to 2018. But there are also items that I have since realized aren’t worth pursuing and so I have dropped them from the list.

    All that said, it was a great year. Here is a rapid-fire summary of 2017 told through posts from this blog.

    Thanks for reading. Onward my friends.

  • The most expensive housing market in the world

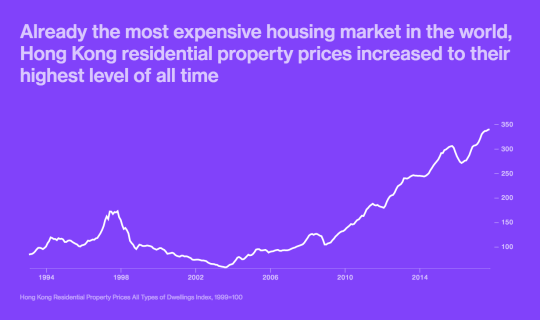
    It’s that time of year again. Time to get contemplative about the last year. Bloomberg recently posted this: 2017 – The Year in Money. Below is a capture from the real estate section.

    Here you can see the run up to the 1997 Asian financial crisis and also the Hong Kong “handover”. Initially, I thought the uncertainty of the handover would have reduced demand, but I guess there were other factors.

    According to the book Hong Kong 20 Years after the Handover, the property and stock markets at the time were being fuelled by high inflation and low interest rates. This made real interest rates negative and created a strong incentive to borrow and invest.

    I love seeing longer range indices because it helps to put things into perspective. If you started your career in real estate in Hong Kong around 2003-2004, you might think that prices generally always go up. 

    But consider how long it may have taken to get back to where you were if you had instead bought at the peak of 1997-1998.

  • Notes from the retail apocalypse

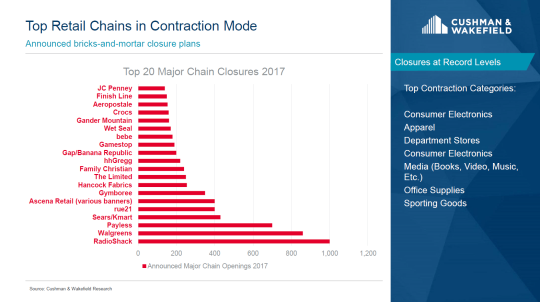
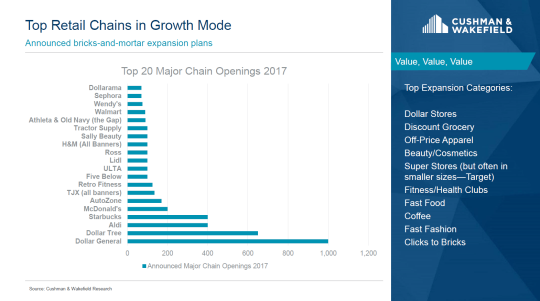
    A friend of mine was in Scottsdale last month for an ICSC conference where Garrick H. Brown (VP of Retail Research for the Americas at Cushman & Wakefield) delivered this retail presentation

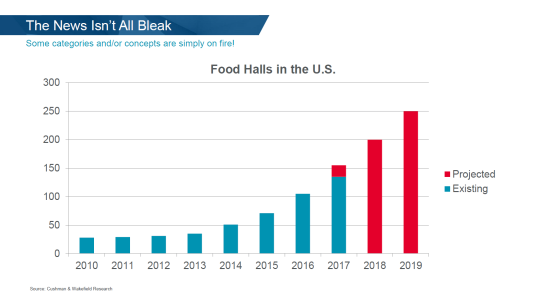
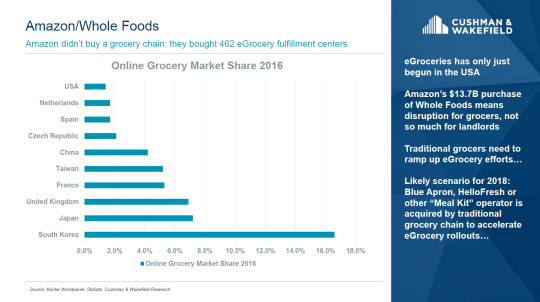
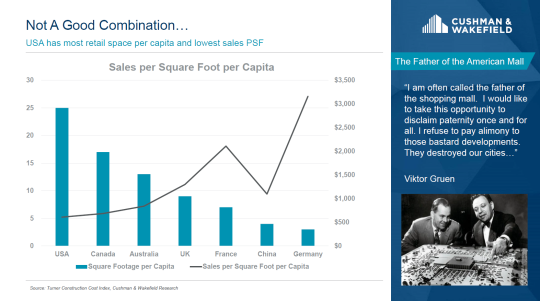
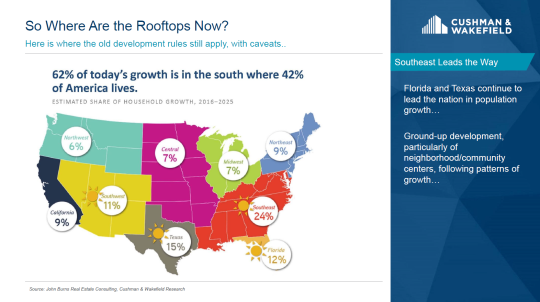
    My friend flipped it to me this week and below are a couple of slides that stood out as I scanned through it.

    image

    Apparently over the last five years, a new dollar store has opened every four hours in the US. That’s how quickly this category is growing. A race to the bottom.

    image

    Food halls are hot and not just in the US. Check out: “5 huge food halls opening soon in Toronto”.

    image

    This is similar to a chart I posted a few weeks ago that pegged online grocery shopping in South Korea at closer to 20%. I’m still fascinated by this market share number and want to better understand what’s driving it.

    image

    This is an interesting chart that shows the relationship between retail square footage per capita and sales per square foot per capita. The US has lots of retail space per capita but low sales. Now look at Germany.

    image

    Finally, this is a chart that shows where household growth is expected to happen from 2016 to 2025. It follows a very clear historical trend of Americans moving from cold places to warmer/hot places.

    image

    For the full presentation, click here.

  • Inclusionary zoning is coming to Ontario

    On Monday the province of Ontario posted a draft regulation intended to establish a framework for inclusionary zoning. It builds on a bill that passed last year allowing municipalities – should they choose – to require affordable housing in new developments and redevelopments.

    Below are some, but not all, of the things that are being considered in the draft regulation. Some of these items were recommendations made by the development industry through the Ontario Home Builders’ Association (OHBA) and the Building Industry and Land Development Association (BILD).

    – The total number of affordable units or gross floor area dedicated to affordable housing units would not exceed 5% of the total units or 5% of the total gross floor area (excluding common areas). This number increase to 10% in high density transit station areas.

    – The affordable period would be a minimum of 20 years but no greater than 30 years.

    – There may be opportunities to provide the inclusionary zoning units off-site.

    – The policies would only apply to developments / redevelopments with 20 or more units.

    – The affordable component could not be used to determine community benefits under Section 37. Section 37 would also not apply if the proposed development (with IZ) is in a location where a development / community planning permit is used.

    – Municipalities would be required to offer incentives to help offset the IZ cost burden, but only if the development is not subject to a development / community planning permit. The incentives could include a waiver or reduction in application fees, parkland dedication fees, development charges, and so on. These offsets are very important to the industry and the affordability of the market rate units. But interestingly enough, increases in height and/or density are not being contemplated as a possible incentive or financial contribution.

    – The financial contribution would be based on the following formula: (A – B) x 0.4. A is the total sum of the average market price for all of the affordable housing units and B is the total sum of the affordable price for all of the IZ housing units. In other words, the intent is that municipalities would be required to offset 40% of the costs associated with providing the affordable units.

    Click here for the rest of the draft regulation. The OHBA also published this media release following the draft. They like the “partnership model” but were advocating for a 50/50 public/private cost share on all government-mandated units.

    If you’re looking for more reading on inclusionary zoning, check here, here, and here.

    Photo by Omair Khan on Unsplash

  • Reprivatization in Warsaw is a double-edged sword

    The Guardian has just published a fascinating article about the reprivatization of property in Warsaw. This is the process by which previously nationalized property is returned to pre-communist owners, or their heirs.

    Not surprisingly, the government gets a lot of these sorts of claims, though many of them are clearly bogus. Between 2007 and 2017, Warsaw City Hall estimates that 447 properties, representing about 4,479 dwellings units, were reprivatized.

    For some, all of this is restitution for widespread expropriation during the communist era. But for others, it quite simply means eviction. 

    The story at the beginning of the article – about a family who is immediately evicted from their apartment and has their belongings thrown out – seems almost hard to believe. One would think that there would be more sensible transition policies in place.

    Another negative has to do with the uncertainty that this creates in the market. Why would you buy and/or invest in a property if there was any inkling that it could be taken away from you? You wouldn’t. 

    Click here to read, ‘They stole the soul of the city’: how Warsaw’s reprivatisation is causing chaos. If any of you are familiar with the Warsaw property market, please do leave a comment below.

  • Federal court upholds decision that TREB’s housing sales data should be available online

    The Toronto Real Estate Board (Canada’s largest real estate board) and the Competition Bureau have been fighting for years over whether TREB’s housing market sales data, including realtor commissions, should be publicly available online.

    The Competition Bureau, as well as many forward thinking realtors, believe that gatekeeping historical sales data is stifling competition and innovation. It is. But TREB has been arguing – for a number of years I might add – that it is genuinely concerned about consumer privacy.

    Well on Friday the Federal Court of Appeal ruled that TREB cannot prevent its members from freely publishing data about what properties have sold for. This is a positive, albeit a small, step forward for open data and innovation.

    But perhaps not surprisingly, TREB has already said it would appeal the decision to the Supreme Court of Canada and apply for an order staying the release of the above data until this new appeal gets decided.

    So there’s still more fighting to take place. Nevertheless, I do have a few thoughts.

    The claim by TREB that they are deeply concerned about consumer privacy is nonsense. Call up any realtor in this city and they’ll tell you and send you whatever historical sales data you want. This is about maintaining an information asymmetry that forces more consumers to connect with agents.

    But as many sensible realtors have already explained publicly in the media, if gatekeeping information is such a critical component of the value that TREB members bring to clients – and the board is certainly clinging to it – then realtors and/or the industry have a serious problem on their hands. 

    Time to evolve.

    I would also argue that our current archaic setup distorts the market. There’s simply too much friction associated with accessing good sales records and so the result is greater opacity in the market. Say all you want about the efficacy of realtors, more friction = less engagement. Free the data and empower members to leverage and build on top of it.

    In my view, this is a positive step forward. But it still feels like a small one. I’m actually surprised by how long this status-quo battle has been going on. Hopefully it gets wrapped up soon so everyone can get on with what matters most: innovating.

    Photo by Fernando Reyes on Unsplash