Daily insights for city builders, delivered every morning at 6 AM ET. I’m Brandon Donnelly — a Toronto-based real estate developer and founder of Globizen. I’ve been writing here since 2013.

Tag: philadelphia

  • International and domestic migration in the US

    In response to President Trump’s proposed immigration bill, Brookings recently analyzed census data from earlier this year to demonstrate the importance of immigration for growth within much of the United States. 

    I’d like to share three tables from their analysis.

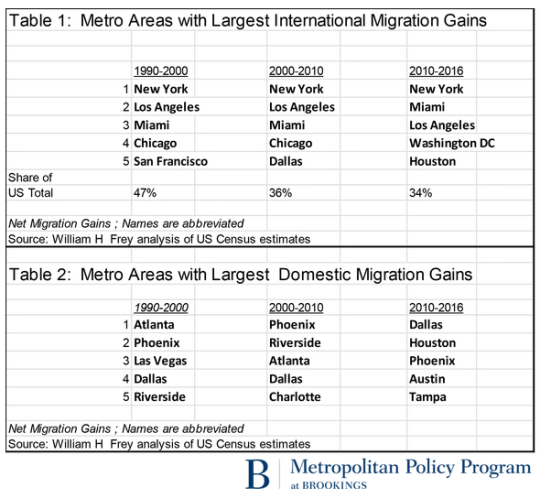
    The first two look at international migration grains and domestic migration gains over the last 3 decades (the last decade isn’t quite a decade).

    Here you can see that New York, Los Angeles, and Miami (all port cities) have dominated international migration to the US since 1990. But at the same time, international migration has become less geographically concentrated. From 1990-2000 the top 5 cities received almost half of all immigrants moving to the US. More recently, that number has dropped to 34%.

    Domestic migration is different in that it’s a zero sum game. When one US city gains, another US city loses. Here there is a very clear migration trend toward cities in the southwest – arguably because of weather, job growth, cheaper housing, and probably a bunch of other factors.

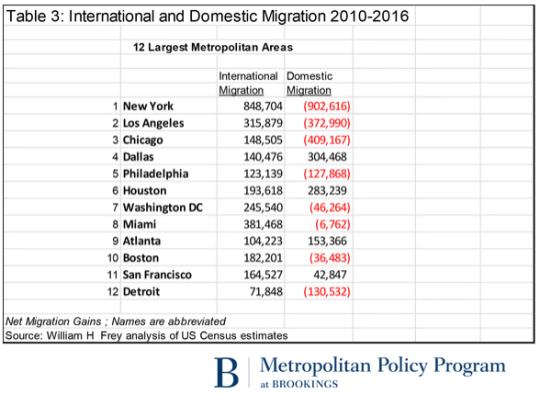
    If we look at actual international and domestic migration numbers over the last 6 years, the 12 largest metropolitan areas look like this:

    The key takeaways here are that 8 of these cities are losing people to domestic migration and only 7 of these cities have a positive net migration number – meaning their population is actually growing.

    What is clear is that the international migration column is a pretty important one if you believe that growth is valuable. 

    If you’re Dallas, Houston or Atlanta, maybe you care a little less about that column. But for most of the other cities, international migration is either the only way you’re growing (look at Miami go) or keeping your population losses in check (see Philadelphia).

  • Powerhouse: A case study in neighborhood infill

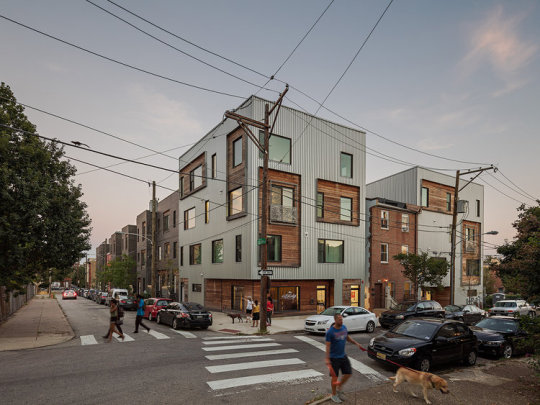
    Dezeen recently featured the above project in Philadelphia by Interface Studio Architects. It’s called Powerhouse and the goal was to provide a variety of different housing typologies and tenures within a dense infill project that, at the same time, remains in keeping with its context.

    The full block complex contains 31 residential units, which are a mixture of apartments, duplexes (stacked towns), live/work units, and single-family townhouses. There’s also a corner retail space. 10 of the units are rental and the balance are for sale. The development also incorporates 3 existing rowhouses on the block. (Were these the holdouts?)

    Here is a diagram from ISA to give you a sense of how these different housing types come together:

    The project feels germane to Philly’s urban fabric and it is certainly interesting in its own right. But for those of us from Toronto, it’s perhaps even more interesting because it’s a scale of infill development that we don’t see very often in this city: low-rise intensification. (Also commonly referred to as “The Missing Middle”.)

    Recently I’ve been speaking with a number of people about whether or not Toronto should be thinking differently about its low-rise neighborhoods. Because as it stands today, even this sort of gentle density can cause quite a stir

    Two thoughts immediately come to mind – one of which will not surprise anyone who reads this blog. Firstly, I see laneway housing as an elegant way to intensify low-rise neighborhoods without changing their character. That’s why I’m proposing this house.

    Secondly, I have long felt that we should rethink how we treat arterial roads that are not designated as “Avenues.” That is, we should encourage greater densities. An “Avenue” designation signals mid-rise. But absent this, our policies are frankly retrograde, given the way some of these arterial streets have evolved over the years.

    What are your thoughts about this scale of infill?

    Images: ISA

  • State of Center City, Philadelphia

    The Center City District and Central Philadelphia Development Corporation recently published a report called: State of Center City 2016. The objective was to measure the progress being made in Philadelphia’s downtown. 

    I moved out of Center City (Rittenhouse Square) in 2009, but I still like to follow what’s happening. I really enjoyed my time in Philly. In fact, I remember missing its immensely walkable downtown after I returned to Toronto and touched down in the suburbs briefly before moving back downtown.

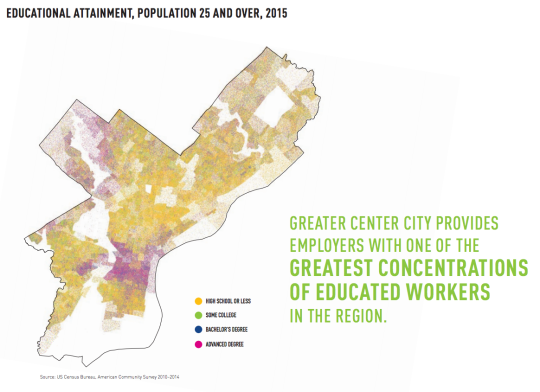
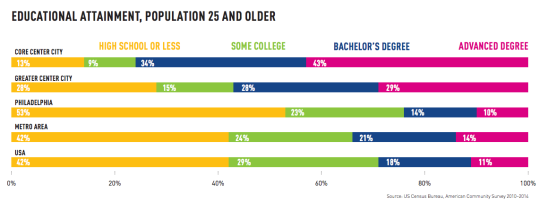
    If you take a look at the report, one of the first things you’ll probably notice is the concentration of jobs and the concentration of knowledge works (with advanced degrees) in the Center City area. We are seeing this shift in so many cities around the world.

    Here are a few graphics (all of which are from the report):

    imageimage

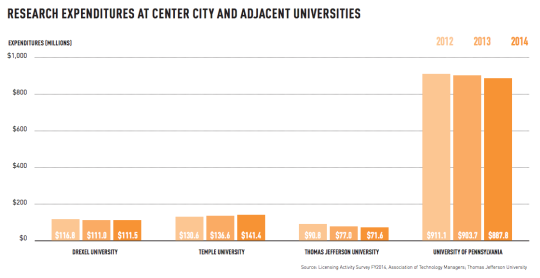
    Part of the reason for this is that Center City is anchored by a number of fantastic Universities. This is critical for cities, today.

    image

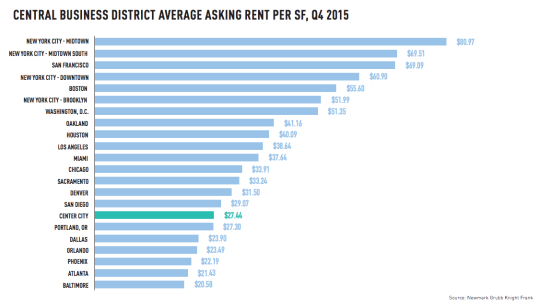
    To end this post, I thought I would post the below comparison of average office rents in major CBDs across the US. I always find these charts interesting, even though the usual suspects are up at the top.

    image

    I hope you’re all having a great holiday weekend.

  • Enemies of the High Line

    Despite not being the first example of infrastructural adaptive reuse, the High Line in New York has certainly kickstarted an urban trend. Cities all around the world now want their own “version of the High Line.”

    Philly is working on a new “rail park.” I toured the space last summer and it’s very similar to the High Line in terms of existing infrastructure. Rome and Toronto are both working on “under” spaces, which are beneath an old viaduct and elevated expressway, respectively. And the list goes on.

    But I think it’s worth remembering just how contentious the High Line was before it was built. For some people it was just an eyesore and a public safety hazard. Here’s a excerpt from a New York Times article dated 2002:

    “This is a terrific win for us,” said Michael Lefkowitz, a lawyer for Edison Properties, one of 19 businesses that own land beneath the High Line.

    Janel Patterson, a spokeswoman for the city’s Economic Development Corporation, said an agreement to share the $11 million cost of dismantling the High Line was being circulated among the property owners and the rail bed’s owner, CSX, of Richmond, Va. “It’s about eliminating a public safety hazard,” Ms. Patterson said, “but it’s also about enabling the city to move forward and better develop the area.”

    It’s also worth mentioning that former Mayor Giuliani supposedly favored demolition of the High Line. Former Mayor Bloomberg, however, did not:

    …Mr. Bloomberg said: "Today, on the West Side of Manhattan, we have an opportunity to create a great new public promenade on top of an out-of-use elevated rail viaduct called the High Line. This would provide much-needed green space for residents and visitors, and it would attract new businesses and residents, strengthening our economy. We know it can work … . I look forward to working with Friends of the High Line and other interested parties to develop a feasible reuse scenario.”

    The challenge with these sorts of things – that is, new ideas – is that we live in a world of proof and precedents. We want to see that it has been successfully done before, because, otherwise, we might be wrong. So now that New York has shown what is possible, it has cleared the way for other cities.

    Rethinking old infrastructure is a sound urban strategy. But we also shouldn’t forget that it’s less valuable to be right about something that every other city already believes to be true. The real value is created when you’re right about something that most other cities don’t yet believe.

  • A short history of redlining

    In 1933, the United States Congress created the Home Owners’ Loan Corporation (HOLC). With foreclosures rising as a result of The Great Depression, the task of the agency was to provide new low-interest mortgages to both homeowners and private mortgage lenders. Between 1993 and 1936, the agency served about one million households.

    By 1935, the parent company of the agency (the Federal Home Loan Bank Board) decided to initiate something called the “City Survey Program.” The idea was to look at local real estate trends – including the racial and ethnic composition of the country’s largest cities – in order to get a better understanding of how to manage all of these outstanding loans.

    One outcome of this program was the creation of the HOLC’s infamous “residential security maps.” (Philadelphia’s is shown at the top of this post.)

    These were maps that categorized city neighborhoods according to 4 grades. Grade A neighborhoods (green) were the best ones. They were ethnically homogenous and had room to be further developed. Grade B neighborhoods (blue) were the second-best ones. They were already completely developed, but were still considered desirable. Grade C neighborhoods (yellow) were starting to decline and showed an “infiltration of a lower grade population.” And finally, grade D neighborhoods were considered “hazardous” and colored in red. These neighborhoods had low homeownership rates, old crappy housing, and an “undesirable population”, which, at the time, largely referred to Jews and African Americans.

    Some have argued that the HOLC and their “residential security maps” are what kicked off systematic mortgage discrimination in America’s inner city neighborhoods – later referred to as “redlining.” This was the practice of denying credit to people who lived in these undesirable neighborhoods (and even to real estate developers who wanted to build in these undesirable neighborhoods).

    But University of Pennsylvania professor Amy Hillier has argued that these maps simply reflected the ethos of the time period. Using a sampling of HOLC mortgages, she found that 62% of them were issued to grade D (red) neighborhoods. The agency, itself, was not actually redlining in practice.

    Furthermore, she also looked at private mortgages issued in Philadelphia between 1937 and 1950 and found that security grade rating actually had no impact on the total number of loans issued. She did, however, discover slightly higher interest rates for properties located near and in the bottom security grades.

    All of this is to say that “redlining” is likely not the only culprit for inner city decay. There are other factors at play.

    To that end, the National Bureau of Economic Research recently published a working paper, which I discovered through CityLab, called, “Racial Sorting and the Emergence of Segregation in American Cities.” The key finding here is as follows:

    “Our preferred estimates suggest that white flight was responsible for 34 percent of the increase in segregation over the 1910s and 50 percent over the 1920s. Our analysis suggests that segregation would likely have arisen in American cities even without the presence of discriminatory institutions as a direct consequence of the widespread and decentralized relocation decisions of white urban residents.”

    In other words, it wasn’t just mortgage discrimination; it was also just general discrimination. That actually makes a lot of sense, because, if you think about it, the former couldn’t have occurred without the latter being present.

    Here’s how the research paper puts it (via CityLab):

    “Policies that reduce barriers faced by blacks in the housing market may thus not prevent or reverse segregation as long as white households have the ability and desire to avoid black neighbors.”

    (Note: Most of the information and data used in this post was sourced from the work and research of Amy Hillier.)

  • A year in review — 2015 on Architect This City

    Thanks to this blog, it’s pretty easy for me to go back and look at what I was doing and thinking throughout the year. That’s one of the benefits of writing a daily blog/journal. And as is usually the case, 2015 was a year of ups and downs.

    For my annual ski and snowboard trip with the guys, we went to Banff (Alberta) and Revelstoke (BC). But we got stuck with unseasonably warm weather in the west (the opposite of what’s happening this winter) and I got injured on day 3. That put me in the emergency room and knocked me out of snowboarding for the rest of the season – as well as from the gym for a number of months.

    Shortly after that I also got struck with some family health issues. That was pretty scary for a good solid month, but in the end, everything seems to have worked out. What a relief.

    Towards the end of March, I did a brand partnership between Architect This City and Porter Escapes, which brought me to Quebec City for a weekend. That was a lot of fun and gave me the opportunity to be a real flâneur in one of the most interesting cities in Canada.

    In April, I left my real estate development job at TAS and shortly after I joined CAPREIT (TSE: CAR.UN) to help build out their (real estate) development platform. Previously their/our focus had just been on acquiring existing rental assets. But now it is time to build.

    Later this month I also participated in the Toronto filming of a documentary called Waterfront Cities of the World. That was a lot of fun. But come to think of it, I don’t think I ever watched the final video.

    In May, I started lobbying hard for the removal/replacement of the eastern portion of the Gardiner Expressway East here in Toronto. If you’ve been reading this blog since the summer, I am sure you remember this period. With the help of a colleague of mine, I even started a petition that ended up getting presented at City Council.

    But in June, Toronto City Council voted to demolish and then rebuild the elevated expressway along our waterfront. I am still surprised by that. What a shame.

    In July, we (CAPREIT) announced our first joint venture development project. A mixed-use project – 506 rental apartments on top of about 160,000 square feet of retail – in Toronto’s Liberty Village. 

    In August, I went back to Philly to relive my Penn days. I do that every couple of years just to make sure that Bob and Barbara’s is still offering up “The Special.” The Special is a can of PBR and a shot of Jim Bean for $3. It’s famous in Philly, but it always sounds like a far better idea the night before, as opposed to the morning after.

    In this same month I also hit the 2 year mark here on Architect This City. That’s 2 years of getting up every single day and staring at a blank blog post screen and thinking of something insightful to say. 

    The following month on September 11 (I’ll never forget this date), I got laser eye surgery. More specifically, I got custom wavefront LASIK. And today it’s pretty hard to imagine that I used to have to reach for my coke bottle glasses as soon as I woke up every morning.

    Later in September, I also gave a talk at my alma mater, the Rotman School of Management, to a delegation of about 70 urbanists from Portland. It was an honor to be invited alongside rockstars such as Richard Florida and Jennifer Keesmaat.

    In October, I featured a guest post from the former mayor of Toronto, John Sewell. I don’t often do guest posts on my blog, but John had just published a new book and I thought it would be a good way to change things up here. John and I aren’t necessarily on the same page with many urban issues, but we did agree on the Gardiner East.

    For the remainder of October, it was basically just the Jays.

    In November, I spoke at a Product Hunt event focused on real estate + tech. It was incredibly encouraging to see so many entrepreneurs here in Toronto focused on the intersection of real estate and tech. There are lots of opportunities in this space and I am sure that there are many success stories in the making right now. Toronto is the perfect place for real estate + tech innovation.

    And finally, in December, I crossed something off my bucket list and attended Art Basel Miami Beach. I have wanted to go for well over a decade; pretty much since I started studying art history in undergrad. I don’t know what took me so long.

    Oh, I also announced that I was writing a book on becoming a real estate developer

    What a year. I can’t wait for 2016. 

    What do you have on your to-do list for next year?

  • The housing typologies of American cities

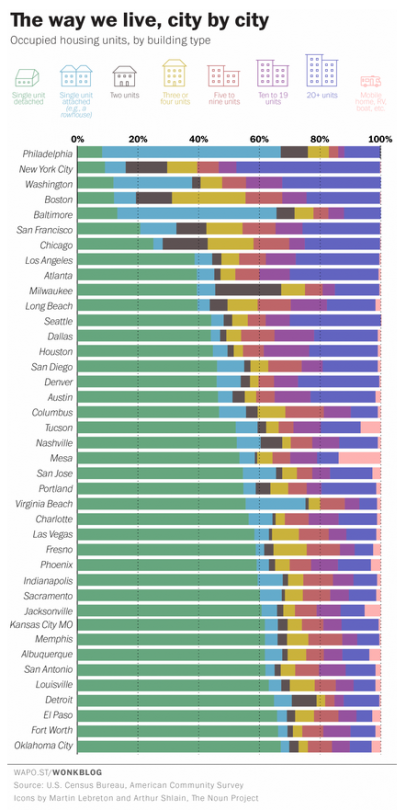
    Yesterday the Washington Post published a great chart showing the housing types of the 40 largest cities, by population, in the US. The list is ordered from lowest to highest according to the percentage of single-family houses in the city (green bar).

    Here’s the chart:

    image

    Not surprisingly, many of the cities at the top of this list (meaning they have the lowest percentage of single-family houses) are in the older east coast cities. 

    It’s also interesting to see just how much the rowhouse dominates the urban landscape in Philadelphia and Baltimore. In Philadelphia, almost 60% of the housing stock is an attached rowhouse.

    Housing is the backdrop for such a big portion of our lives. And when you live in a particular kind of home, it impacts your life whether or not you realize it. The dense rowhouses of Philadelphia and the single-family houses of Oklahoma City are the result of two very different kinds of urban landscapes.

    In Toronto, that backdrop is in the midst of a dramatic change. More and more of us are now living in high-rise condos. That hasn’t always been the case, of course. It’s a recent shift. But it looks like it’ll be a big part of our future.

  • America really is building very few condominiums

    On my way back from Philadelphia
    this past weekend I wrote a post called, The
    Philadelphia (real estate) story
    . It was about how opposite the market is
    in Philly compared to Toronto.

    After writing that post and
    because of a discussion in the comment section, I started thinking about condo
    vs. rental apartment development across the US. Because unlike cities such as
    Toronto and Vancouver, it struck me that – outside of maybe New York and Miami
    – most U.S. cities are really not building a lot of for sale condos. And if
    you’re from Toronto or Vancouver, I bet that feels odd to you.

    But what exactly is that number?

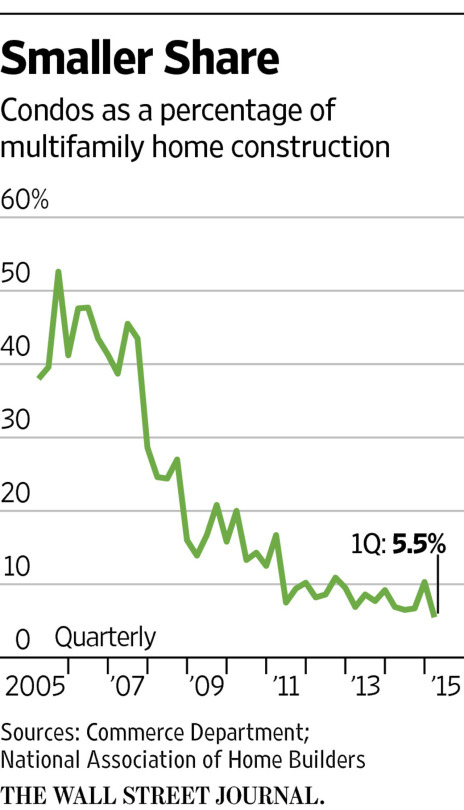
    As of the first quarter of 2015, condos as a percentage of all new
    multifamily (apartment) construction in the US was only 5.5%. That’s a tiny number and is down from
    over 50% before the Great Recession, which means most
    cities in the US really are building mostly rental. Last year the US built 264,000
    multifamily units across 11,000 buildings
    .

    So why is that happening?

    There appears to be a number of
    factors, according to a
    recent article in the Wall Street Journal
    .

    There’s a supply side
    constraint:

    Another obstacle cited by developers: construction loans. Matt
    Allen, chief
    operating officer of the Related Group, a developer based in Miami, said he can
    get a construction loan for roughly 75% of the cost of building an apartment
    complex. But lenders will cover only 50%, on average, of a condo complex’s cost
    because of the greater risk, he said.

    There’s a demand side
    constraint:

    As a result, the Federal Housing Administration, which
    backs mortgages made to low-wealth buyers, tightened its lending standards in a
    series of moves from 2008 to 2012. Under the new rules, in order for the FHA to
    insure mortgages in a given condo complex, at least half of the units must be
    owner-occupied and no more than half can be FHA-insured, among other
    requirements. For condo projects under development, at least 30% of units must
    be under contract for sale before the FHA will start backing mortgages there.
    Mortgage giants Fannie Mae and Freddie Mac tightened
    their standards as well.

    And there are macroeconomic
    factors:

    On the entry-level end, tepid job growth early in the
    recovery and the younger generation’s affinity for flexibility have fueled
    demand for rentals. Apartment rents are up nearly 16% since 2010, according to Reis Inc.

    Notwithstanding
    the above, could this be a post-recession policy pendulum that has swung
    too far in one direction?

  • The Philadelphia (real estate) story

    Real estate is a local business. And this weekend in Philadelphia really reminded me of that.

    Here’s what I mean.

    The real estate story in Toronto is condos. We’re buildings lots and lots of condos. When my friend from Chicago recently visited Toronto for the first time, he told me that it feels very similar to Chicago, except that we have modern glass condo towers going up everywhere and they don’t. That’s our story right now.

    Low-rise housing in Toronto is becoming increasingly unaffordable (the average price of a detached home is well north of $1M) and so high-rise condos are now what many people can afford. When young people in Toronto talk about buying their first place, that now usually means a condo.

    But that’s not the story in Philadelphia.

    In Philadelphia, you can buy a 1,600 square foot, 2 storey, 2 bedroom rowhouse in a respectable neighborhood for sub US$400,000. And in speaking with my friends in Philly this weekend, that’s what young people are buying.

    This doesn’t mean that Philadelphia isn’t building new high-rise condos and apartments. It is. Obviously nowhere near as many as Toronto. But it is building. Far more than when I lived there before the Great Recession.

    However, the condo market is typically more upmarket. The target market isn’t so much first time buyers and the mass market; it’s more people who want full floor apartments in Rittenhouse Square. (I’m exaggerating only slightly.)

    Philadelphia is also building more rental towers than condo towers. (Rental has only recently become fashionable again in Toronto.)

    I’m guessing that a lot of this has to do with the fact that Philadelphia draws in a lot of transient students and academics each year. In fact, the most noticeably changed area from when I lived in Philly was University City. That’s the area that houses the University of Pennsylvania and Drexel University.

    So there seems to be strong demand for new rental housing in the city. I’m told vacancies are very low. But when it comes time to buy, young people don’t look to condos like they do in Toronto. They are looking mostly to rowhouses.

    This is interesting to me because it’s the exact opposite of Toronto. In Toronto, low-rise is expensive and so lots more people are buying high-rise. In Philadelphia, high-rise is expensive and so people are buying low-rise.

    I guess that’s why they say real estate is a local business. What works in one city may not work in another.

  • A culture of beer gardens

    It’s great to be back in Philly. I have a real sense of nostalgia around this city.

    Last night my friends took me to a popup beer garden on South Street put on by the Pennsylvania Horticultural Society. Before the popup garden, it was just an abandoned lot.

    There seems to be a real culture of beer gardens in Philly, which is something I don’t think we have in Toronto. Why is that?

    Part of the reason, I think, is that there’s a greater spread between desirable and undesirable neighborhoods in Philly than in Toronto. And in the undesirable ones, urbanists have to work really hard to figure out ways to activate them.

    So really these popup beer gardens are a lean urbanist intervention. It’s a way to draw people to an area and create awareness. And I’m told that often these popup gardens end up becoming development sites.

    Because of this, these popup gardens are sometimes controversial within communities. They’re seen as a catalyst and precursor to gentrification. But that’s a whole other debate.

    What I find interesting is this grassroots approach to city building. Great spaces don’t have to be expensive. Sometimes seating, lighting, and beer are all you need to bring people together.