Daily insights for city builders, delivered every morning at 6 AM ET. I’m Brandon Donnelly — a Toronto-based real estate developer and founder of Globizen. I’ve been writing here since 2013.

Tag: new york

  • Getting older

    Yesterday I promised that today’s post would be less sad. I am sticking to that promise, but I am also sticking with a somewhat similar theme: getting older.

    Fast Company recently published an interview with New York-based architect Matthias Hollwich. The topic is aging and the kinds of spaces that we have created for people as they age: retirement communities, nursing homes, and so on.

    The reason this is getting airtime right now is because Matthias has just published a book on the topic called, New Aging: Live smarter now to live better forever

    image

    But this isn’t a new focus. Matthias actually taught at the University of Pennsylvania while I was there and I remember his design studio being focused on this topic. (I wasn’t in his studio, unfortunately.)

    The sound bite that I really like from the interview is this one:

    “I think the biggest flaw is that it’s age segregation. You take all of the people who are above 75, 85, or 95, depending on what type of environment it is, and put them into one place. And then you’re just surrounded by old people, people who have social and physical challenges, and you’re not around the vibrancy of a multi-age environment, which is something that we experience all life long. I think that is something that society really has to rethink.”

    Not only do I agree with him, but I think it exemplifies one of the things that I love about architecture. The idea that the way things are done today is usually not some sort of universal truth. Instead, everything can be questioned, rethought, and reinvented for the better. It’s a very entrepreneurial way of operating and I don’t think that parallel, between entrepreneurs and architects, is drawn or leveraged nearly enough.

    I also don’t think we’ve given enough design consideration to this topic of aging. I mean, why can’t the spaces that people end their lives in be as (or more) sexy and enjoyable as (or than) the spaces they live the rest of their lives in? That’s what I want when I’m 95.

    So kudos to Mattias and the rest of the team at Hollwich Kushner (his firm) for caring about and working on this

    Book image from Matthias Hollwich’s Facebook.

  • Snowboarding, vlogs, Cape Town, and marketing

    This morning, instead of my usual routine of writing alongside a cup of coffee, I decided to finally edit all of the skiing and snowboarding footage that I took last month in Park City, Utah. Click here for the final cut.

    Compared to the video we did for Jackson Hole, I don’t like the selfie perspective as much. It doesn’t show enough of the person. This time we used the Go Pro 3-way arm, but in Jackson we used a plastic tube that I think was used for a beer funnel before that. Next year we’ll go back to that.

    Video is a lot of fun and I would love to figure out a way to incorporate more of it into this blog. But that’s a far bigger time commitment and I am not prepared to allocate resources to that. I write every day. That’s my thing.

    I am, however, not ignorant to what’s happening in the world of video blogging. And I think there are lots of opportunities for businesses who have the resources to allocate towards projects like this.

    Take for instance this vlog by New York video guy Casey Neistat. It’s probably the best piece of marketing that the Phantom 4 drone could have asked for. It’s authentic. I watched it and now I want one. Take my money. 

    (Note to city geeks: It’s worth watching just for the drone aerials of Cape Town, South Africa.)

    To my knowledge, I don’t think people are doing anything like this in the real estate business. But eventually it will happen. Because people are becoming increasingly immune to your typical marketing pieces.

  • A new era of (digital) globalization

    McKinsey recently published a report called Digital globalization: The new era of global flows.

    The overarching thesis is that we are transitioning to a data-driven global economy:

    “Flows of physical goods and finance were the hallmarks of the 20th-century global economy, but today those flows have flattened or declined. Twenty-first-century globalization is increasingly defined by flows of data and information. This phenomenon now underpins virtually all cross-border transactions within traditional flows while simultaneously transmitting a valuable stream of ideas and innovation around the world.”

    One of the benefits of this shift is that it has become easier for emerging economies and individuals from all around the world to participate.

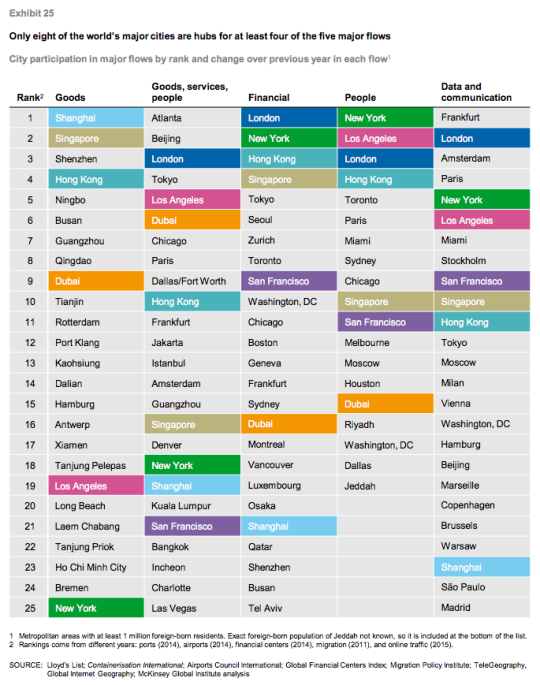
    Of course, not all countries and cities are participating equally. In their report, McKinsey ranks the top cities according to five global flows. In each case a proxy was used:

    “Unfortunately, data on global flows are not available at the city level. However, we have obtained data that serve as proxies for each of our five global flows. Container port volumes approximate goods flows; airport passenger volumes serve as a proxy for goods, service, and people flows; the ranking of cities in the Global Financial Centers Index by the Z/Yen Group provides an indication of financial flows; the number of foreign-born residents in a city measures people flows; and Internet bandwidth approximates data flows.” 

    Using this methodology, they believe that the world only has 8 truly global cities right now: New York, Los Angeles, San Francisco, London, Singapore, Shanghai, Hong Kong, and Dubai. They are the colored cities listed below:

    I always take these city rankings with a grain of salt. This stuff is not easy to quantify and a lot depends on the methodology that you use. 

    For instance, Atlanta sits on the top of “goods, services, and people” because it has the busiest airport in the world according to passenger volume. (It’s the primary hub of Delta Air Lines.) But is that enough to assert that Atlanta is #1? Maybe. Maybe not.

    In any case, the report is packed full of information. If you’d like to take a look, click here.

  • Residential population densities compared

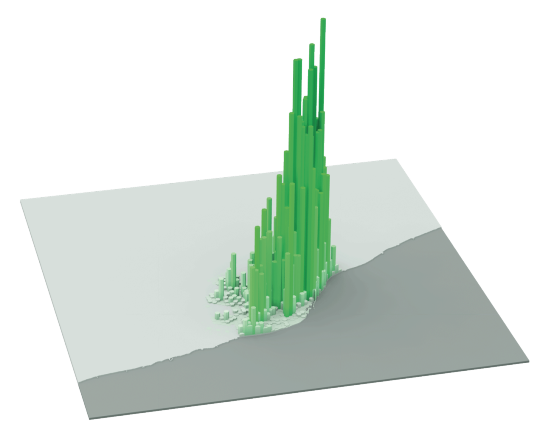
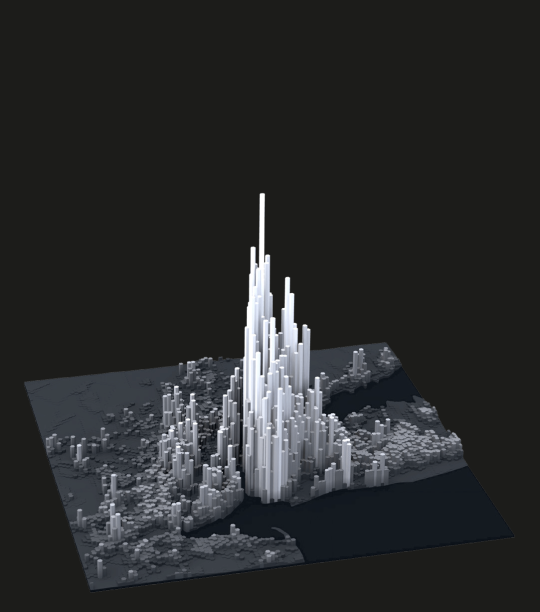
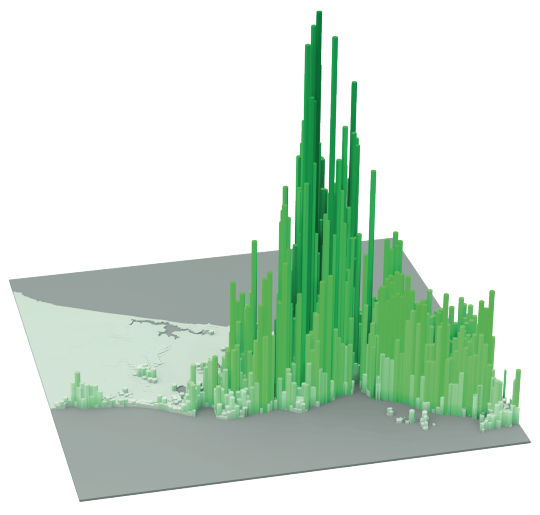
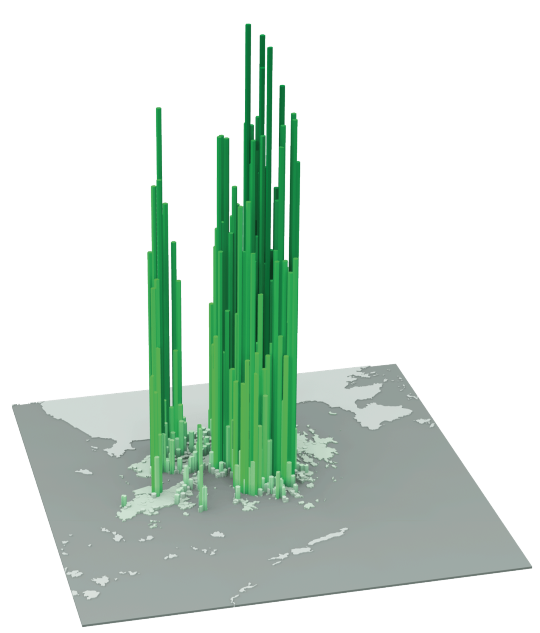
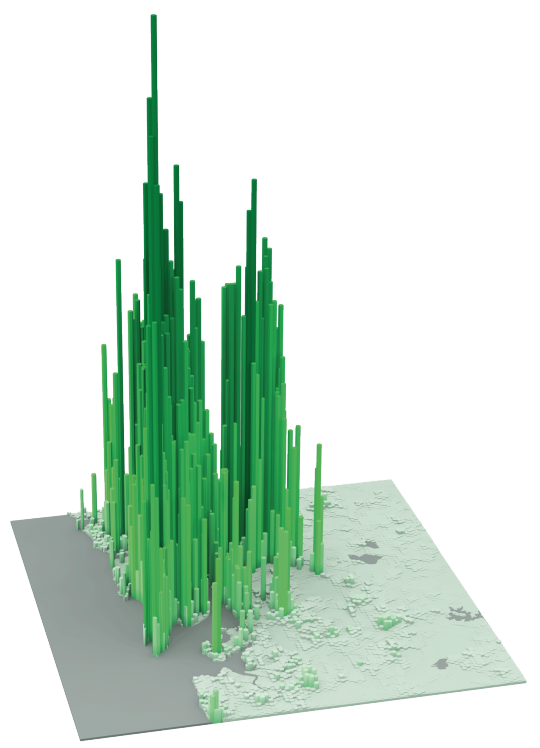
    The following diagrams were taken from LSE’s Urban Age website. I’ve sorted them from lowest to highest peak residential population density. In each case I’ve also included the year of the dataset. 

    It’s amazing how much these simple extrusion diagrams can tell you about the city. It also shows you that high population densities don’t necessarily need to equate to tall buildings. Barcelona, in particular, stands out for me.

    Berlin (Peak residential density: 21,700 people/km2, 2009)

    image

    Stockholm (Peak residential density: 24,900 people/km2, 2012)

    image

    London (Peak residential density: 27,100 people/km2, 2013)

    image

    São Paulo (Peak residential density: 29,380 people/km2, 2009)

    image

    Mexico City (Peak residential density: 48,300 people/km2, 2009)

    image

    Barcelona (Peak residential density: 56,800 people/km2, 2013)

    image

    New York (Peak residential density: 59,150 people/km2, 2012)

    image

    Shanghai (Peak residential density: 74,370 people/km2, 2011)

    image

    Istanbul (Peak residential density: 77,300 people/km2, 2013)

    image

    Hong Kong (Peak residential density: 111,100 people/km2, 2013)

    image

    Mumbai (Peak residential density: 121,300 people/km2, 2013)

    image

  • VIA 57WEST in New York starts renting apartments

    image

    Bjarke Ingels’ West 57th Street project in New York (developed by The Durst Organization) has just started renting apartments (March 1). 

    Since I’m in the rental business, I thought it would be worthwhile to take a look at the rents – though I tend to obsess over all buildings and not just rental ones.

    Firstly, the project has a total of 709 apartments and 178 different unit types because of the architectural variations in the building. Of these units, 142 of them (20%) have been designated as affordable and were offered up via a lottery to people who fall within certain incomes ranges. 

    Here are the affordable rents via 6sqft.com:

    image

    I don’t know the exact numbers, but Curbed New York speculated – based on what was seen at other buildings on the west side – that the total number of applicants for these 142 units may have reached over 100,000!

    For the market-rate units, the average monthly rents are as follows (via Curbed NY):

    • Studio: $2,770
    • One-bedroom: $3,880
    • Two-bedroom: $6,500
    • Three-bedroom: $11,000
    • Four-bedroom: $16,500

    I wasn’t able to find average unit sizes (to calculate per square foot rents), but I estimate the overall average unit size to be around 1,000 square feet. 

    940,000 sf (total gross floor area)45,000 sf of retail x 0.80 efficiency (lower than average because of the shape of the building) / 709 units = approximately 1,000 sf of rentable area per unit. That’s just my rough guess based on what I could find online.

    Based on the Curbed comment section though, there are certainly some smaller units:

    image

    If anyone has any additional figures, please share them in the comments below. I think there are a few subscribers to this blog who are involved in the project.

    Image from via57west.com

  • Boondoggle or architectural icon?

    Today, the new World Trade Center Transportation Hub, designed by architect Santiago Calatrava, opened up – at least partially – in New York City. 

    Given that it was originally supposed to open in 2009 and cost about half as much (original budget was $2.2 billion), the critics haven’t been kind.

    Here are a few snippets from Michael Kimmelman’s writeup in the New York Times, called, Santiago Calatrava’s Transit Hub Is a Soaring Symbol of a Boondoggle:

    …at first blush, Mr. Calatrava’s architecture can almost — almost — make you forget what an epic boondoggle the whole thing has been. That virgin view, standing inside the Oculus and gazing up, is a jaw-dropper.

    The project’s cost soared toward a head-slapping, unconscionable $4 billion in public money for what, in effect, is the 18th-busiest subway stop in New York City, tucked inside a shopping mall, down the block from another shopping center.

    And it’s not really a hub. A maze of underground passages connects the site to far-flung subway lines, but there are not free transfers. The place is a glorified PATH station for some 50,000 weekday riders commuting to and from New Jersey.

    I haven’t been following this project, so I can’t really comment on the delays and cost overruns. But I sure wish that main hall (called the Oculus and pictured above) was a part of my regular travel routine.

    Image via Curbed

  • Lo Mein Loophole

    Maria Godoy of NPR recently published an interesting piece called Lo Mein Loophole: How U.S. Immigration Law Fueled A Chinese Restaurant Boom.

    The article starts by talking about how rising anti-Chinese sentiment in the late 19th and early 20th century eventually lead to the U.S. passing new immigration laws. These laws explicitly restricted Chinese laborers from moving to the U.S. and even made it difficult for legal residents to return after a visit home to China.

    However, embedded in these laws was a small loophole:

    But, as MIT legal historian Heather Lee tells it, there was an important exception to these laws: Some Chinese business owners in the U.S. could get special merchant visas that allowed them to travel to China, and bring back employees. Only a few types of businesses qualified for this status. In 1915, a federal court added restaurants to that list. Voila! A restaurant boom was born.

    “The number of Chinese restaurants in the U.S. doubles from 1910 to 1920, and doubles again from 1920 to 1930,” says Lee, referring to research done by economist Susan Carter. In New York City alone, Lee found that the number of Chinese eateries quadrupled between 1910 and 1920.

    This is fascinating on so many levels. 

    For one, it’s always interesting when small loopholes have unintended consequences. It is doubtful that anyone could have predicted a Chinese restaurant boom.

    Secondly, despite the U.S. being a nation of immigrants, you see here a long history of trying to keep immigrants out. In the early 20th century, the fear was Chinese laborers who worked for low wages. Today, it’s Mexican laborers who work for low wages.

    Finally, it’s amazing to look back at the foundation that these early Chinese entrepreneurs no doubt created. Today, Asian Americans are often considered a “model minority.” The Pew Research Center refers to them as “the highest-income, best-educated and fastest-growing racial group in the United States.” 

    When it comes to Ivy League admissions, they’ve even been called the “New Jews” – referring to the fact that many believe that top tier schools have systematically biased admissions against both Jews and Asians because of their tendency to overachieve relative to “white Americans.”

    And to think that this may have all started, at least partly, with a Chinese restaurant boom.

  • Cities aren’t the only places struggling with housing affordability

    We already know that many successful cities are struggling with housing affordability. But what you may not know is that a similar phenomenon is happening in many ski towns. Supply is constrained and demand is high.

    Here is an excerpt from a recent New York Times article:

    Local officials and housing experts say it is a symptom of widening economic inequality, one that is especially sharply felt in tiny resort towns hemmed in by beautiful but undevelopable public land. While the wealthiest can afford $5 million ski homes and $120-a-day lift tickets, others work two jobs and sleep in shifts to get by.

    “It’s so much worse today than it’s ever been,” said Sara Flitner, the mayor of Jackson, Wyo., where the median single-family home price rose 24 percent last year to $1.2 million, according to the Jackson Hole Report.

    It’s for reasons like this that some ski towns have strict criteria around who is an eligible resident. For example, Banff, Alberta does this to ensure, “that housing remains available for those whose primary objective is to live and work in the community.”

    In small landlocked ski towns – where it’s difficult or almost impossible to increase supply – there are only so many options. 

  • Top 20 cities for venture capital investment

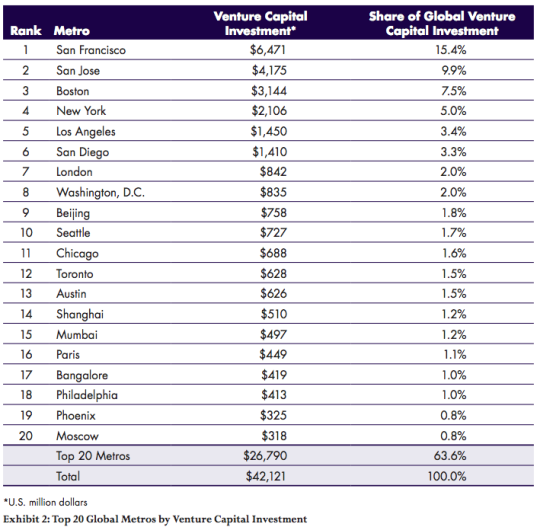
    The Martin Prosperity Institute here in Toronto recently published a new report that looks at worldwide venture capital investment by city. The report is called Rise of the Global Startup City.

    The data is from 2012, because that’s what was available from Thomson Reuters, so keep in mind that there might be some variation in the rankings if we were to look at more recent data. Some of the cities sit fairly close.

    Nonetheless, here are a few of the broader takeaways (from the report page):

    “The United States accounts for nearly 70 percent (68.6 percent) of total global venture capital, followed by Asia (14.4 percent) and Europe (13.5 percent).”

    “Just two broad regions — the San Francisco Bay Area and the Boston-New York-Washington Corridor — account for more than 40 percent of global venture investment.”

    “Global venture investment is highly uneven and spiky — it is concentrated in a small number of large cities and metros around the world.”

    Here are the top 20 cities by total venture capital investment (in USD millions):

    image

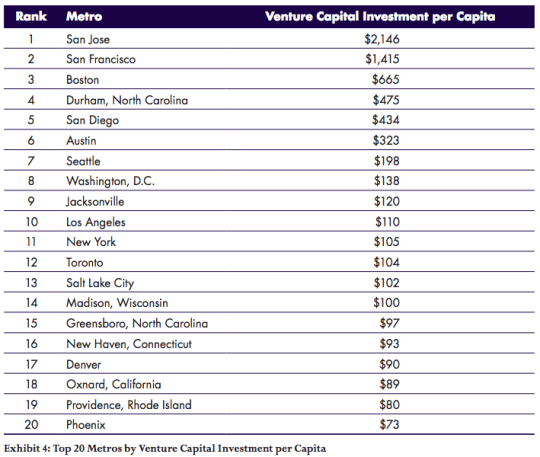
    And here are the top 20 cities according to venture capital investment per capita:

    image

    Given the variation in these two lists, you realize that some cities are largely benefitting from sheer size. London, for example, drops off the list when you look at venture capital investment per capita. 

    In fact, in this second list, 19 of the 20 cities are in the United States. The only non-American city that remains is Toronto.

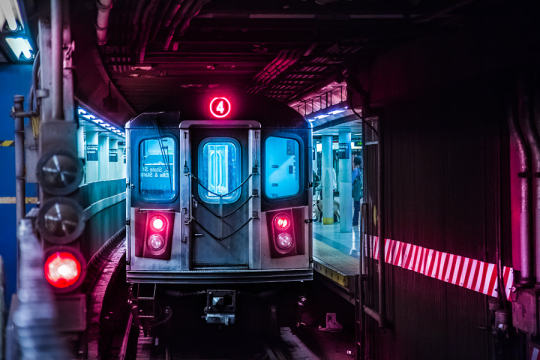
  • Bringing public transit into the 21st century

    New York Subway by Lok Yiu Cheung on 500px.com

    https://500px.com/embed.js

    I think we’ve hit peak millennial.

    Last Friday the Governor of New York, Andrew Cuomo, and the Metropolitan Transit Authority, announced that 30 subway stations will be redesigned and that “millennial-friendly amenities” would be added throughout the system

    As you might guess, this includes adding phone chargers in train cars and buses and wifi throughout all the stations (by the end 2016). They will also be replacing the MetroCard with an all digital fare system that will include mobile payments.

    But the reality is that this isn’t about being millennial-friendly. This is about joining the 21st century.

    Here in Toronto, we finally have our PRESTO card working on all streetcars and in almost 40% of the city’s subway stations. This is a huge improvement over our laughable and antiquated token system, but it’s not enough. I really hope the next rollout is a mobile app that will allow everyone to pay with just their phone.

    We also have wifi in about 30% of our subway stations, but again this is not enough. By the time you get authenticated (do you need to have Twitter now?), your train is usually arriving and then you enter a tunnel where no wifi exists. We need to be looking at the entire tunnel network. (Related topic: LinkNYC

    I say all this because I am a big supporter of public transit. Despite all the positive things I write about Uber, ridesharing, and driverless cars, I do not believe that they will eradicate the need for a strong transit backbone. This is fundamental to our city building efforts. 

    So let’s do our best to delight people when they take transit.