Daily insights for city builders, delivered every morning at 6 AM ET. I’m Brandon Donnelly — a Toronto-based real estate developer and founder of Globizen. I’ve been writing here since 2013.

Tag: mit

  • Visualizing the origins of MIT’s international students

    “Like the United States, and thanks to the United States, MIT gains tremendous strength by being a magnet for talent from around the world. Faculty, students, post-docs and staff from 134 other nations join us here because they love our mission, our values and our community.” -L.Rafael Reif, MIT President

    The MIT Senseable City Lab recently analyzed nearly 20 years of ethnographic student data in order to visualize the origins of its international faculty, students, and researchers from 1999 to the present.
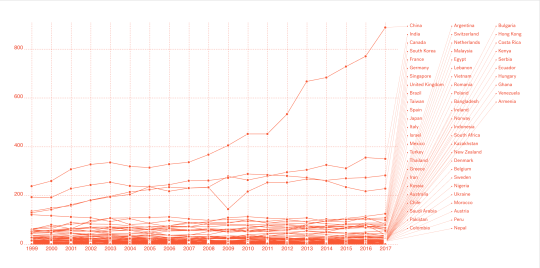
    The above chart may be a bit small (larger version here), but it shows all students (undergraduate, graduate, and visiting/others) by country. The top 5 countries are China, India, Canada, South Korea, and France.

    To give you some sense of the math, there are 3,808 international students at MIT as of 2017. 888 of them alone are from China – mostly at the graduate level (688 out of the 888). So China represents almost ¼ of MIT’s international student population.

    Another thing that stood out for me was the drop off in Canadians in 2009. You can see that “V” roughly in the middle of the chart. Canada went from 233 to 144 students. I wonder if this had something to do with the economic climate at the time. Not sure.

    Click here to see all of the visualizations. 

    Note that you can toggle by region and country, as well as by “Trump’s EO Countries.” That feature, as well as the quote at the beginning of this post, should give you an immediate appreciation for some of the motivations behind this exercise.

    Images: MIT Senseable City Lab
  • Shareable cities

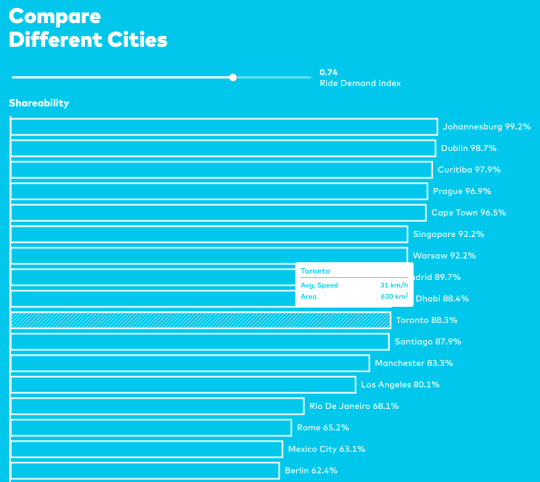
    The MIT Senseable City Lab recently looked at which cities are the most “shareable” when it comes to ride sharing services such as UberPOOL. Their goal was determine what fraction of individual trips (inefficient) could be shared or pooled (more efficient). To do this, they developed a single “shareability curve.” Full research paper, here.

    Not surprisingly, New York City does very well in this analysis. Its shareability is well above 95% for a delta of 5 minutes. That’s because the city has a large population, a small geographic area, enormous density, and lots of taxi traffic. (They used taxi data in their research.)

    But New York City also does very well when it comes to transit ridership. Highest in North America. So it strikes me that the characteristics that make a city “shareable” also apply to transit – which is effectively another form of ride sharing. Might we see the distinction between these 2 forms of mobility blur in the future? I think so.

  • The Green View Index

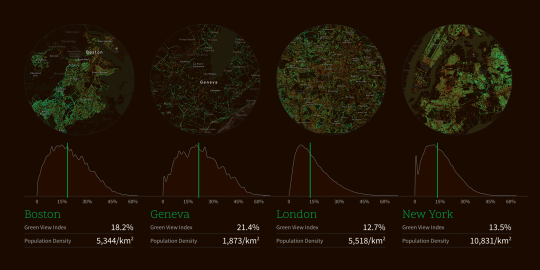
    The MIT Senseable City Lab recently developed something called the Green View Index. It is a measure of a city’s tree canopy. Below are the GVIs for Boston (18.2%), Geneva (21.4%), London (12.7%), and New York (13.5%). You may have to zoom in.

    image

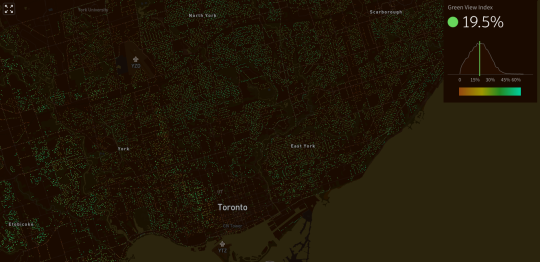
    And here is a screenshot of Toronto. We have a GVI of 19.5%.

    image

    The index was developed by methodically scanning for trees in Google Street View panoramas. The reason street view was used – as opposed to aerial photography – was so that they could capture the human experience at street level.

    All of MIT’s interactive city maps can be found here. It’s also interesting to pan around and see which neighborhoods are the greenest – particularly if you are familiar with the city.

    One thing I noticed is that large green spaces such as Central Park, High Park, and Stanley Park don’t show up as very green. And that’s because the index uses car-based street view data. I feel like these green spaces should count for something though.

  • Slot-based intersections

    If you don’t follow the work of MIT’s Senseable City Lab, I highly recommend that you start. 

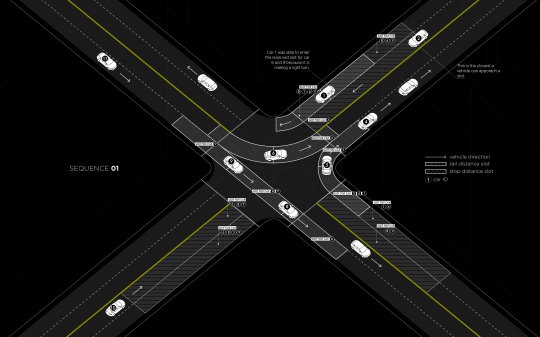
    Earlier this year, researchers from the Massachusetts Institute of Technology, the Swiss Institute of Technology, and the Italian National Research Council developed something that they call “slot-based intersections.” In a world where cars have sensors and drive themselves, it is intended as a more efficient alternative to traditional intersections. Goodbye traffic lights.

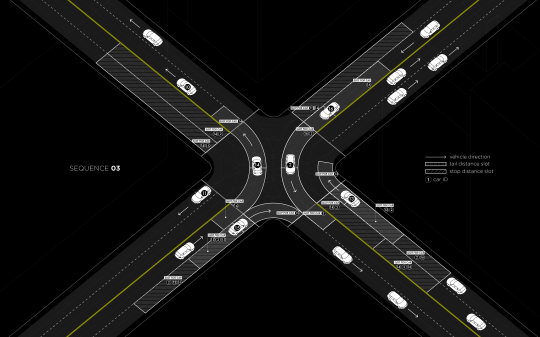
    Much like air-traffic control, the way the system works is by assigning individualized time slots to each car for when they may enter an intersection. For example, in the diagram below (Sequence 01) the car approaching from the bottom left (#10) has a “stop distance slot” in front of it reserved for 3 of the cars that are currently in the intersection. The two that are traveling perpendicular to it and the car currently turning left into the same lane as #10 (on the other side of the intersection). The car in the midst of turning right (#5) is exempt because there’s no possibility of collision. 

    image

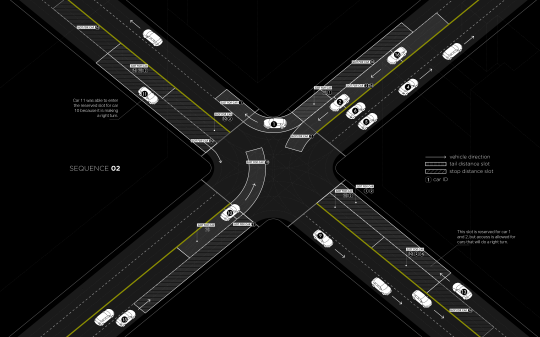
    In Sequence 02 (below) you can see that car #10 is now turning left, which means it has its own time slot in the intersection. Other approaching cars now have a “stop distance slot” dependent on car #10.

    image

    In all cases, cars making a right turn are able to move freely, provided they will not interfere with any other cars.

    image

    The researchers estimate that real-time slot allocation might double the number of vehicles that a traditional traffic-light intersection can handle today and, in some cases, it might completely eliminate stop and go traffic.

    Often when I write about self-driving vehicles I hear people tell me that cars are still cars. It doesn’t matter whether they are self-driving or not. The same inefficiencies apply. They are not the solution to urban gridlock. Elon Musk was also criticized (following his Master Plan) for not properly understanding urban geography.

    But self-driving cars will create new efficiencies. I am not saying that they are a silver bullet, but I am saying that they will help a great deal. I don’t think that anyone truly understands the extent of these efficiencies, but there are a myriad of possibilities. This Senseable City Lab project is a perfect example.

    What I am grappling with right now is the relationship between self-driving vehicles and traditional forms of public transit. Until we get a handle on the efficiencies and overall impact, it’s hard to ascertain how these different forms of mobility will work together. My gut tells me that the lines are bound to get blurry and that self-driving “cars” will feel less and less like the cars we know today.

    Below is a video that was published along with the research. If you can’t see it, click here.

    [youtube https://www.youtube.com/watch?v=4CZc3erc_l4?rel=0&w=560&h=315]

  • School of Real Estate

    I’ve been getting a lot of (email) questions lately about what to study in order to become a real estate developer. So I thought I would reblog this post that talks about exactly that. I wrote it over a year ago and I almost forgot it existed.

    At the same time, I’m reminded of something: I think these questions really speak to the fact that there’s a significant opportunity (particularly in Canada) in terms of real estate development education. 

    Oftentimes when I get these questions, I end up recommending the Master of Science in Real Estate Development (MSRED) at ColumbiaMIT, and USC. Why don’t we have something similar (and better) in Canada? We are falling behind.

    I have raised this with some Universities here in Toronto, but the response I got was that they felt the real estate courses being offered as part of their existing MBA programs were more than sufficient. I think we can do a lot better.

    One professor suggested that I line up a big donor and work with them to spearhead the creation of the (Insert Donor Name Here) School of Real Estate. I think that’s a great idea, but not something I have the capacity for right now.

    Hopefully somebody else out there is of the same mind.

    Post Update: 3 days ago the Schulich School of Business (York University) announced a one-year full time Master of Real Estate and Infrastructure (MREI) program – the first of its kind in Canada. 

    This is great news. 

    Now I would love to see the University of Toronto and Ryerson University (as well as others) step up and leverage their respective architecture schools. Schulich is already out of the gate on this one.

  • The super-linear relationship between human interactions and city size

    image

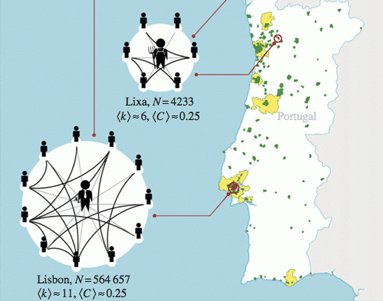
    The MIT Senseable City Lab recently teamed up with a few other research groups to investigate the relationship between human interactions and city size. If you happen to be a member of the Journal of the Royal Society Interface, you can download the full report here. But in true ATC fashion, I’m going to give you the Coles Notes version here.

    What the study did was look at billions of anonymized mobile phone data in both Portugal and the UK in order to determine how our real life social networks change with city size. And what they found is a pretty consistent relationship:

    [T]his study reveals a fundamental pattern: our social connections scale with city size. The larger the town you live in, the more people you call and the more calls you make. The scaling of this relation is “super-linear,” which means that on average, if you double the size of a town, the sum of phone contacts in the city will more than double – in a mathematically predictable way.

    What’s interesting about this finding is that it starts to explain how cities–and the clustering of people–can act as fertile ground for the exchange of ideas and knowledge. The bigger the city the more people you probably know.

    But what I’m curious about (I don’t have the report) is if there’s some kind of upper limit. Presumably this “super-linear” relationship tapers off after a certain city size, because there has got to be limits to the number of people we can maintain productive relationships with.

    According to British anthropologist Robin Dunbar, that number was 150 people.

  • 80% of New York’s 150 million taxi trips could be shared

    I’ve been a big fan of MIT’s Senseable City Lab since I was a grad student at Penn. Their work sits at the intersection of cities and technology, and so I’ve always found it incredibly fascinating.

    Recently, the lab examined data from all of New York’s 13,586 registered cabs and looked for ways that technology and mobile tech could potentially optimize the way the system works today. In particular, they were interested in examining instances where people were heading to the same place at the same time, and were within no more than a 3 minute walk of each at the start of the trip.

    What they found was that, of the 150 million taxi rides taken in New York City during 2011, almost 80% of them could have been shared.

    That is, 80% of the time, there was an overlap in both time and route. That’s an hugely interesting stat because it starts to show just how much waste and inefficiency there currently is in the system. Think about all the trips and carbon emissions that could be potentially eliminated through optimization.

    Here’s a video they produced on the project. Click here if you can’t see it below.

    [youtube https://www.youtube.com/watch?v=Gyq_Zr96uzs?rel=0]

    It’s a great example of how technology is and will continue to creep into every segment of the economy. It’s exactly what I was talking about in my post, “Disrupting everything.”