Daily insights for city builders, delivered every morning at 6 AM ET. I’m Brandon Donnelly — a Toronto-based real estate developer and founder of Globizen. I’ve been writing here since 2013.

Tag: miami

  • Building on stilts

    image

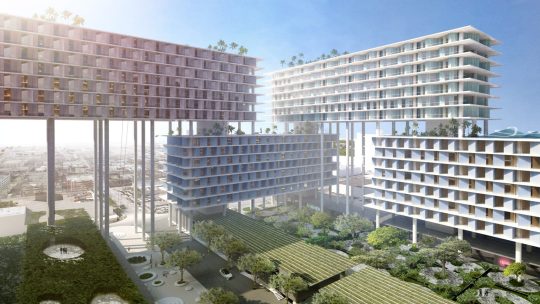
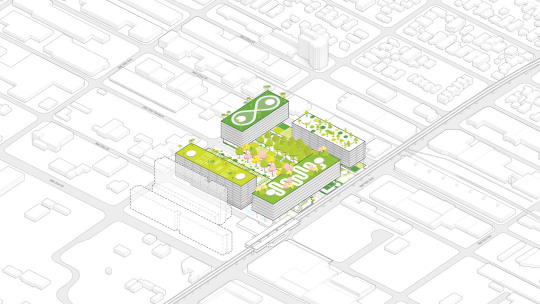
    Last week Bjarke Ingels Group and UIA Management announced a 125,000 square meter mixed-use complex in Allapattah, Miami called the Miami Produce Center. 

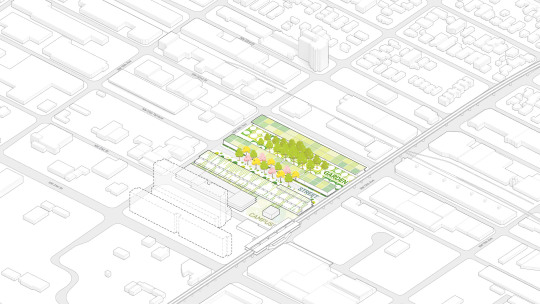
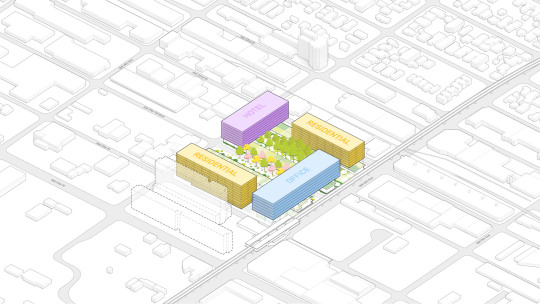
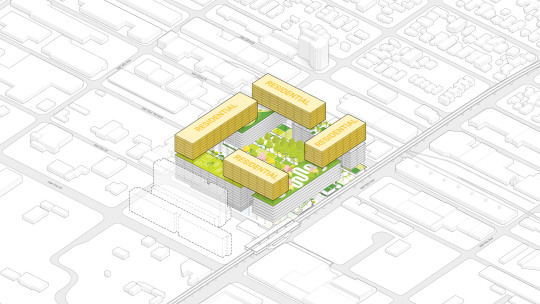
    The proposed project includes office, residential, and hotel uses on stilts over three existing warehouse buildings. The existing buildings will be transformed into restaurants, shops, cafes, and a school. And supposedly, at least according to the renderings, the parking garage will be designed so that it can be transformed into a club at a night. This is Miami after all.

    Here are a few diagrams from BIG showing the build up:

    imageimageimageimage

    Perhaps best known for its warehouses and Dominican population, investors have been speculating for years that Allapattah would eventually become the next Wynwood. Here’s some evidence that it already has the requisite bars and artsy things.

    Does this project signify a tipping point for the area? Feels like it. But those of you who know Miami better than I do would be in a better position to comment.

    Images via Dezeen

  • A picture of dynamic road pricing

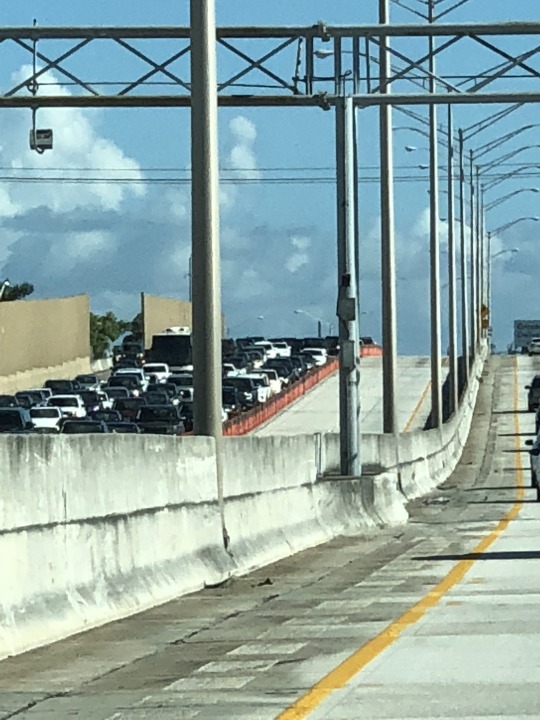
    Below is a photo of Interstate 95 near Miami, which, for the record, I myself did not take while driving.

    image

    The two empty lanes that you see are the “Express Lanes.” The price for using these lanes varies based on demand.

    During periods of low demand, the toll could be around $0.20 per mile. 

    During periods of high demand, such as during rush hour, it might be $1 per mile. 

    And during unusually heavy periods, like when there’s an accident, it could be more.

    We used these lanes while driving around the Miami area on this trip. The pricing always seemed reasonable and the lanes were never congested.

    I think the above picture is a good demonstration of how dynamic road pricing can be used alleviate traffic congestion.

    That’s why many cities, such as Portland, are exploring it as a solution. I wish Toronto would do the same.

  • PAMM, hi

    Yesterday we visited the Pérez Art Museum Miami (PAMM), which has been on my list since it first opened in 2013. 

    The Pérez part of the name belongs to real estate developer and art collector Jorge Pérez. He donated $35 million in cash to the Miami Art Museum in 2011 – so that the below building designed by Herzog & de Meuron could be built – and another $15 million in 2016. 

    This latter donation included some contemporary Cuban art valued at around $5 million. Supposedly after he dies Pérez will be donating the rest of his art collection to the museum.

    Pasted below is a full copy of the architect’s description of the project to go along with my photos. It was taken from here.

    This first picture faces the main entrance (on the left) and Biscayne Bay. In the background, toward the end of the terrace, is also a playground with swings.   

    image

    This picture shows the relationship between the “veranda-like public space” that wraps the building and Biscayne Bay on the left. Also note the hanging plants. These were great.

    image

    And this last picture is my attempt to show a kind of section through the building. Here you can clearly see the raised museum and at-grade parking (described below). 

    I also enjoyed that the parking level housed vegetation that cut through the above veranda.

    image

    -—————————————————–

    An open structure

    The new Pérez Art Museum Miami (PAMM) is located in Museum Park, part of the redeveloping downtown waterfront on Biscayne Bay. Its direct neighbours are the Patricia and Phillip Frost Museum of Science and a major freeway, connecting mainland Miami with Miami Beach. Simultaneously oriented towards the park, the water and the city, the new PAMM is an open and inviting structure from all sides alike.

    Miami is known for its iconic art deco district, decorated boxes with no great relationship and exchange between inside and outside. What makes Miami so extraordinary however, is its amazing climate, lush vegetation and cultural diversity. How can these assets be fully exploited and translated into architecture?

    Nature

    As in previous examples of our work, such as the Dominus Winery in Napa Valley, the building’s environmental circumstances become central to its architectural concept. Due to its proximity to the water, the museum is lifted off the ground for the art to be placed above storm surge level. We use the space underneath the building for open-air parking, exposed to light and fresh air that can also handle storm-water runoff. Rising from the parking level, the stilts supporting the museum platform become columns supporting a shading canopy, which covers the entire site creating a veranda-like public space that welcomes visitors to the museum and the park. Facing the bay, a wide stair connects the platform to the waterfront promenade.

    In this exceptional location, we wanted the museum to offer generous views to the outside. Yet all the building’s expansive windows are recessed, with wooden planks under the concrete beams to minimize the sun’s impact on the glazing and to reduce the building’s energy consumption for cooling. Tropical plants selected for their resilience to the local conditions engulf the structural system. Roof and plants combined will create an overall microclimate reducing the extreme temperature gaps between outside and inside in the hot weather. The exterior surface of the museum’s massive concrete walls is chiseled in places and polished in others. When adjacent to the glazing, the concrete is smooth and reflective. When facing the outside, the concrete becomes rough, exposing its natural ingredients.

    Rather than being an isolated “jewel box” (Schatzkammer) for art lovers and specialists, the museum provides comfortable public space for everybody. It is an extension of the park, offering gradual transitions from the outside to the inside, from the warm to the cool, from the humid to the dry and from the street to the art.

    Specificity

    The expression of the building comes from the canopy, the platform, the columns, the vegetation: in other words, the Veranda occupying the entire site. The museum’s interior volume nests within it, suspended amid the structural framework, each floor assuming the shape it needs. Because the galleries did not have to fit into any given form, we had the freedom to develop the curatorial layout, in close collaboration with the museum staff, to what felt like an optimal configuration to exhibit and develop the growing collection as well as to provide ample space for temporary exhibitions.

    PAMM is organised around four different gallery types: Overview, Focus, Project and Special Exhibition galleries. They occupy part of the first and the entire second floor. The Overview galleries, displaying the museum’s collection, serve as the connecting tissue between the other gallery types. Fluidly connected in a non-linear sequence, they allow relationships to be formed between spaces. They are characterized by large openings with views onto the park, downtown Miami, the bay and the freeway. Along this flowing sequence of rooms, single enclosed spaces punctuated by windows show an individual artist, a theme, a specific collection or a commissioned work. These spaces are called Focus and Project galleries. The fourth type, the Special Exhibitions galleries function as spacious exhibition halls designed to accommodate contemporary art exhibitions. The Overview, Focus and Project galleries form a firm and rhythmic sequence through the building, varying in proportion and relationship to the outside. On the other hand, the Special Exhibitions galleries are flexible, with fewer openings to the outside and can be subdivided by temporary walls.

    The spaces at PAMM and their materiality are very specific. They can be considered an antithesis to the flexible, abstract white cubes that have been a dogma in most recently built art spaces. Concrete and wood are used in different combinations, reflecting the outside materials of the building. Typical drywalls are detailed in a way that they are legible as added to the main structure. In order to enhance the inside-out transition, we designed a customized concrete mullion system that holds the largest ever-used hurricane-proof glass in Florida.

    Community and views

    At the heart of the building, a stair as large as a gallery connects the two exhibition levels. This stair also functions as an auditorium, using sound-insulating curtains in different configurations to provide space for lectures, film screenings, concerts and performances. Our idea was to avoid for such events to be isolated in a space remaining unused for most of the time. At PAMM, events in preparation are visible. When the space is not actively used for events, it is used by visitors and staff for individual readings, introductions to groups and the like. The museum shop and bistro are located on the platform level and are oriented to the bay. Education and research facilities are on the third floor along with the museum’s offices. We place these communal spaces at the periphery of the building, maximizing their exposure to the Veranda, Biscayne Bay, and Museum Park.

    Herzog & de Meuron, 2013

  • Before & After — Miami Beach

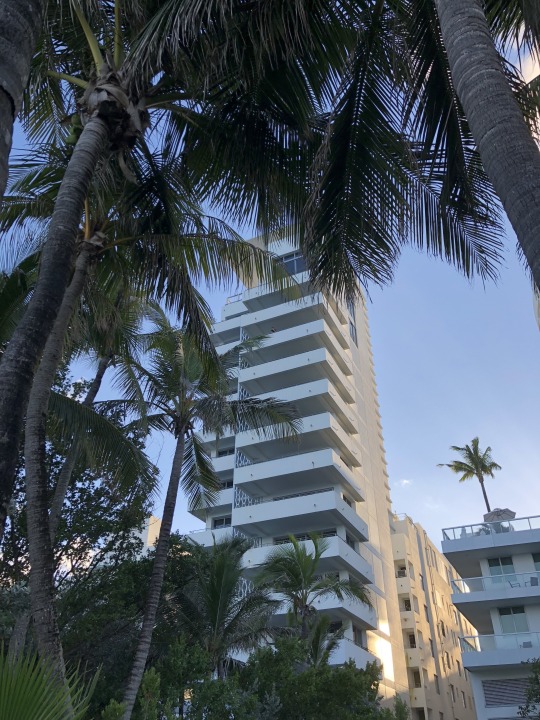
    We switched coasts today. Here is a photo of our Miami Beach hotel taken from the boardwalk with my iPhone:

    image

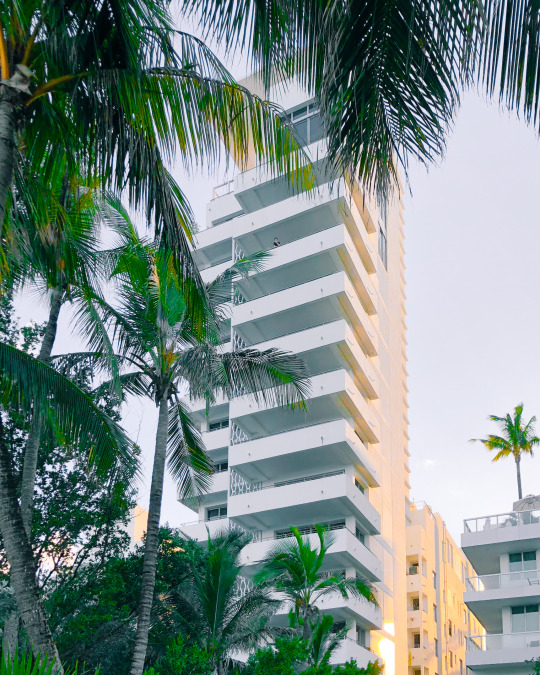
    And here is the after:

    image

    I took it into Lightroom. Fixed the alignment of the building. Whitened it, but brought out the beautiful warm sunset light on the north elevation. And I took the greenery in the foreground out of the shadows.

    The balconies remind me of one of Donald Judd’s “Untitled” pieces. He was one of my favorite artists. I also like the one dude leaning over that upper balcony. It gives the photo a tranquil feel, which is not usually how one would describe Miami Beach.

  • Red tide, scooters, and civic security

    image

    I am reading up on a few different things this morning.

    Southwest Florida, which is where I am right now, is in the midst of a “red tide” that began last November. These happen fairly regularly along the Gulf Coast, but this one is high up on the severity scale. There doesn’t appear to be a clear explanation for what causes them, but sustained warmer temperatures and fertilizer and other pollutant runoff are thought to stoke it. Whatever the cause, they are devastating to the environment. We are switching coasts tomorrow morning.

    Portland now has electric scooters. (Why don’t we have these in Toronto?) But to combat possible concerns around urban clutter, the company, Bird, has committed to collecting all of its scooters each night and has agreed to remit $1 per scooter per day to the city. These scooters are pissing off some cities (or maybe it’s just San Francisco), but I still believe the problem will eventually get resolved. City Observatory also has this interesting piece where it compares the above scooter pricing to car pricing. Are we underpricing cars?

    Finally, here is a short film on civic security in Paris. In an effort to mitigate terrorism, the city has, of course, been implementing and erecting fencing, barricades and other reactive security measures. But sadly, now that this has become a new reality, the capital is spending more time considering how these measures could be more thoughtfully designed. The video showcases some of them. Certainly a more deliberate approach, but are they just as reactive?

    Maybe one of these topics will be of interest to you too.

    Photo by Andreas Selter on Unsplash

  • Future of the American city

    image

    The Knight Foundation has just announced $1 million in support to the Harvard Graduate School of Design for a multi-year, multi-city, and applied research effort that they are calling the Future of the American City. The program will start in Miami and Miami Beach, but the plan is to expand to Boston, Detroit, and Los Angeles.

    As part of this initiative, the GSD will embed faculty and urban researchers into the local community, as well as organize three design studios that will build on each other every year. In the case of Miami and Miami Beach, the 3 themes that will be explored are urban mobility, affordability, and climate change. As you know, these two cities are center ice for the problem of sea level rise.

    This sounds very similar to a design studio that I took at Penn, which was centered around water and housing issues in Bangladesh. It was a multi-year research studio (5 years in this case) and we visited and got paired up with locals in Dhaka during the course of the studio. I think these types of programs are a great way to ground the research in reality. 

    And as a fan of Miami and Miami Beach, I am curious to see what the teams come up with over the next 3 years.

    Photo by Blake Connally on Unsplash

  • The most popular building amenities (according to a small subset of people)

    Here are the results from my primitive multi-unit building amenities survey:

    Gym is number 1. No surprise there. 46% of respondents said it was in their top 3. 

    Rooftop outdoor space at number 2 was perhaps a bit surprising. But then again, who doesn’t love a good rooftop patio?

    As for concierge service, I tend to think this was driven by package delivery. That’s certainly the biggest value add for me.

    One standout near the top, for me at least, is co-working space. Andrew LeFleur made mention of this on Twitter and I think he’s right: The changing nature of work is making these spaces more valuable in multi-family dwellings.

    And now some color on the above results.

    436 amenity selections were made as part of this survey. 

    About half of the respondents were from the Greater Toronto Area, followed by Calgary, San Francisco, Ottawa, Boston, New York City, Denver, Los Angeles, Paris, Miami, and many other cities. Shoutout to whoever responded from Kuala Lumpur and Porto Alegre.

    In terms of “Other” amenities, there were suggestions for a band rehearsal space, a vending machine, a grassy area for sports, and programming the helps you meet your neighbors.

    In terms of this one last, it can be tricky for condo buildings. Developers only provide the space. It’s then up to management. But I’ve seen it done very well in rental buildings.

    Are you surprised by any of the results from this survey?

  • My even shorter Amazon HQ2 shortlist

    Amazon released its shortlist of HQ2 cities this morning. Below are the 20 metropolitan areas. They were selected from 238 bids, so this shortlist represents 8.4% of the original pool.

    • Atlanta, GA
    • Austin, TX
    • Boston, MA
    • Chicago, IL
    • Columbus, OH
    • Dallas, TX
    • Denver, CO
    • Indianapolis, IN
    • Los Angeles, CA
    • Miami, FL
    • Montgomery County, MD
    • Nashville, TN
    • Newark, NJ
    • New York City, NY
    • Northern Virginia, VA
    • Philadelphia, PA
    • Pittsburgh, PA
    • Raleigh, NC
    • Toronto, ON
    • Washington D.C.

    I saw some people on Twitter say that they were surprised to see Toronto and Miami on this list. I was not. If you remember, I publicly predicted on this blog that Toronto would be selected for Amazon HQ2.

    That said, I thought it would be fun to guess at an even shorter list from Amazon’s shortlist. I have no knowledge of Amazon’s actual selections process, but if I had to guess, here is who I would cross off the list:

    • Atlanta, GA
    • Austin, TX
    • Boston, MA
    • Chicago, IL
    • Columbus, OH
    • Dallas, TX
    • Denver, CO
    • Indianapolis, IN
    • Los Angeles, CA
    • Miami, FL
    • Montgomery County, MD
    • Nashville, TN
    • Newark, NJ
    • New York City, NY
    • Northern Virginia, VA
    • Philadelphia, PA
    • Pittsburgh, PA
    • Raleigh, NC
    • Toronto, ON
    • Washington D.C.

    That leaves us with a list that looks like this:

    1. Boston, MA
    2. Miami, FL
    3. Montgomery County, MD
    4. Newark, NJ
    5. Northern Virginia, VA
    6. Toronto, ON
    7. Washington D.C.

    So why this list? I’m probably wrong, but my reasons are as follows:

    – I think Amazon will opt for a metro area on eastern time.

    – There seems to be a predilection for areas around Washington D.C., so I left Montgomery County and Northern Virginia. 

    – As wonderful as it is, New York City feels too center ice for Amazon – at least in my view. But maybe Newark places them in the catchment area.

    – The area needs to be of a certain scale so Amazon doesn’t overpower it and they have enough human capital to draw from.

    – Miami is my sleeper bet. Most people think of it simply as a resort town, but there’s a huge percentage of foreign born residents and powerful arts/design scene.

    – Talent is number one, which is why I left Boston and Toronto and why I continue to believe in Toronto. Toronto is more dynamic than Boston.

    If I had to pick just three from the above shortlist, my bets would be, in alphabetical order: Boston, Toronto, and Washington D.C. What are yours?

  • Is Trump good for Canada?

    Richard Florida and Joshua Gans just published an article in Politico called: Trump Is Making Canada Great Again. The overarching argument is that as the US closes its borders, Canada benefits. The best and brightest from around the world are coming here.

    This fall, international student applications at the University of Toronto were up 70% compared to last year. And numerous companies in Toronto are reporting “steady, double-digit increases” in the number of job applications from Americans.

    This is exactly what I was getting at when I made the pithy prediction that Amazon is going to choose Toronto for HQ2. It’s about access to human capital (though I acknowledge the political reality of selecting a city outside of the US). 

    Perhaps here or here might work for a location.

    Here is an excerpt from the Politico article that starts to speak to the importance of foreign-born workers in the US:

    As of 2013, foreign-born workers in STEM fields—science, technology engineering and math—accounted for nearly a fifth of workers with bachelor’s degrees in the United States, 40 percent of those with master’s degrees and more than half of those with Ph.D.s. In the San Jose metro area, consisting largely of Silicon Valley, immigrants comprise more than 55 percent of adults who hold advanced degrees.

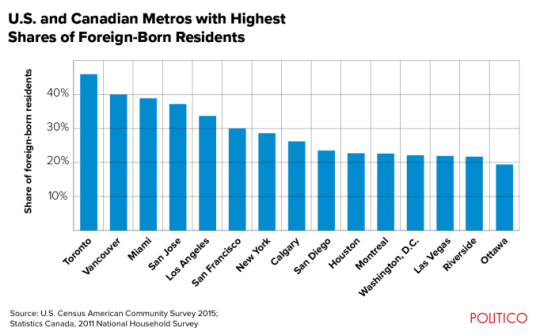
    Here is a chart showing the US and Canadian metros with the highest percentage of foreign-born residents:

    image

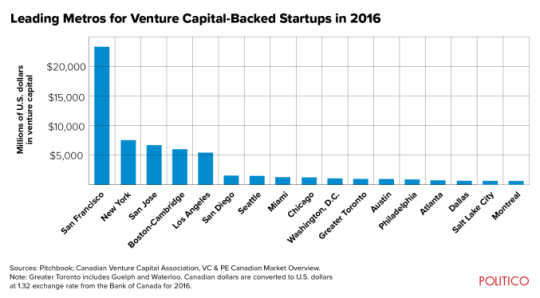
    And here is a chart showing which metro areas receive the most venture capital dollars (in millions of US dollars):

    image

    As to be expected, Toronto, Vancouver and Miami lead in terms of the percentage of foreign-born residents. Though, I would bet that Toronto’s foreign-born population is far more diverse than those of Vancouver and Miami.

    However, when you look at venture capital dollars invested, Toronto is nowhere near the top. Vancouver isn’t even on the list. And I suspect that some of you are surprised to see Miami sitting in between Chicago and Seattle (arguably a city that overperforms in tech relative to VC dollars invested). I was.

    Perhaps Trump will help with this by making Canada great again.

  • International and domestic migration in the US

    In response to President Trump’s proposed immigration bill, Brookings recently analyzed census data from earlier this year to demonstrate the importance of immigration for growth within much of the United States. 

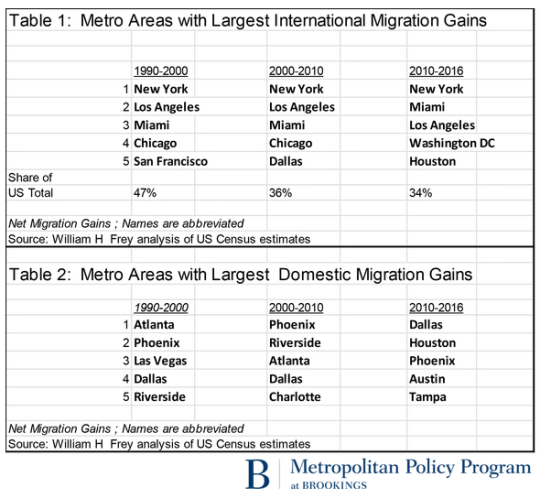
    I’d like to share three tables from their analysis.

    The first two look at international migration grains and domestic migration gains over the last 3 decades (the last decade isn’t quite a decade).

    Here you can see that New York, Los Angeles, and Miami (all port cities) have dominated international migration to the US since 1990. But at the same time, international migration has become less geographically concentrated. From 1990-2000 the top 5 cities received almost half of all immigrants moving to the US. More recently, that number has dropped to 34%.

    Domestic migration is different in that it’s a zero sum game. When one US city gains, another US city loses. Here there is a very clear migration trend toward cities in the southwest – arguably because of weather, job growth, cheaper housing, and probably a bunch of other factors.

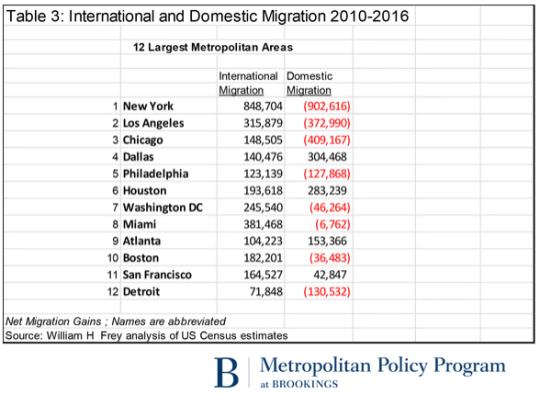
    If we look at actual international and domestic migration numbers over the last 6 years, the 12 largest metropolitan areas look like this:

    The key takeaways here are that 8 of these cities are losing people to domestic migration and only 7 of these cities have a positive net migration number – meaning their population is actually growing.

    What is clear is that the international migration column is a pretty important one if you believe that growth is valuable. 

    If you’re Dallas, Houston or Atlanta, maybe you care a little less about that column. But for most of the other cities, international migration is either the only way you’re growing (look at Miami go) or keeping your population losses in check (see Philadelphia).