Today I came across this Reddit talking about how few census tracts there are in the United States with a population density greater than 150,000 people per square mile.
Basically, there’s a bunch in New York, one in San Francisco (Tenderloin), and one in Chicago that doesn’t really count because it’s an unusually small tract. Most other American cities don’t even come close.
Looking at this New York Times mapping of the 2010 US census data, it turns out there are neighborhoods in NYC that go well beyond 150,000 people per square mile. Here’s one census tract (#154) at just over 200,000 ppsm:
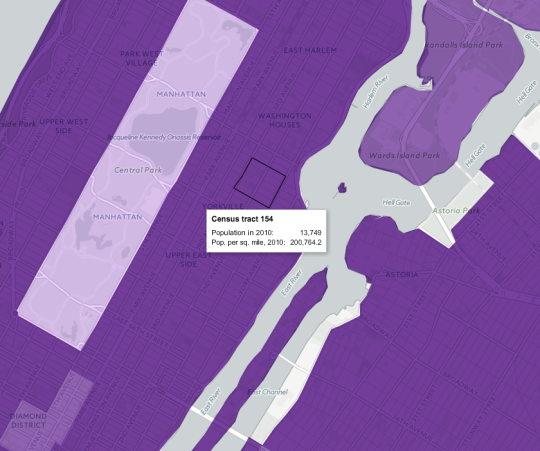
If you convert 200,764 into the globally accepted standard for measuring distances and areas, you get approximately 77,515 people per square kilometer. Pretty dense.
As a comparison, I thought I would see how this number stacks up against what is commonly referred to as the densest neighborhood in Canada: St. James Town.
If you pull up that geographic code in the 2011 Canadian census data (#5350065.00 in case you’re that nerdy), you’ll see a map boundary that looks like this:
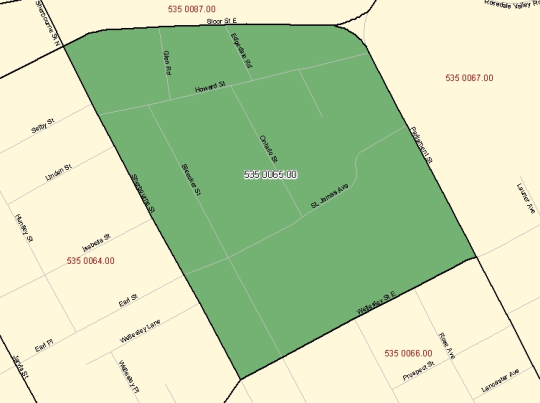
And you’ll also find a 2011 population density of approximately 60,915 people per square kilometer. Also pretty dense – though the population did decline from 2006.
Now obviously St. Jamestown is only one example. The rest of the city is, by and large, far less dense. But maybe when our 2016 census data gets released next year, we’ll find that we’ve become even denser. I suspect we will.