This is an interesting map to play around with. It allows you to see how many 15-minute neighborhoods and cities there are around the world. And it works by calculating the average time it takes to walk or bike to the closest 20 points of interest in 10,000 cities. These points include all of the usual suspects like places of work, schools, healthcare institutions, grocery stores, and so on. A blue cell indicates an average walk time < 15 minutes, and a red cell indicates an average walk time > 15 minutes. The darker the color, the shorter or longer the average time in minutes.
By this measure, it’s hard to beat many/most European cities. Here are Paris and Barcelona:


The city propers are completely blue, and you have to go pretty far out (or up into mountains) to find areas that don’t have 15-minute conveniences.
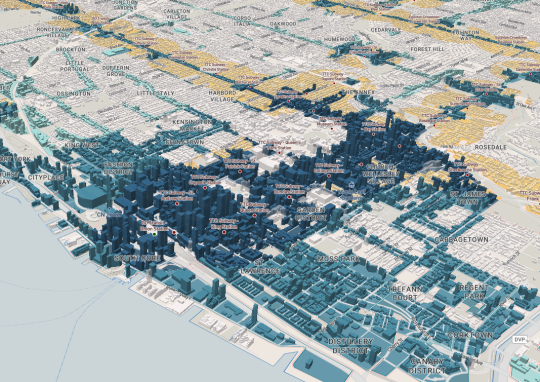
Toronto has a strong core and isn’t terrible overall, but expectedly, we aren’t as uniform and as deep blue as Paris and Barcelona:

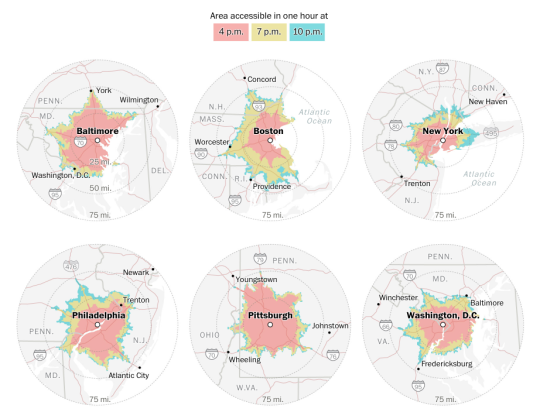
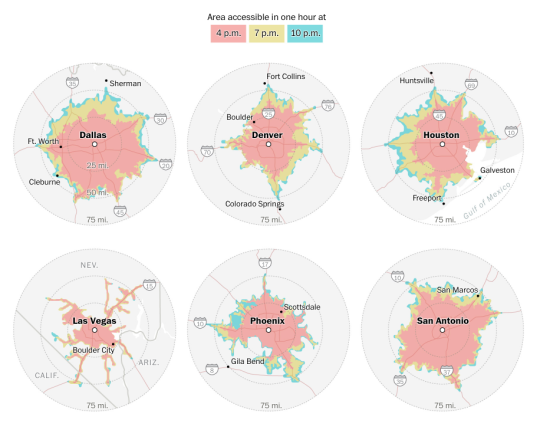
Where things get really interesting, though, is when you look at cities like Dallas and Houston:


It’s clear where these cities stand on walkability.