Daily insights for city builders, delivered every morning at 6 AM ET. I’m Brandon Donnelly — a Toronto-based real estate developer and founder of Globizen. I’ve been writing here since 2013.

Tag: manhattan

  • Louis Vuitton’s Big Duck

    When I first saw this picture of Louis Vuitton’s flagship store in Manhattan I thought it was AI. That is where we are right now. When something looks wild, I just automatically assume it’s fake. But alas, it’s not fake. Louis Vuitton is renovating their flagship store at the corner of 57th Street and 5th Avenue and so, naturally, they decided to completely cover it with luggage facade wraps.

    These wraps make the entire building look like six grey trunks stacked on top of each other and are a nod to a 19th century luggage design from the company. They even used real metal details throughout. Apparently the heaviest luggage handle weighs something like 5,000 pounds.

    This is wild and remarkable in so many ways. The scale of it is remarkable. This is a 15 storey building concealed entirely by luggage trunks. It also speaks to the scale and dominance of New York as a city. Not every city can absorb a pile of giant luggage trunks and not bat an eye. But in New York, it’s just another noteworthy thing within its relentless urban grid.

    I also can’t help but think of the work of architects Robert Venturi and Denise Scott Brown. In 1972, they published a book called Learning from Las Vegas. And in it, they defined two types of contrasting buildings: decorated sheds and ducks. Decorated sheds are, as the name suggests, nondescript buildings. Think big box stores. These buildings get their specificity from signage and other ornament because, without this, they’d just be nondescript sheds.

    Duck buildings are, on the other hand, buildings that take on a symbolic form. In other words, their shape and construction tell you what they’re all about. The term duck comes from an actual building that looks like a duck, namely The Big Duck on Long Island. This is a building that was built in the 1930s to help promote the owner’s duck farming business and is now on the US National Register of Historic Places.

    The Big Duck is and was an actual building, whereas Louis Vuitton’s trunks are just temporary construction wrap. So they’re not exactly the same thing. Still, the similarities are there. Both were erected to promote their respectiveness businesses. And both tell you, through their form, what’s meant to happen inside. So in this sense, Louis Vuitton has just created its own Big Duck.

    Photo by Brad Dickson via Dezeen
  • Manhattan’s congestion charge is back, maybe

    I first wrote about Manhattan’s proposed congestion charge back in 2018. Naturally, some people supported it and some people opposed it. Four years later, it was reported that the charge was still being considered for the area of the island south of 60th Street, and that it could generate an additional $1 billion in revenue for the city’s transportation authority. But then in June of this year, right before the charge was set to come into effect on June 30, 2024, New York Governor Kathy Hochul said “nah, let’s pause this indefinitely.” And at that point, it felt mostly dead.

    Nope: A revised tolling plan has just been announced — the charge has been reduced from $15 to $9 — and Hochul is now trying to jam it through before Trump takes office in January. Trump opposes the charge and has branded it the “most regressive tax known to womankind”, so there’s a real deadline here. This could get interesting. Do you think it will actually happen, some 6 years later? (In reality, the timeline is far longer. Congestion pricing also looked promising during the Bloomberg era, but then similarly died. And I’m sure there were even earlier proposals.)

  • Blocks and superblocks in Barcelona and Salt Lake City

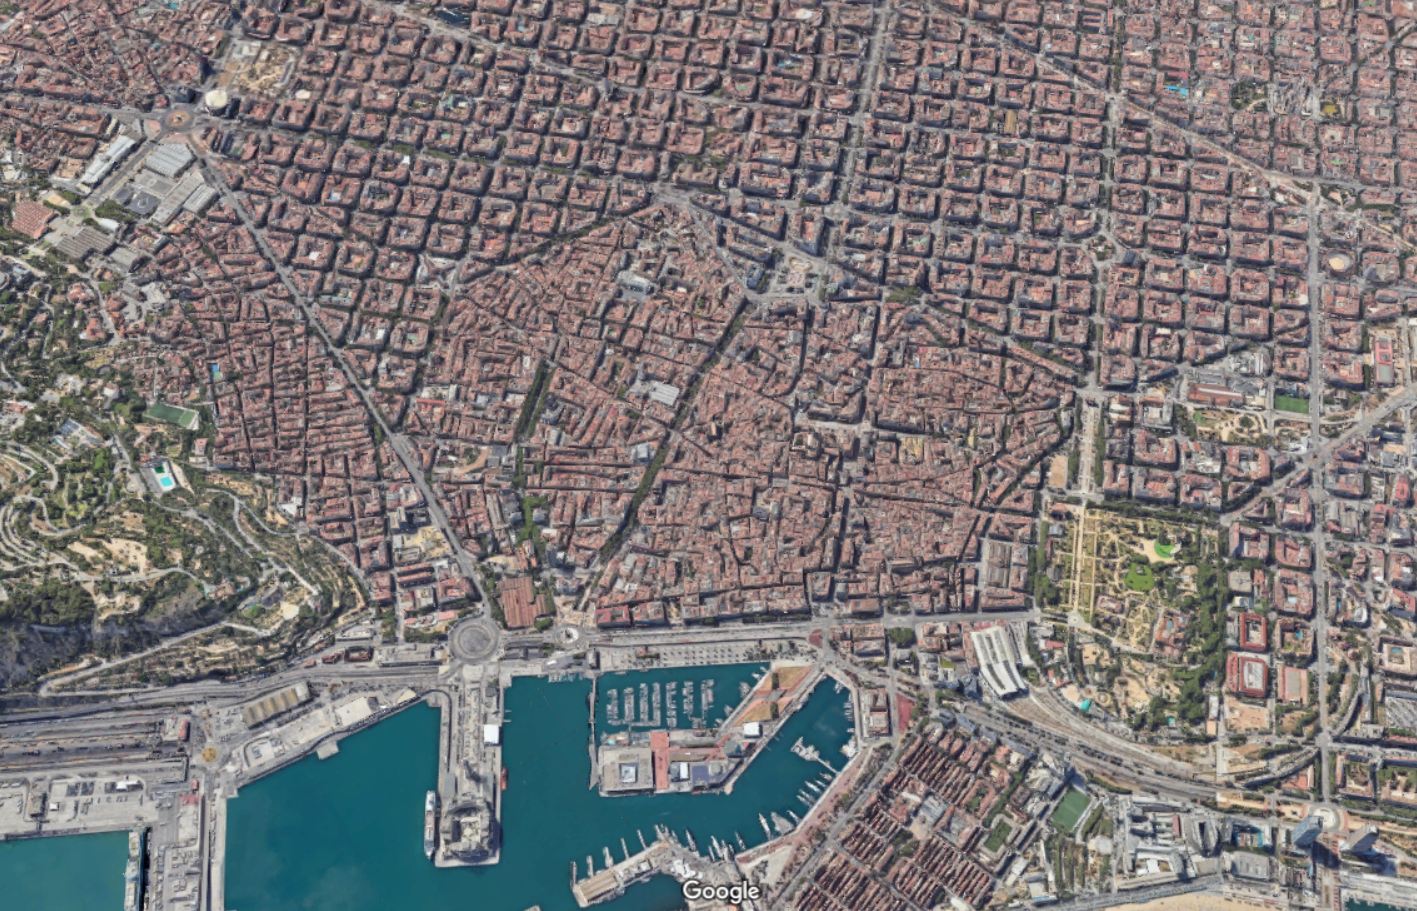
    Let’s continue with our theme of city blocks and talk about another city with a noteworthy street grid: Barcelona. Up until the middle of the 19th century, Barcelona was a tiny medieval city hemmed in by 6 km of walls and totalling just over 2 square kilometers. If you look at a map of the city today, it’s pretty easy to see where this was:

    This was of course done for military purposes. Barcelona’s medieval walls helped the city resist siege after siege. But the result was also overcrowding, unsanitary conditions, and a generally low life expectancy. So after much debate, it was eventually decided that the walls would need to come down and that the city would need to expand outward.

    This then raised the question: how should it be done?

    Enter a civil engineer named Ildefons Cerdà. Created in 1860, the Cerdá Plan for Barcelona was a continuous grid of blocks intended to guide the future growth of the city, similar to what the Commissioners’ Plan did for Manhattan. The blocks measured exactly 113.3 by 113.3 meters and each was to have a central open space of at least 800 square meters.

    In his original plan, the streets were to be 35 meters wide. But supposedly these were narrowed to no more than 20 to 30 meters due to criticism from the public. Wide streets and more lanes were, I guess, not seen as a benefit in the second half of the 19th century. Either this, or landowners simply wanted bigger buildings.

    The Cerdá Plan got approved in 1860 and, today, the city looks like this:

    One particularly unique feature of this plan was that the blocks all had/have chamfered corners. This improved visibility at the intersections, as well as created opportunities for public spaces and other uses. For better or for worse, today, you’ll find parking for cars and scooters, bike share stations, ramps leading to underground garages, patios, and more.

    The heights of the buildings on each block were also intended to be capped at a consistent height. But even with relatively few tall buildings, the Cerdà Plan led to one of the densest cities in Europe. Today, it is also viewed as a highly livable and desirable city. Hence why the city announced a total ban on short-term rentals. Too popular.

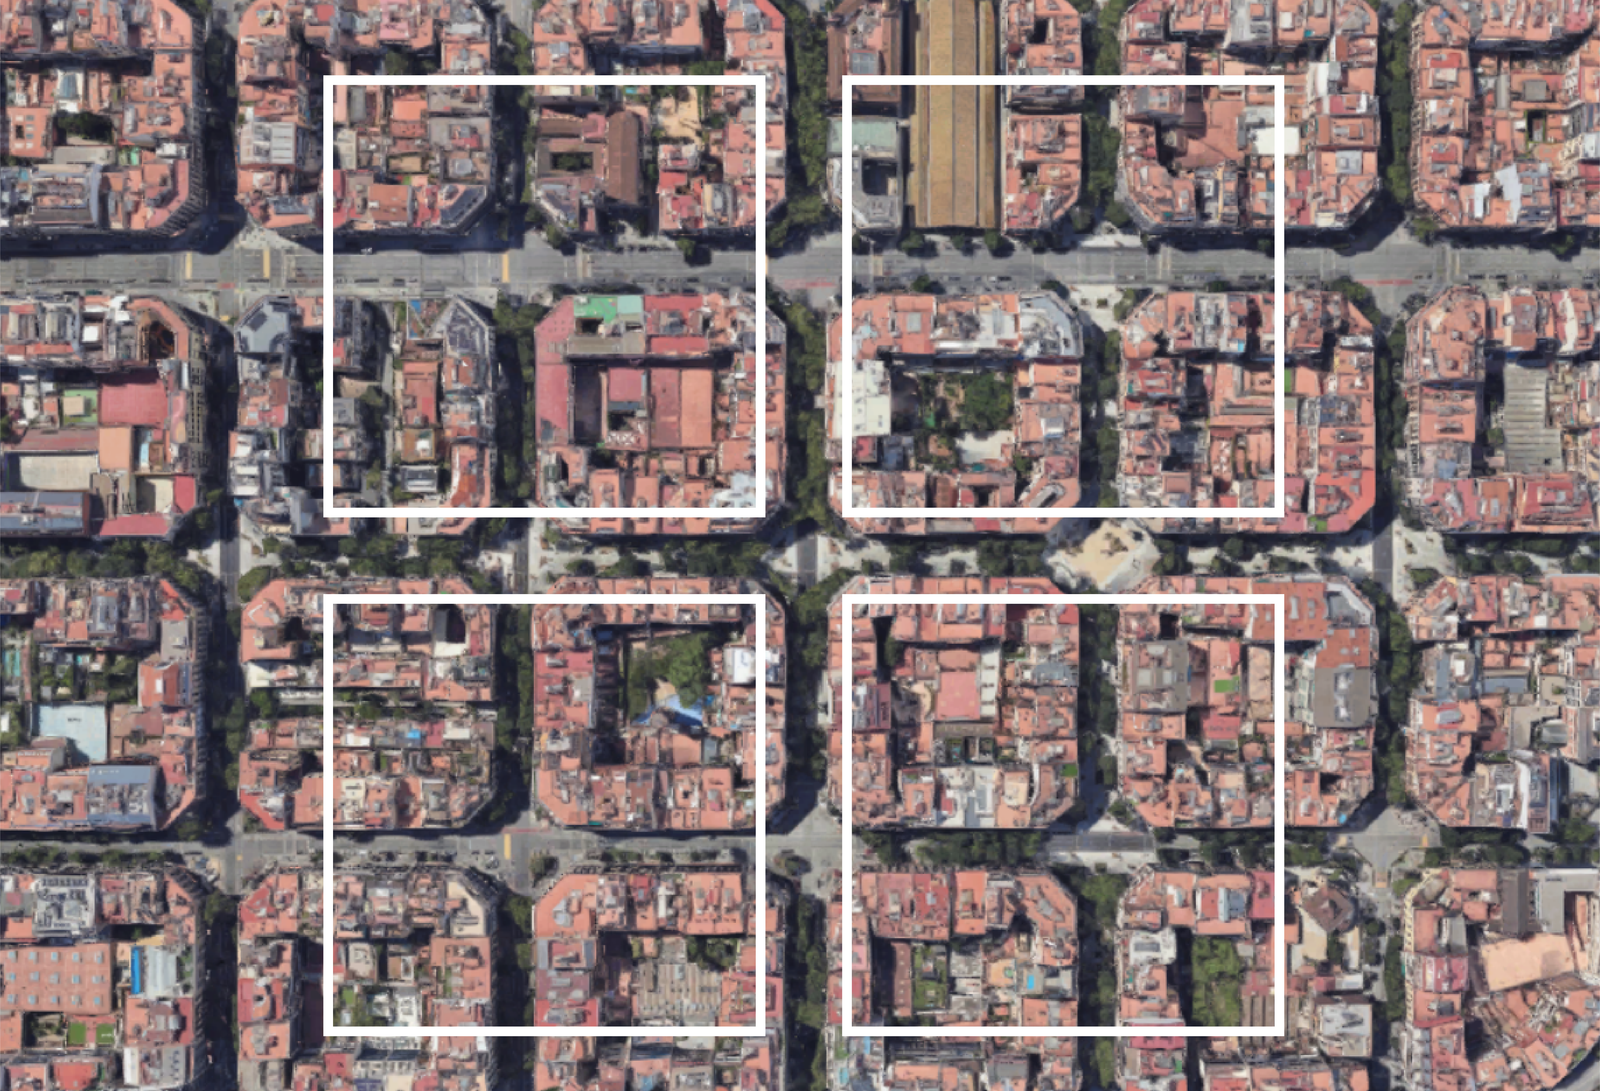
    Now for a comparison. Last week we spoke about Salt Lake City’s large city blocks (here and here). And so for fun, here’s what these blocks would look like on top of Barcelona:

    The most obvious takeaway is that Salt Lake City has larger city blocks than Barcelona, and that’s one reason why, objectively, Barcelona is more walkable and urban than SLC. But I think you could also view this graphic as a tremendous opportunity.

    Barcelona is in the midst of rethinking its urban fabric around something called “superblocks.” The idea here is to cluster blocks together and then concentrate transit and vehicular traffic along its edges, creating a more pedestrian-focused center. For example, in its largest form, a superblock might be a 3 x 3 grid, creating a grouping of 9 city blocks.

    But it doesn’t necessarily need to be a 3 x 3 grid. Other permutations are possible and the city plans to eventually introduce over 500 of them.

    The first superblock was implemented in 2017 and, not surprisingly, it improved air quality, increased quietness, and led to a significant decrease in car usage (-92%). Interestingly enough, it only led to a moderate increase in car traffic on surrounding streets (+3%). Traffic can be a funny thing.

    Creating superblocks out of smaller blocks is naturally easier than the opposite. You have an existing grid to work with. But there’s no reason that the opposite can’t also be done. And I think that’s one way to look at Salt Lake City’s street grid. It already has its superblocks. Now it’s just a question of creating all of its smaller blocks.

  • Manhattan’s sticky street

    Street networks tend to be pretty sticky. Meaning, they tend not to change very much, or at all, over time. We have spoken about this before, over the years.

    A good example of this is Broadway in Manhattan. Broadway is a world-famous street. And it’s perhaps no coincidence that it’s also the only street that runs the full length of Manhattan and breaks across the city’s regular street grid.

    The exact reasons for this are somewhat nuanced. And for a more fulsome backstory, I recommend you watch Daniel Steiner’s recent video on the topic (embedded above).

    It is alleged that Broadway started out as the Wickquasgeck trail. Meaning it pre-dates the arrival of Europeans to the island. But regardless, we know that it came before New York’s famed Commissioners’ Plan of 1811, which is the plan that gave the city its grid.

    So it would appear that, sometimes, even the most rational of plans can be no match for something even stronger: a street that already exists.

  • Rent-controlled apartment

    It is estimated that about 1% of the total housing stock in New York City is rent controlled (2019 figure), which is something different than rent stabilized.

    Generally the way the former works is that you have to have been living continuously in the home since July 1, 1971, and the building itself needs to have been constructed before 1947. If this is the case, then in theory, you should have seen relatively minor rent increases over the years.

    This was the case for the late real estate agent, Alice Mason, who died at the beginning of this year at the age of 100:

    She never left the rent-stabilized [controlled?] apartment where she held her storied dinners, in a century-old building on East 72nd Street. (In Manhattan real estate parlance, it was a classic eight, a gracious prewar layout that included three bedrooms and two maid’s rooms.) In 2011, the developer Harry Macklowe bought the building for a reported $70 million and began to turn the units into condos, buying out the tenants to do so. But Ms. Mason refused to give up her apartment. When she moved there in 1962, the rent was $400 a month. At her death, it was $2,476. The apartment below her, in the same line, was recently on the market for just under $10 million.

    Green, Penelope. “Alice Mason, Real Estate Fixer and Hostess to the Elite, Dies at 100.” The New York Times, 13 Jan. 2024, www.nytimes.com/2024/01/11/style/alice-mason-dead.html.

    For better or for worse, this is an obviously awesome deal, and reason enough to never move and have family members move in with you before you die so that you can try and pass down this asset for generations to come.

  • More retailers are buying real estate in New York

    Last week we spoke about how many businesses don’t want to own their own real estate, but that some do. We then spoke about Prada’s recent acquisition of 720 and 724 Fifth Avenue for $835 million. However, they’re not the only ones. According to New York’s The Real Deal (thank you John Bell for the article), last year saw the following transactions:

    • Swiss fashion house Akris bought a property from SL Green for $40.6 million
    • Japanese coffee retailer Geshary bought a property on Fifth Avenue from the Riese Organization for $38 million
    • And Dyson bought a building in Soho for $60 million

    Now, some, or a lot of this, is strategic. New York is New York, and global brands need to be there. Another part of this is that there was less competition last year. Fewer real estate companies wanted to buy retail and office buildings, and so end users seem to have stepped in at what they presumably saw as favourable prices.

    But it’s also not totally foreign for retailers to want to own their own real estate. Perhaps the most famous example is McDonald’s, which owns its own real estate and then leases it out to franchisees. Though as I alluded to last week, it’s important to know what business you’re ultimately in. And McDonald’s knows it’s in the real estate business.

  • Geography of activity centers

    We need more “activity centers”. That is my takeaway from this report by Brookings.

    Activity centers are exactly what they sound like. But to be more specific, the definition used in the report is based on five categories of assets: community, tourism, consumption, institutional, and economic. And what the authors did was look at the relative concentration of each across the 110 metropolitan statistical areas (MSAs) in the US with at least 500,000 residents.

    They then came up with 3 different kinds of activity centers. Monocenters (blue in the above map), secondary centers (yellow), and primary centers (orange). Monocenters have, as you’d probably expect, a lot of one kind of asset. Secondary centers, on the other hand, have “some of at least two kinds of assets.” And primary centers have “a lot of at least two kinds of assets.”

    Looking at the above map, it is pretty clear — and not at all surprising — that Manhattan is, for the most part, one giant activity center. There is a lot going on. But this is not the typical condition. In the 110 metro areas looked at in the study, activity centers only occupy about 3% of land on average. The remaining 97% of land is, based on the above definition, a non-activity center.

    Why this matters is that activity centers punch above their weight. Despite representing a small land area, activity centers are home to 40% of all private sector jobs in the US. Supposedly, they also increase productivity (by an additional ~$1,723 per worker), yield higher property values (+26%), increase inclusivity, and reduce vehicle miles travelled.

    So yeah, more activity centers sounds like a good thing for our cities. Though as we have learned in recent years, we need to be careful with monocenters.

    Map: Brookings

  • Bad and good street networks

    Let’s add some historical context to yesterday’s post about autonomous vehicles. As the regular non-autonomous version of cars started to infiltrate our cities in the early 20th century, largely following the creation of the mass-produced Ford Model T, there was a general view that cars were dangerous and a menace to cities. Arguably, not much has changed.

    So in the 1930s, the Federal Housing Authority decided to publish a pamphlet explaining what street networks it thought were suitable for this new emerging car world and which street networks were not. The exact terms that they used were “bad” and “good”, and here’s what that looked like (taken from this CNU article):

    The “bad” ones are largely how the US liked to design its cities before the arrival of the car. Some historic settlements, like Boston and Manhattan south of 14th street were based on different street logics, but as far back as the 1680s, William Penn had already started laying out a grid iron plan for Philadelphia. And in reality, this kind of street pattern goes all the way back to ancient cities.

    However, when the car arrived, these grid iron plans were thought to offer an inadequate amount of separation between people and machine. The solution was to optimize around the car and introduce a clear hierarchy of different streets. Big streets for moving cars quickly, and smaller streets, like cul-de-sacs, for people to live on.

    These “good” examples, of course, represent the modern suburb. But we now recognize that these types of street networks are unequivocally terrible for walkability, the environment, public health, social equity, and a whole host of other things. I mean, look at this extreme example of two suburban homes in Orlando whose backyards adjoin but are technically separated by 7 miles and a 20-minute drive!

    My point with all of this is that, for many/most at the time, this was progress. Cars were the future and there was optimism about the kind of freedoms and other benefits that they would bring to people. And this optimism is perhaps not all that different from what many people feel today, myself included, when it comes to autonomous vehicles.

    So on the one hand, you could point to the car and say, “look at all the damage that this thing did to our cities. Let’s not do that again. Autonomous vehicles must be stopped.” But that’s akin to wishing the car was never invented. Another option is to point to the negative externalities associated with the car and say, “look at what we’ve done. We can do better. Let’s make our cities better.”

    Positive change, no matter how late, is always a possibility.

  • What is the correlation between urban density and housing affordability?

    There’s lots of data out there to suggest that there is a correlation between urban density and housing unaffordability. Take Hong Kong. It is very dense, and also one of the most expensive housing markets in the world. But I think the real question is: does urban density actually cause housing unaffordability, or do the two simply tend to be correlated when you plot a country’s biggest cities?

    One the one hand, there are factors that do drive up home prices when you build more densely. Building a reinforced-concrete high-rise is always going to be more expensive on a per square foot basis than building a wood-framed bungalow. But of course, the former also uses land a lot more efficiently, which is what you need to do in big and supply-constrained cities.

    Michael Lewyn’s view (credit to Robert Wright for sending me the article) is that density is incorrectly used as a scapegoat to fight compact development. It does not actually cause higher rents. One counter example he gives is that of Manhattan, which went from 2.3 million people in 1910 to just under 1.7 million in 2020. In other words, it got less dense, while at the same time its rents grew exponentially.

    Like most important city matters, the answer is complicated. But this is an interesting topic that I think we should spend more time on here.

  • A “New” New York

    Earlier this year, the Mayor of New York City, Eric Adams, and the Governor of New York, Kathy Hochul, assembled a panel of civic leaders and industry experts to try and come up with a plan for a “New” New York.

    Initially, this panel was intended to be entirely focused on reviving the city’s business districts, and in particular those that have been slow to recover from the pandemic. But scope creep happens and it ultimately grew to include two other important goals: make it easier to get around and encourage “inclusive, future-focused growth.”

    The recommendations from this panel were released today and it’s in the form of a report with 40 specific initiatives. In keeping with its original intent, the first recommended initiative is one that you would expect: “Make Midtown and other business districts more live-work-play.” And what that means is the following:

    We will remove barriers that have kept Midtown and other business districts stagnant by making it easier to convert and redevelop outdated office buildings to other uses, including residential, thereby empowering the market to create more vibrant, mixed-use districts. We will also update old-fashioned regulatory codes that have prevented small businesses from locating, expanding, and innovating in those districts, providing zoning flexibility for businesses to thrive. And we will unite our business districts behind a shared goal of vitality by aligning incentives for businesses to help maintain vibrant business districts.

    New York isn’t the first city to be encouraging office-to-residential conversions and it certainly isn’t going to be the last. I think most of you know that I am a firm believer in office-centric cultures and that I’m in mine 5 days a week. But this is a recalibration that is going to need to take place in some submarkets.

    And here is one of the capitals of the world — New York City — telling us that it needs to happen there.