Daily insights for city builders, delivered every morning at 6 AM ET. I’m Brandon Donnelly — a Toronto-based real estate developer and founder of Globizen. I’ve been writing here since 2013.

Tag: las vegas

  • Delivering happiness

    I was both surprised and saddened to learn about the death of Tony Hsieh this weekend. Forty-six years old is far too young.

    Though best known as a pioneer of e-commerce (he was previously CEO of Zappos) and for his brilliant/wacky management ideas, Tony was also a city builder, particularly in Las Vegas.

    Here’s an excerpt from a recent WSJ article:

    In Las Vegas, Mr. Hsieh became beloved locally for investing $350 million into revitalizing part of the city’s downtown including real estate, restaurants, retail and a tech startup fund starting in 2012. His vision included the development Container Park, a quirky shopping and entertainment center where retailers operate in converted shipping containers. Visitors are greeted by a giant sculpture of a praying mantis that shoots fire.

    But perhaps more importantly, everything I have read this weekend about Tony describes him as a good human being with a great sense of humor and a commitment to “delivering happiness.”

    Here’s another excerpt from the same article:

    After Zappos had a rash of late deliveries, he sent an apology note to customers and provided a phone number for use by anyone who suffered “undue hardship.” As for those who were merely annoyed, he said, they were welcome to call Zappos and “ask whoever answers the phone to do something weird and embarrassing, like sing ‘I’m a Little Teacup.’”

    Happiness. I can’t think of anything better to be delivering to people in the world right now.

  • Job mixes and job losses

    Recent job posting data from Indeed has revealed a bit of a paradox. The metro areas where more people are able to work from home — i.e. tech hubs and finance centers — have experienced larger job posting declines compared to all other US metros, as well as to tourism destinations such as Las Vegas and Orlando.

    We know that the hospitality and tourism sector has been the hardest hit by the current environment. But that doesn’t appear to be the biggest driver for overall job losses. In fact, one of the key takeaways is that job losses between February and June 2020 look to be correlated with metro size. That is, the bigger the city, the greater the job losses (% change).

    So what’s going on?

    Well, according to Indeed, it’s important to look at the local job mix. In “work-from-home metros” like Seattle, San Francisco, and Boston, there has been a relatively high percentage of people who were able to quickly transition to working from home. This is reflected in the anonymized mobile-device data for these cities. More people at home. Less mobility. And a seemingly stronger adherence to social-distancing protocols.

    The problem with this outcome is that it crushes most of the in-person sectors and businesses that relied on this workforce moving about the city — things like food prep and beauty & wellness. I mean, just think about all of the food businesses that survive off lunches in a CBD. According to Indeed, it is these sorts of local economic connections that have really been driving the declines in job postings and overall payroll employment during lockdown.

  • The world’s first programmable city — Woven City

    Last week was CES in Las Vegas. Some or many of you were probably there. One of the things that was announced at the show was a project by Bjarke Ingels Group for Toyota called the Woven City. Situated at the base of Mount Fuji in Japan, the development sits on a 70 hectare site and will eventually house some 2,000 people.

    The objective is for it to act as a living laboratory for a number of new city building initiatives, ranging from autonomy and mobility as a service to multi-generational living and hydrogen-powered infrastructure. Woven City is intended to house not only residents, but also researchers who can test out and learn from these new ideas.

    Below is a short video from Dezeen. It’s entirely visual. No words. There’s also an official website, but not much is up there yet. Hopefully there will be more soon. Construction is set to start next year (2021) and it’ll be BIG’s first project in Japan.

  • Mobility at CES

    CES is underway right now in Las Vegas. About 200,000 people are in attendance. 

    Since tech and mobility are today closely intertwined, the show has become an important platform for the automative industry.

    Here is a video showcasing BMW’s new iNext concept (expected by 2021):

    [youtube https://www.youtube.com/watch?v=x9-f3cALABk&w=560&h=315]

    It is based on level 3 autonomy, which means the car will do mostly everything, but you need to be ready to take over at any time.

    The video is interesting because it begins to show you what becomes possible when you no longer need to pay attention to the road. It is a bit like flying (but hopefully more enjoyable). 

    And here is a video of Bell’s new urban air taxi, which is called Nexus (expected by the mid-2020s):

    [youtube https://www.youtube.com/watch?v=1o4d8N-A1G8&w=560&h=315]

    This is the company’s first concept. But they’ve been working with Uber since 2017 to develop a network of flying taxis for cities.

    Finally, flying cars.

  • Detroit. Move here. Move the world.

    As part of the Amazon HQ2 bid process, a number of cities produced videos. I only discovered them today and so maybe some of you also missed them when they were released last fall. There are videos from Detroit, Boston, Pittsburgh, Philadelphia, Dallas-Fort Worth, Las Vegas, Louisville, Atlanta, and maybe others that I am still missing. 

    Some of the videos are bad. (I’ll let you make your own judgement calls.) I like the idea behind Atlanta’s video, which is the journey of someone named Georgia physically delivering their bid to Seattle. And Philadelphia’s video made me feel really nostalgic about my time there. Those were some great years. 

    But my favorite video is Detroit’s video. It feels authentic. The footage is outstanding. And it feels powerful. Though it is probably too long. It was a good reminder that I’m overdue for a visit. So here is Detroit’s video. If you can’t see it below, click over to YouTube.

    [youtube https://www.youtube.com/watch?v=DO4J_PC1b5M&w=560&h=315]

  • How U.S. cities make money

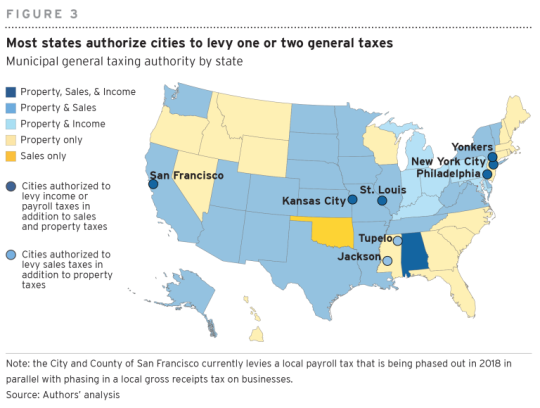
    The below figure shows the taxing authority of US cities by state. In some cases there’s a city or two with additional taxing authority. New York City, for instance, has been authorized by the state to levy property, sales, and income taxes, whereas other cities in the state can only levy property and sales taxes.

    image

    The figure is from a recent report by Brookings called, City budgets in an era of increased uncertainty. In addition to revenue sources, the report also covers spending limits and tax structure alignment. 

    The report concludes that cities generally have a stronger fiscal position when their tax structure aligns with their economy. For example, cities such as Las Vegas that have lower than average property values and are only authorized to collect property taxes, do not score well.

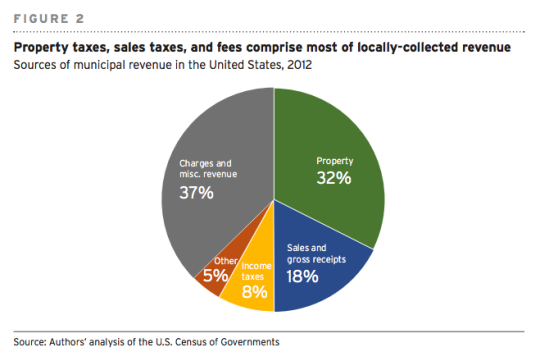
    One thing that the above figure does not get across is that more money now comes in from non-tax revenues, user fees, and other charges. According to 2012 census data, 37% of all municipal revenue in the United States came from these sorts of charges.

    image

    To download a PDF of the full report, click here.

  • Why Detroit lost the Amazon HQ2 bid

    Dan Gilbert – billionaire Detroit promoter and owner of the Cleveland Cavaliers – penned this statement in response to the city’s failed Amazon HQ2 bid. He chalked up the loss to reputational hangover:

    We are still dealing with the unique radioactive-like reputational fallout of 50-60 years of economic decline, disinvestment, municipal bankruptcy, and all of the other associated negative consequences of that extraordinarily long period of time.

    This was the “elephant in the room”, though his statement is primarily centered around both talent and transportation – the two critical and lacking ingredients that allegedly disqualified Detroit.

    He ends by stressing the importance of physically visiting Detroit 2018. That is the only way, he says, people will fully appreciate the change and momentum that has taken hold in the city. (I experienced Detroit 2016 so I guess I’m overdue.)

    In response to this, Aaron Renn wrote this follow-up post suggesting that Dan take a page out of Tony Hsieh’s playbook. Tony is the founder of Zappos and the Downtown Project in Las Vegas. 

    To bring people to downtown Las Vegas, Tony – somewhat famously – rented 50 apartments in one of the only high-rises, called them “crash pads”, and offered them out for free to people who wanted to come and check out what was happening in downtown Vegas and with the Downtown Project.

    That’s certainly one way to lower the friction. 

    Equally interesting to me about this strategy, though, is that it was presumably necessary (he did it, right?) just to bring people to another part of Vegas, let alone another city altogether. 

    Full disclosure, I’ve never been to Vegas. But I understand that many people visit the place. So for me it speaks to the kinds of inducements that may be necessary just to revive or kickstart a place.

    Photo by Matthew Brzozowski on Unsplash

  • One hour drive

    I’m taking next week off so that I can respond to emails from various places in Ontario and Quebec instead of from my desk. The out of office messages really fly at this time of year, so it’s usually a pretty good time to try for a recharge.

    Because of that, this post feels appropriate. 

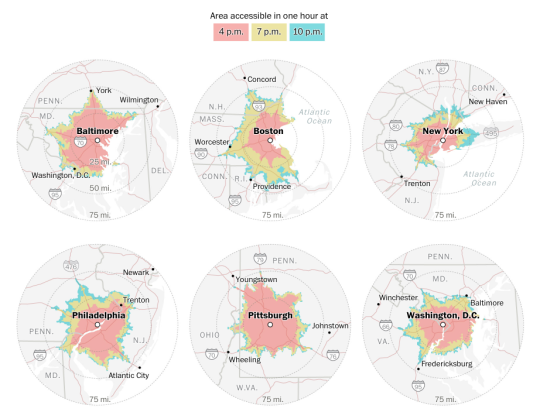
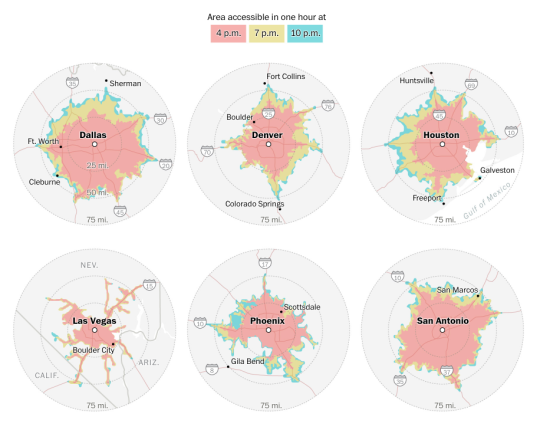
    Sahil Chinoy of the Washington Post recently looked at anonymous cell phone and vehicle data (from Here Technologies) to see how far you could drive in one hour if you were trying to escape the downtown of various U.S. cities on a Friday afternoon in the summer.

    This exercise was done for 3 departure times on July 28, 2017: 4pm, 7pm and 10pm. The mappings all leverage 3 years of historical speed data.

    Here is a first set of maps showing a few cities in the northeast and in the mid-atlantic. Every city is shown at the same scale so that they can be easily compared.

    image

    And here is a second set of maps showing a few, more car-oriented, cities.

    image

    Not surprisingly, older transit-oriented cities like New York don’t do well in this contest. No matter what time you leave, it’s hard to make it past 30 miles. Whereas in the case of Vegas, it doesn’t really matter what time you leave. You should be able to clear 50 miles.

    That’s the other interesting thing to note about these maps – the spread between distances at the various times.

    I’m sharing these because I’m a sucker for diagrams, but I don’t think they tell the whole story. The modal splits and the population and employment densities are all very different across these cities. New York’s core competency is in moving lots of people in trains, not in cars.

    Although, perhaps the ironic thing about these diagrams is that a tighter drive radius might actually say something about how efficiently land is being used.

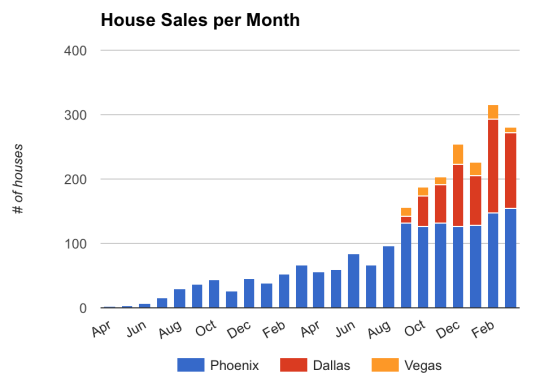
  • Opendoor is now selling ~300 homes per month

    Farhad Manjoo of the New York Times published an article this morning about Opendoor – a startup that I have written about multiple times on this blog – called, The Rise of the Fat Start-Up. (His definition of “fat” is that the startup owns lots of hard assets, which considered atypical in tech.)

    Below are a couple of interesting tidbits from the article:

    • Opendoor has raised over $300 million in equity and over $500 million in debt since inception.
    • Opendoor plans to be in 10 cities by the end of this year.
    • Average commission charged on Opendoor is 7.5%, which is higher than a traditional real estate agent and higher than what was quoted before in the press. The higher % is because of certainty and convenience.
    • Opendoor offers a leaseback option if you’d like to stay in your house for a period of time after you’ve sold it.
    • Their conversion rate (offers made to closings) is about 30%.
    • Other startups are now in the market with similar models, including Offerpad and Knock. Zillow is working with Offerpad on a pilot. Someone is starting to feel threatened.

    The article also quotes a blogger and real estate analyst named Mike Delprete. Heads-up: His blog is called “Adventures in Real Estate Tech.” I’m sure this will appeal to many of you. I obviously just subscribed.

    Mike dug into MLS records in order to figure out Opendoor’s transaction volumes, since the company is not releasing this information. Here’s what he found (the chart is up to March 2017):

    The trend line is certainly moving in the right direction. But Mike also believes that Opendoor is only netting around $8,320 in profit per home and that much of it is driven by appreciation. There’s also substantial risk in owning so many homes – each one is usually held for a few months.

    But you can be sure they’re thinking well beyond where they are at today. Expect many more updates on this blog.

  • Sprawling, but affordable

    The Wall Street Journal recently published an interesting article that ties in nicely with two of my recent posts. My post about North American population growth and my post about the San Francisco pro-development group known as BARF.

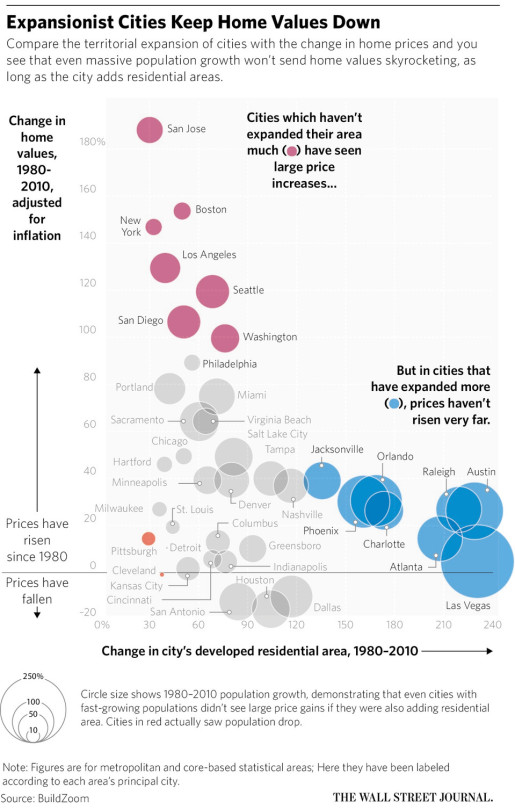
    The WSJ article is about the growing divide between affordable and expensive cities in the US. And the argument is that expansionist, or sprawling, cities are better at suppressing home values and maintaining affordability:

    “The developed residential area in Atlanta, for example, grew by 208% from 1980 to 2010 and real home values grew by 14%. In contrast, in the San Francisco-San Jose area, developed residential land grew by just 30%, while homes values grew by 188%.”

    Now, here’s a chart saying that same thing:

    The reality is that greenfield development (suburban sprawl) generally has far fewer barriers to development than urban infill development. So I’m not surprised to see cities like Las Vegas, Atlanta, and Phoenix clustered towards the bottom right.

    At the same time though, I’m obviously not convinced that sprawl is an optimal outcome. I think there are other costs not reflected in the chart above. So what’s the best solution here, assuming we want to build inclusive mixed-income cities?