Daily insights for city builders, delivered every morning at 6 AM ET. I’m Brandon Donnelly — a Toronto-based real estate developer and founder of Globizen. I’ve been writing here since 2013.

Tag: knight frank

  • Prime property appreciation around the world

    Every year for the last decade, Knight Frank has published something called The Wealth Report. I’ve written about it before, but it’s basically a look at “prime property” and global wealth.

    As part of the report, they have something called the PIRI 100. It’s their “Prime International Residential Index”, which looks at luxury residential property prices around the world. They generally define “prime property” as being the top 5% of each market according to value.

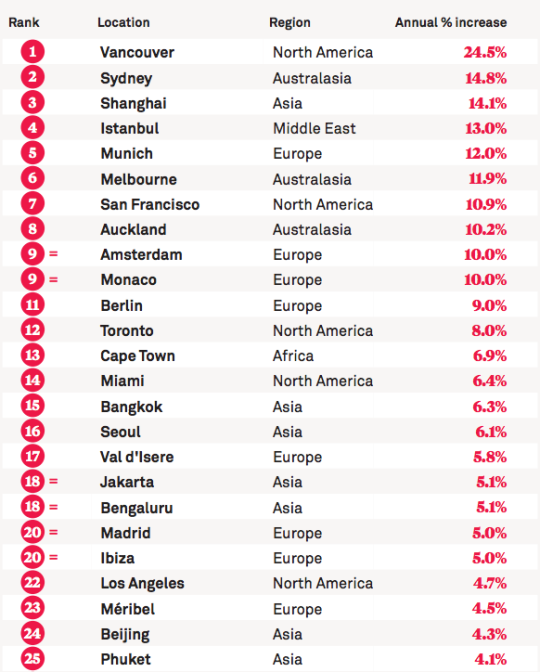
    This year, the top 25 locations in their PIRI 100 are as follows (for the most part, the data is up to December 2015):
    image

    Here in Canada, we like to talk about the insanity of the Vancouver and Toronto real estate markets. This list helps to put that into perspective. Even by global standards, Vancouver is at the top of the pack by quite a significant margin. 

    It’s worth noting that since this is a “prime property” index, it’s pretty safe to assume that the buyer profiles for these sorts of properties would have a significant international bias. So in a way, this list is really about global capital flows.

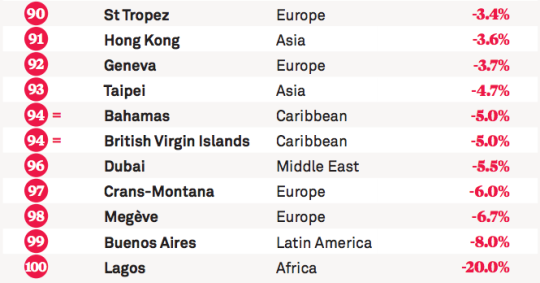
    Here are the bottom 10 locations on this year’s list:
    image

    If you’d like to see the full list, click here.
  • Global home prices at the end of 2015

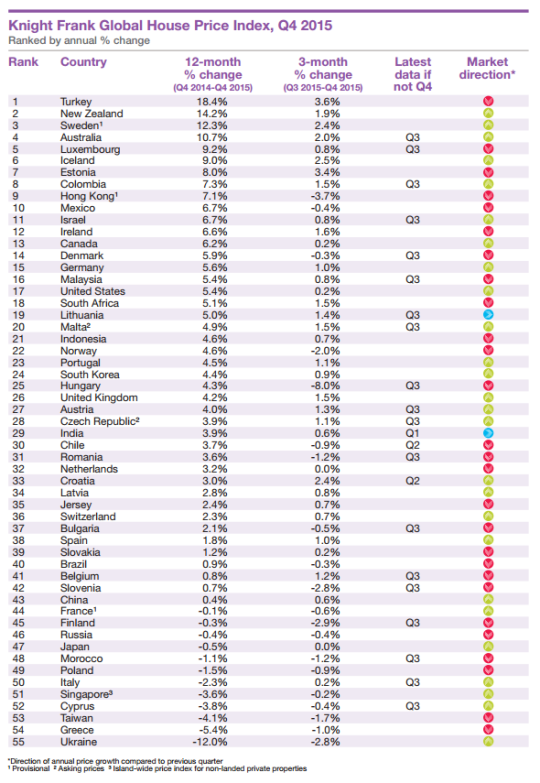
    Seeing how we’ve started looking at data from last year, I thought it would be interesting to look at global home prices as of Q4 2015. Here’s a chart from Knight Frank, which they refer to as their Global House Price Index:

    At the top of the list is Turkey, with an 18.4% increase from Q4 2014 to Q4 2015. (Supposedly this is because it has recently become easier for foreigners to buy property in the country.) Canada is 13th with a 6.2% increase (during this same time period) and the United States is 17th at 5.4%.

    This is obviously a high level analysis. There are lots of regional and local variations within each country. For instance in Canada right now, Calgary is a very different place than, say, Vancouver or Toronto.

    Nonetheless, it’s still valuable to see the relative performance of each country and see what their (Knight Frank’s) prediction is for 2016:

    “Our outlook for 2016 is muted. We expect the index’s overall rate of growth to be weaker in 2016 than 2015. The global economy is experiencing a potentially dangerous cocktail of low oil prices, a strong [US] dollar and a continued slowdown in China.”

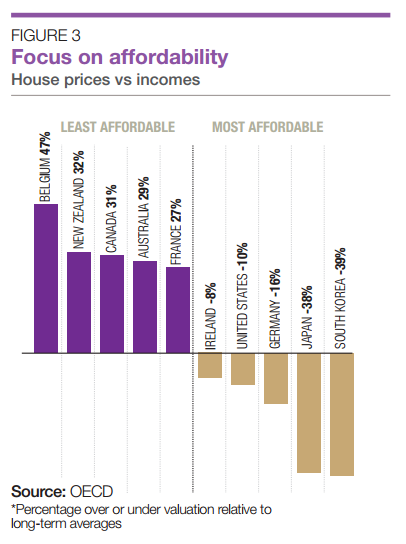
    It’s also interesting to see how the countries rank in terms of affordability:

    Once again, Canada ranks as being one of the least affordable countries in terms of home prices.