Daily insights for city builders, delivered every morning at 6 AM ET. I’m Brandon Donnelly — a Toronto-based real estate developer and founder of Globizen. I’ve been writing here since 2013.

Tag: income inequality

  • A moral compass for autonomous vehicles

    One of the challenges that self-driving vehicles present is not about technology per se, it is about ethics. The typical example scenario is this one: If a pedestrian were to step out in front of an autonomous vehicle illegally, should the car be programmed to hit the pedestrian or veer off the road at the risk of potentially harming its passengers?

    I believe that self-driving vehicles will ultimately result in fewer accidents. Statistically they will be safer. But self-driving vehicles, particularly early on, are going to get a lot of attention when they do get into accidents, even if they are still safer as a whole. And that’s because they will make for good headlines.

    Safety and statistics aside, in turns out that the answer to the above moral question could depend on where you’re from. Nature recently published what they are calling the largest ever survey of “machine ethics.” And out of this survey they discovered some pretty distinct regional variations across the 130 different countries that responded.

    The responses were able to be grouped into 3 main buckets: Western, Eastern, and Southern. Here is the moral compass that was published in Nature:
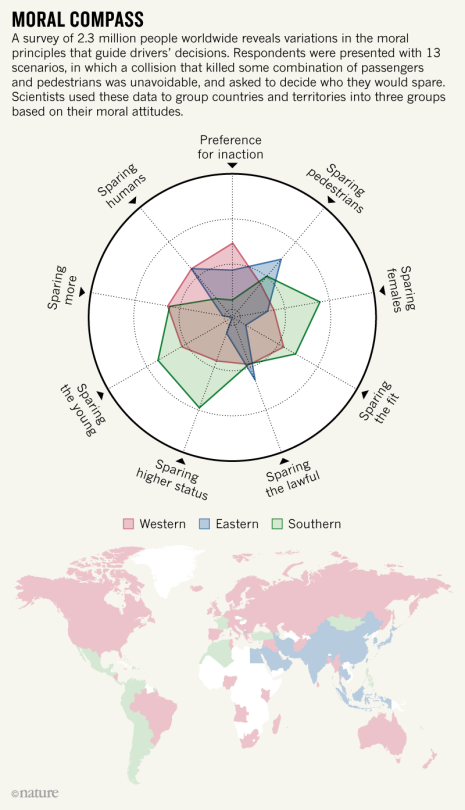
    And here are a few examples. In North America and in some European countries where Christianity has historically dominated, there was a preference to sacrifice older lives for younger ones. So that would guide how one might program the car for the case in which a pedestrian steps out in front.

    In countries with strong government institutions, such as Japan and Finland, people were more likely to say that the pedestrian – who, remember, stepped out onto the road illegally – should be hit. Whereas countries with a high level of income inequality, often chose to kill poorer people in order to save richer people. Colombia, for example, responded this way.

    Also interesting is the ethical paradox that this discussion raises. Throughout the survey, many people responded by saying that, in our example here, the pedestrian should be saved at the expense of the passengers. But they also responded by saying that they would never ever buy a car that would do this. Their safety comes first in the buying decision. And I can see that.

    There’s an argument that these are fairly low probability scenarios. I mean, the last time you swerved your car, you probably weren’t driving on the edge of a cliff where any deviation from the path meant you would tumble to your death. But I still think that these are infinitely interesting questions that will need to be answered. And perhaps the answer will depend on which city you’re in.
  • Rural America is the new inner city

    There’s an argument going around these days that rural America is the new inner city. That is, rural America has replaced inner cities as the geographies facing the greatest socioeconomic challenges. 

    In fact, it’s time for the stigma associated with the term “inner city” to disappear – if it hasn’t already. Blight no longer seems to be the concern. Instead, the concern is that our inner cities are becoming exclusive enclaves for the rich.

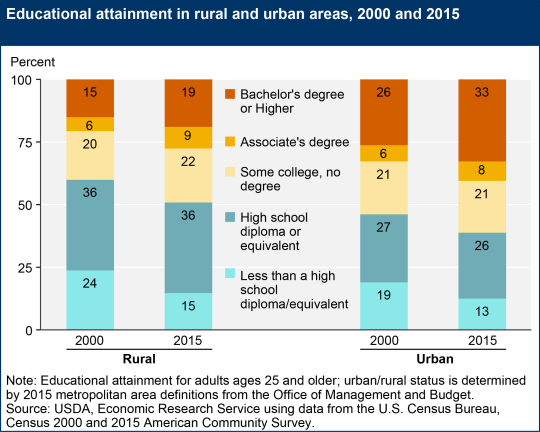
    The United States Department of Agriculture recently published data on educational attainment within rural areas. And since education is one of the biggest drivers of economic prosperity, it’s valuable to look at this data. 

    The first thing to note is that while educational attainment within rural areas is increasing, it still lags urban areas:

    image

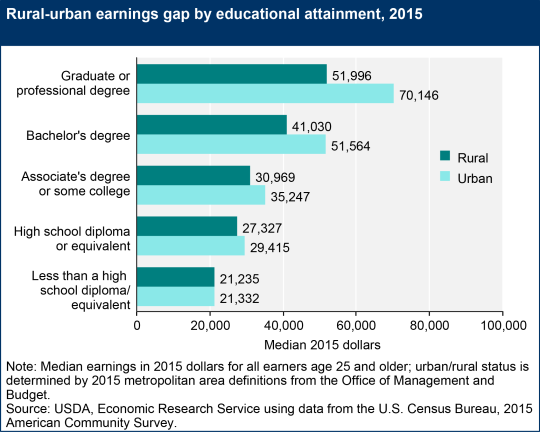
    The second thing to note is that even with the same level of higher education, the labor market will generally pay you more if you live in an urban area:

    image

    However, the spread between rural-urban increases as you move up the education ladder. With less than a school diploma, there isn’t much difference. But with a graduate or professional degree, there’s about a ~35% increase in earnings, on average, according to the above chart.

    So it should come as no surprise that many smart and educated people are choosing to live in urban areas. They should make more money.

    All charts from the U.S. Department of Agriculture.

  • The Canadian Dream (and 5 things that hurt upward mobility)

    image

    About 7.5% of American children born into the bottom quintile of the income distribution will eventually make it into the top one fifth. In the UK this number is about 9%. And in Canada and Denmark, the numbers are 13% and 13.5%, respectively. (The upper bound for these numbers is 20% since you can’t have more than 20% in the top 20% of the income distribution.)

    Because of stats such as these, Freakeconomics recently asked: Is the American Dream really dead? And if so, should it instead be called the Canadian Dream, seeing how it’s more readily obtained.

    Of course, it’s not necessarily as simple as 7.5% vs. 13%. Upward mobility exhibits a lot of regional variation. In the American southeast, the number is closer to 4%. Whereas in the San Francisco Bay Area, the number is up there with Canada and Denmark. However, this phenomenon is so location-specific that even kids growing up in San Francisco are twice as likely to get to the top 20% compared to kids growing up across the bridge in Oakland.

    There’s also a question of spread. Canada and Denmark have less income inequality, meaning you don’t have to travel as far to get to the top of the income distribution. 

    Still, the reality is that it is becoming harder for Americans to climb the socioeconomic ladder. The number of 30-year old Americans who today earn more than their parents is dropping compared to previous decades. So what needs to be done? What is causing this erosion of the American Dream?

    It turns out that city builders have an important role to play in solving this problem. Because where you live – and in particular where you grow up as a kid – matters.

    The Freakeconomics episode examines a study that was done by Raj Chetty, Nathaniel Hendren, and Lawrence Katz, called: The Effects of Exposure to Better Neighborhoods on Children. And their findings were exactly that. Place matters. The study reexamines the findings of a program that was administered in the mid 1990′s in the US called Moving to Opportunity (MTO). This program randomly offered families living in high-poverty neighborhoods the opportunity to move to neighborhoods with far less poverty. 

    Upon initial review, the program was seen as a failure. There were some positive health outcomes, but no meaningful changes in income. But when Chetty and company took another look at the data – now with more time and IRS data on their side – they discovered that the impact was in fact dramatic. Relocated families raised children that earned 30% more, were 27% more likely to go to college, and 30% less likely to be a single parent. The key, however, was that the children had to relocate when they were young (< 13 year olds). The older they got, the less benefit they received from moving, eventually reaching a plateau where there was basically no benefit at all.

    Here are the 5 things that ended up having significance in their findings:

    1. Residential segregation by income and race is bad. Mixed neighborhoods are good. The southeast is filled with segregated cities and that’s one of the reasons why they underperform in this exercise. San Francisco, on the other hand, was far more mixed in the 80′s and 90′s when the kids belonging to this study were growing up. One could debate whether that’s still the case. I guess we’ll find out in a few decades.
    2. Income inequality negatively impacts upward mobility. See The Great Gatsby Curve.
    3. Single parent households seem to have an impact on upward mobility. However, the data suggests that it’s not just about whether the child in question grew up with married parents. The percentage of single parent households in the neighborhood also matters. Because even children in dual parent households in a neighborhood with lots of single parent households, showed muted upward mobility.
    4. Social fabric. Connections to family and friends matter. It’s about having a support network. (Freakeconomics mentions a book called Bowling Alone that is now on my reading list.)
    5. Not surprisingly, the quality of public schools matters.

    All of the stats for this post were taken from this Freakeconomics Radio episode. For me, it is such an important reminder that the way we plan and build our cities can have meaningful and longstanding impacts on the kinds of children we raise.

  • Architecture as a tool of capital

    I just stumbled upon an interesting Architectural Review article from last year called: Architecture is now a tool of capital, complicit in a purpose antithetical to its social mission. The author is Reinier de Graaf, who is an architect and partner at the firm OMA.

    The focus of the article is on inequality; capitalism vs. socialism; Thomas Piketty’s book, Capital in the Twenty-First Century (which is now on my reading list); and on how Modernism lost its social mission and got repurposed as a tool that just serves capitalist interests. It went from an ideology to simply an architectural style.

    Here is an excerpt:

    “Once discovered as a form of capital, there is no choice for buildings but to operate according to the logic of capital. In that sense there may ultimately be no such thing as Modern or Postmodern architecture, but simply architecture before and after its annexation by capital.”

    Given that I am initially trained as an architect, but that I work as a real estate developer, this article hits home for me. But unlike the author, I am not as fussed by this intertwining of capital and architecture. In fact, I have always believed that the more architecture can understand its economic milieu, the more likely it can affect positive change.

    Of course, there’s the question of whether that economic milieu is even the right one in the first place. I’ll echo this blog post (on the limits of capitalism), by saying that I consider myself a capitalist, but not an absolute capitalist. Capitalism isn’t perfect.

    I like Reinier’s description of income vs. wealth (borrowed from Piketty):

    He identifies two basic economic categories: income and wealth. He then proceeds to define social (in)equality as a function of the relation between the two over time, concluding that as soon as the return on wealth exceeds the return on labour, social inequality inevitably increases. Those who acquire wealth through work fall ever further behind those who accumulate wealth simply by owning it.

    What are your thoughts?

  • 2 new ways to think about economic inequality

    We talk a lot about economic
    inequality these days. We worry, among other things, that our successful cities
    are becoming playgrounds for the rich and that housing is becoming increasingly
    unaffordable for the middle class.

    Without negating the
    importance of things such as attainable housing, I’d like to offer up two,
    potentially new, perspectives on economic inequality.

    The first is an
    essay by venture capitalist Paul Graham
    . In it, he rationally unpacks, as he always does, the phenomenon of economic inequality. One of his key points is the distinction between rent seeking degenerate economic inequality and the economic inequality caused by rapid value creation (i.e. Two Stanford students decide to create a new search engine called Google).

    “If the rich people in a society got that way by taking wealth from the poor, then you have the degenerate case of economic inequality where the cause of poverty is the same as the cause of wealth. But instances of inequality don’t have to be instances of the degenerate case. If one woodworker makes 5 chairs and another makes none, the second woodworker will have less money, but not because anyone took anything from him.”

    Of course, Paul Graham is thinking about this from the perspective of a venture capitalist that funds startups and helps entrepreneurs get rich. But what about the impacts to people who live in a city where the rich are far richer than the poor?

    That brings me to the second perspective.

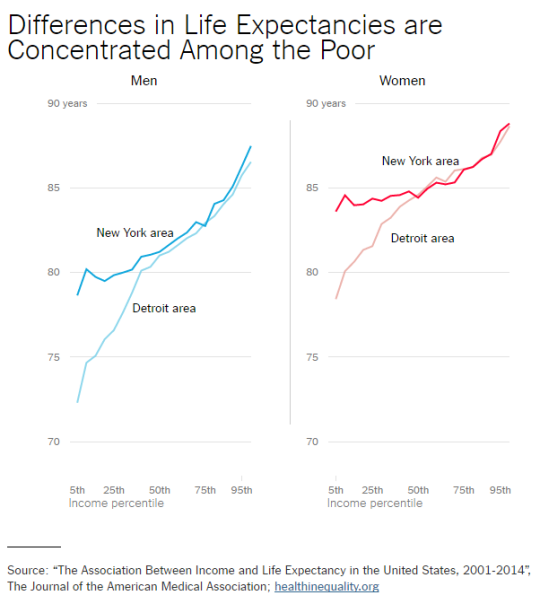
    A recent study, published in The Journal of the American Medical Association and written about in the New York Times, has discovered a surprising relationship between income and life expectancy across the United States from 2001 to 2014.

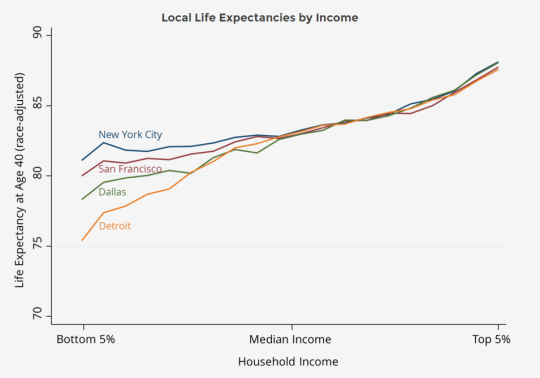
    What they found was that cities with high economic inequality – such as New York and San Francisco – actually have lower inequality when it comes to life expectancy. 

    Here is a chart from the New York Times:

    And here is a chart from healthinequality.org:

    If you’re rich, it doesn’t matter where you live. The life expectancy of a rich person in New York is roughly the same as a rich person in Detroit. (Though, as to be expected, women generally live longer than men.)

    However, as income levels fall, so does life expectancy. But it falls more in a city like Detroit than it does in New York. In fact, rich cities such as New York and San Francisco are almost model cities in this regard. Why is that?

    The biggest predictor appears to be health behaviors, such as smoking and obesity:

    “The research seems to suggest that living in proximity to the preferences — and tax base — of wealthy neighbors may help improve well-being. New York is not just a city of rich and poor, but also one of walkable sidewalks, a trans-fat ban and one of the most aggressive anti-tobacco agendas of any place in the United States.”

    So there you have it. Two, potentially new, ways to think about economic inequality.

  • The crisis of success

    I’m back and it feels great. I missed blogging the past 2 days. Though, there was something nice about not touching a computer all weekend.

    This morning I got up extra early and listened to a brief conversation between Aaron M. Renn of The Urbanophile and urbanist Richard Florida. The topic is New York’s “Great Reset”, and the impetus was a recent report (of the same name) that was put out by New York University.

    The conversation starts by talking about the resilience of New York City and its ability to accept and then reinvent itself in the wake of “creative destruction.” Destruction such as the financial crisis of 2008/2009. 

    But they then go on to talk about the challenges that New York, as well as many other cities, are now facing. Challenges brought about, not by failure, but by their tremendous success. Challenges such as income inequality and the dwindling middle class.

    The overarching premise is that we are still in the early stages of a new urban and creative economy. And that there’s lots of work to be done in order to figure out how to make it an inclusive one.

    There’s even mention of former Toronto mayor, Rob Ford.

    You can listen to the talk below. If you can’t see the embedded play button, click here.

    [soundcloud url=”https://api.soundcloud.com/tracks/221338706″ params=”color=ff5500″ width=”100%” height=”166″ iframe=”true” /]

  • The global pyramid of wealth

    Every year the London-based property consultancy Knight Frank publishes something called The Wealth Report. And it’s one of those reports that I could go through for hours. 

    It includes a ton of really fascinating stats that speak volumes about where in the world wealth is being created and how it’s moving around. And of course there are a lot of connections between wealth, real estate, and city building.

    Below are 3 diagrams that really stood out for me in the 2015 version. 

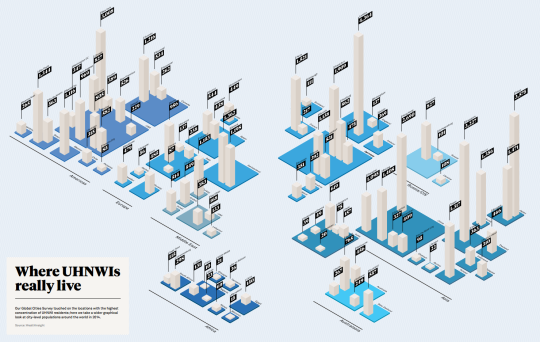
    The first diagram shows which cities have the most Ultra High Net Worth Individuals (UHNWIs). An UHNWI is defined as an individual with assets exceeding US$30 million, but excluding personal assets and property (such as one’s principal residence). Click here to see the full size image (I know the numbers are small).

    image

    Not surprisingly, London (4,364), Tokyo (3,575), Singapore (3,227), New York (3,008), and Hong Kong (2,690) are at the top of the list. But I was a little surprised – albeit happily surprised – to see Toronto (1,216) come in at #2 in North America, beating out Mexico City (1,116), Los Angeles (969), and Chicago (827). 

    The second diagram shows you how many square meters of luxury property (apartment) you can buy for US$1 million in a bunch of different cities around the world. 

    In Monaco (top end), that’ll buy you 17 square meters (183 square feet) and in Cape Town (bottom end), that’ll buy you 208 square meters (2,196 square feet).

    image

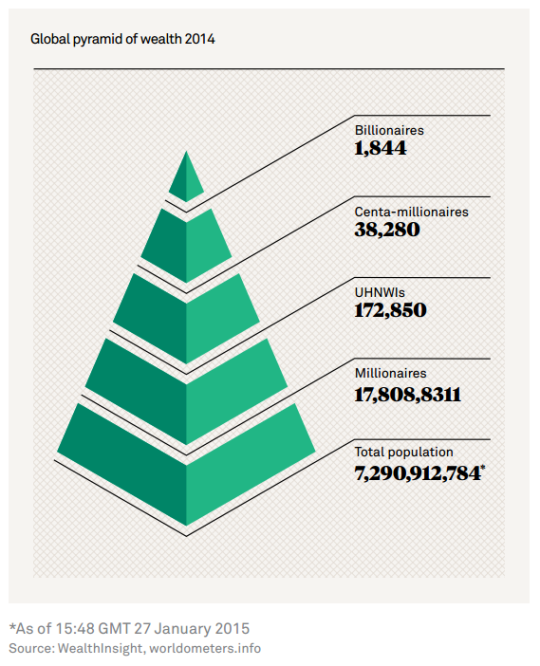
    The third and last diagram is what they call the global pyramid of wealth. It’s a pyramid of everyone in the world and then the number of millionaires, UHNWIs (see above), centa-millionaires, and billionaires. And if you do the math, the top of this pyramid comes nowhere close to 1% of the global population.

    image

    It’s fascinating (and exciting) to see where and how global wealth is concentrating. But it should also make you think about rising income inequality. I know it does for me.

  • Segregation and income inequality in cities

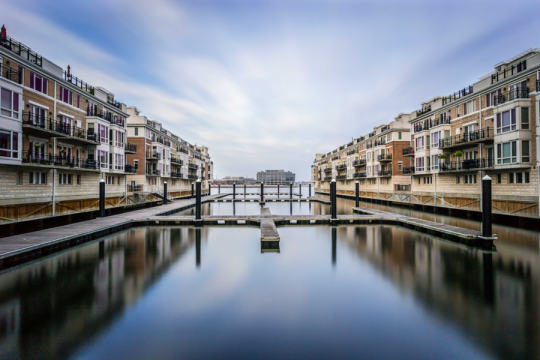
    Photograph Baltimore Harbor by Wes Bunton on 500px

    Baltimore Harbor by Wes Bunton on 500px

    Given what is going on in Baltimore and other cities in the US right now, I thought it would be worthwhile to share an interesting article from City Observatory talking about income disparity and racial segregation in cities.

    There are significant racial income gaps in the United States (as well as in Canada). According to City Observatory, the average black household earns 42% less than the average white household in America. There is, of course, lots of regional variation, but this is what it looks like nationwide.

    The interesting thing about this racial income gap though, is that there’s one factor that seems to account for the bulk (up to 60%) of the variation: residential segregation. In other words, the more segregated a city becomes, the more this black/white income disparity increases.

    Here’s a snippet from Joe Cortright of City Observatory:

    …there are good reasons to believe that high levels of segregation impair the relative economic opportunities available to black Americans. Segregation may have the effect of limiting an individual’s social networks, lowering the quality of public services, decreasing access to good schools, and increasing risk of exposure to crime, all of which may limit or reduce economic success. This is especially true in neighborhoods of concentrated poverty, which tend to be disproportionately neighborhoods of color.

    We also know that there are all kinds of negative externalities associated with income inequality. Therefore, there’s a strong case to be made for addressing segregation and the spatial organization of our cities. 

    I recommend you read the City Observatory article for a more nuanced explanation of the above relationship.

  • The MFA is the new MBA

    Harvard Business Review recently published a conversation between Roger Martin – who is the former dean of the Rotman School – and Tim Brown – who is CEO of the global design firm IDEO. The title of the talk is “Capitalism Needs Design Thinking.” But I decided to call this post something else after reading Roger say this:

    My friend Dan Pink argued in an HBR piece in 2004 that the MFA is the new MBA. I wrote to Dan to say that if that’s the case we have a problem because America pumps out a mere 1,500 MFAs a year versus 150,000 MBAs. Thirty MFAs per state per year is just a rounding error. This is one of the reasons I was so keen on transforming business education. It’s a huge infrastructure: 27% of all graduate students in America are in an MBA program. If they’re all being taught how to analyze things to death, that’s going to affect how they’ll shape the future of business.

    But what this conversation is really about is the future of democratic capitalism, which is why I think it’s a nice tie-in to yesterday’s Architect This City post about startups and inequality.

    I’m very worried about the fact that in America we’ve now gone 24 years without the median household income rising — it was the same in 2013 as it was in 1989. That’s unprecedented in American history. The longest that’s ever happened before is when it took just under 20 years to recover, after the Great Depression. This long period of stagnation has coincided with the top 1% of the economy doing spectacularly.

    And so while it’s easy to point fingers at the tech community and say that it’s to blame for rising income inequality, the reality, I think, is that there are other more fundamental issues that need addressing. Roger and Tim believe that design thinking can help. Here’s another great snippet from the former:

    I think the way that government generally works is to think, think, think, think, and then finally create legislation that brings about some change, and then they ignore their legislation and say okay, we’re finished with that. Then people go and figure out how to game that legislation, and the government doesn’t do anything about it. Whereas if they had a design view of it, they’d say when they passed a bill, that’s just the best idea we’ve got now, we have to go see how it works in practice, and then fix it. That’s just not the mentality.

    Technology is having a profound impact on the world. And it’s something that is very visible. But part of the challenge is that governments aren’t keeping up. They are almost never out in front.

    So when something new comes along, like Airbnb or Uber, the reaction is to just stop it. It doesn’t conform to the rules and regulations currently in place, and so it shouldn’t exist.

    But as Roger and Tim point out, maybe we need to look at our rules and regulations as simply part of an iterative process (like designers do). Because if we did that, maybe we’d be better equipped to transfer the benefits of innovation over to society as a whole.

    Image: HBR

  • Are startups causing inequality?

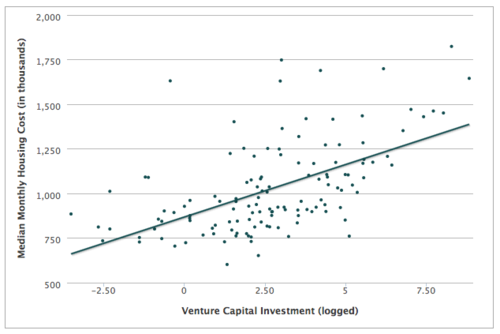
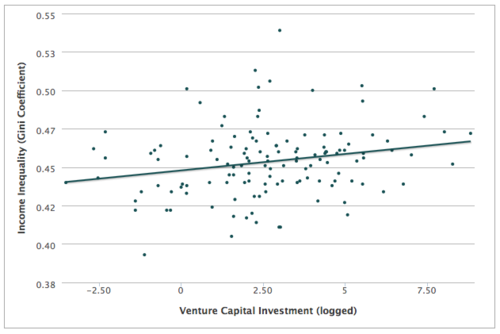
    Earlier this week Richard Florida published on article on CityLab talking about the relationship between tech innovation (in cities) and inequality. Specifically, the article deals with the correlation between venture capital investment and a variety of factors, such as monthly housing costs, wage and income inequality, and so on.

    The intent of the piece was to address the growing backlash against tech workers – in places like San Francisco – who have become the symbol for the growing gap between the rich and poor.

    The strongest correlation appears to exist between venture capital investment and housing costs. As the amount of venture capital goes up, so do housing costs – which probably shouldn’t surprise you. The rich start outbidding the poor for housing. Note: The two outlying dots at the top right, in the graph below, are Silicon Valley and San Francisco.

    image

    But when it comes to inequality, the relationship isn’t so clear. For wage inequality, there seems to be a relationship. But for the broader income inequality measure, the relationship is fairly weak. Here’s the graph:

    image

    So this is not as black and white as it might seem. Regardless, Florida ends the piece with the following statement (that I think is spot on):

    It’s time to stop pointing fingers and get on with the far more important task of harnessing the urban tech revolution to create a new urban middle class and a more inclusive urbanism—one in which many more workers and residents can participate, and one from which many more can benefit.

    The answer is not to stop innovating. That would be counterproductive. We should be be encouraging innovation, but at the same time figuring out how best to harness it for society as a whole.

    Tomorrow, I’ll touch a bit more on how we might go about doing that. I have a post planned that I think will tie in really nicely to this discussion. So stay tuned.