Daily insights for city builders, delivered every morning at 6 AM ET. I’m Brandon Donnelly — a Toronto-based real estate developer and founder of Globizen. I’ve been writing here since 2013.

Tag: housing affordability

  • Who should pay for affordable housing?

    Deeply affordable housing is mostly infeasible to build.

    This is why you don’t see the market naturally building this kind of housing on its own. It, for the most part, doesn’t make any economic sense to do so. So this is also why the US has fabricated things like low-income housing tax credits. They are a way to make up the economic shortfall that exists with low-income rental housing and get the private sector building this kind of housing.

    We sometimes try to convince ourselves — or maybe it is a way of shirking responsibility — that there can be such a thing as no-cost affordable housing through things like inclusionary zoning. But I think we all know that there’s no such thing as a free lunch. Somebody is ultimately going to need to pay. The big question, of course, is who should that be?

    By definition, we acknowledge that the people who will ultimately live in these affordable homes cannot afford to pay market rates. So by default, the subsidies will need come from somewhere else. But again, from where and from who? Should it be specific people who pay or should it be mostly everyone who pays?

    If we return to the Toronto building industry’s favorite topic right now — development charges — you’ll see that under the current rates, every new 2 bedroom or larger apartment that is constructed must pay $3,727 toward affordable housing. Under the proposed rates, this will increase to $12,545 for every new large apartment. It’s by far the largest proposed percentage increase (237%) and also one of the largest service items.

    This raises two interesting philosophical questions.

    One, should the buyers of new housing be responsible for contributing to affordable housing in this way? Because what we are in effect saying to these people is, “Hey, you can afford to buy a new market rate home, so we’re going to collect some additional money from you — $12,545 to be exact — so that we can try and help those that aren’t in the same position as you. We’re also going to mandate additional affordable homes within your building and we’d like you to subsidize those too.” This is one way to redistribute wealth.

    But if the goal is to try and create more broad-based affordability, an alternative approach might be, “Hey, you already own a home and it has gone up a lot in value, so we’re going to collect some additional money from you over time so that we can try and help those that aren’t in the same position as you.” This would be the property tax approach. It’s probably not perfect, but might it be a more fair and equitable way to redistribute wealth?

    The second interesting philosophical question has to do with whether this is consistent with the dogma that growth should pay for growth. The idea behind development charges (also known as impact fees in some parts of the world) is that they should pay for the cost of new development. This makes complete sense. When you build new housing you certainly need some additional stuff — everything from additional school capacity to emergency services.

    But the question here is whether the construction of new housing in and of itself creates a direct need for more affordable housing, and therefore should be charged for it. Asked in the opposite way, if you weren’t building this new housing, would you then no longer need this affordable housing, just like you no longer need that additional school capacity?

    This is definitely not the case. In fact, I would argue that the opposite is true. If you don’t build any new housing in a growing city, you actually exacerbate the problem of affordability. So here’s a provocative thought. Rather than a charge, should this affordable housing line item actually be a credit towards each new project given that it benefits affordability?

    While it may not make any economic sense to build affordable housing, I think that many of us would agree that it makes a lot of social sense to build affordable housing. We know that our cities are at their best when they are both diverse and inclusive. The problem is that we can’t agree on who should pay for it.

  • Ontario proposes target of 1.5 million new homes over the next 10 years

    Yesterday I wrote about our housing doom loop.

    Today, the province of Ontario responded (maybe not to my post) by publishing this Housing Affordability Task Force report. In it, are 55 recommendations to improve overall housing supply across the province, with the end goal of adding 1.5 million homes over the next 10 years.

    I’m still making my way through the report, but the recommendations can basically be grouped into these five main buckets (taken verbatim from this press release):

    • Make changes to planning policies and zoning to allow for greater density and increase the variety of housing.
    • Reduce and streamline urban design rules to lower costs of development.
    • Depoliticize the approvals process to address NIMBYism and cut red tape to speed up housing.
    • Prevent abuse of the appeal process and address the backlog at the Ontario Land Tribunal by prioritizing cases that increase housing.
    • Align efforts between all levels of government to incentivize more housing.

    Reform is badly needed. And I have gone on and on and on and on over the years about a number of the problems associated with how we build new homes and how we expect them to suddenly become more affordable.

    Still, I think that most of the general public would be shocked to learn how long things take, how complicated we have decided to make land use approvals, and how a single person with a vested interested in seeing no development can hold up the delivery of thousands of new homes.

    Progress is measured in years and decades. Months simply evaporate while you wait for the next PDF document to grant you access to some other labyrinthian planning hurdle. It doesn’t need to be this way.

  • Housing doom loop

    This discussion between Patrick O’Shaughnessy and Marc Andreessen is a great follow-up to my recent post about the productization of housing. Broadly speaking it’s about tech, software eating everything, and the future of the world. But if you skip to around the 15 minute mark, Marc talks about the growing divide in our economy between sectors that are changing rapidly and sectors that are changing slowly.

    Examples of the former include things like computers, media, retail, cars, and a lot of the other stuff that we regular consume. Examples of the latter include things like healthcare, education, and housing (you know, the pillars of the American Dream).

    The noteworthy problem with this divide is that the fast changing sectors are producing things that have been getting more affordable over time. The specific example that he gives is televisions. Think about how much more TV you can get today compared to when they were first introduced.

    In contrast to this, things in the slow changing sectors keep getting more expensive. The same university education is exponentially more expensive today than it was a few decades ago, even though it’s far more important for people to have an education than to own TVs.

    A similar thing can be said about housing. How much has really changed in terms of the way we build new homes?

    One of the common threads across these slow change sectors, Marc argues, is strong government intervention. We restrict supply such that we can’t meet demand. We then respond to higher prices by trying to subsidize demand, but this only drives prices up even further. Because, at the end of the day, we haven’t addressed the underlying issue.

    The result is a doom loop.

    If you can’t see the embedded podcast above, click here.

  • Drive until you qualify

    The “drive until you qualify” approach to finding housing that you can afford is a well established practice. Anecdotally, I can tell you that I have friends who are right now looking for a grade-related home under the C$1 million mark. This constraint, as most of you know, is pushing them to the outer reaches of Toronto’s suburbs. But if it were up to them, it would be their preference to stay in the city. According to the “two millennials” behind The Habistat, the average distance of an entry level detached house from the Toronto core (defined as a 3 bed, 1 bath under $800,000) is now 81.8km.

    There’s a lot to be said about this. For one, home prices across many/most markets are way up. Earlier this week on the blog it was mentioned that the average price of a US home is up about 19% year-over-year. This is likely unsustainable. We are coming off of a period of easy money policies and at some point things will normalize along with the broader economy. Looking at the equity and crypto markets, it may be happening right now, but I don’t really know. (Fred Wilson wrote a post last year calling this “one of the great asset bubbles of modern times.”)

    We know that the centralizing forces inherent to most cities have been weakened during this pandemic. For periods of time, they were completely off. So it is no surprise that we have seen greater decentralization (sprawl) than what might have ordinarily happened. I was in a (zoom) meeting this past week with somebody who has spent the last two years traveling around South America while working remotely. It sounded like a lot of fun and I was admittedly a little bit envious of her adventures. But as I argued at the beginning of this year, I think most people are going back to offices and this centralizing force will have an impact on real estate.

    Because “driving until you qualify” is a function of an affordability constraint, it tells you certain things about consumer preference, but not all things. What I mean by this is that it tells you that somebody is willing to trade the cost of a commute for more space and/or the housing type of their choice. This has been an easier trade during COVID because the cost of commuting has been relatively — albeit temporarily — low for many people. So less of a discount for distance. But what I think this doesn’t tell you is what true consumer preference would be if all things were more equal and we increased housing supply and options in other areas of our cities.

    At the same time, there’s a very real question of whether the measuring stick in the above chart should be a grade-related detached house? Is this a reasonable expectation in the same way it was for prior generations? I am not a fan of dictating what people should and shouldn’t do. But maybe 100km away from the core becomes untenable. And again, maybe if we increased both supply and options, we would find new housing preferences revealing themselves. I am specifically thinking of those who would prefer to stay in the city, but can’t find something they think is suitable.

    At the end of the day, we can’t ignore the fact that we are profoundly hypocritical when it comes to the delivery of new housing. We acknowledge that we’re in a housing crisis and we acknowledge that we need more affordable housing (both for sale and for rent), and yet we continue to make it systematically more difficult and more expensive to deliver it. The development charges, parkland fees, and many other costs that continue to increase and get applied to new housing are a real worry to those in the industry.

    It is a worry because we’re all wondering how much price elasticity is left in the market. That is, how much more can consumers afford before they stop buying and renting? It is a worry because it means that new rental housing, which has always been a challenge to pencil in our market, is now completely infeasible in many more submarkets. Our solution to all of this is to mandate a certain number of affordable units in new developments. But this is yet another tax on new housing.

    To be fair, the delivery of new housing is subject to countless competing interests. This is arguably why it is such a tricky problem to solve and why there are no easy answers. But that’s what we do around here. We explore new ideas. And maybe, just maybe, there are other options besides just driving until you qualify. Next up (or soon up): A look at the competing interests behind new housing.

  • How much home can you afford?

    Each quarter, HSH.com publishes a report that looks at the annual income required to quality for a residential mortgage in the 50 largest metropolitan areas in the United States. To do this, they look at the median home price for each city and then apply a 28% debt-to-income ratio (principal and interest payments divided by before tax salary). They also assume a 20% down payment and a 30-year fixed-rate mortgage. In their latest report, that comes with an interest rate of 3.15%.

    Below is a chart showing what they consider to be the 10 most affordable and the 10 least affordable metros (chart via the New York Times). I don’t think the cities on this list will necessarily surprise many of you (though I didn’t think Pittsburgh was this affordable), but it is interesting to see it all quantified. It’s also worth thinking about what might happen to these figures as that 3.15% number comes down. Shockingly, the price of highly-levered assets tends to be correlated with financing costs.

  • The Knight Frank Global Affordability Monitor 2019

    Here’s a chart from Knight Frank’s 2019 Global Affordability Monitor that I think you’ll find interesting:

    It compares real home price growth and real household income growth (after tax) over the last 5 years for 32 world cities. The bolded percentages represent the former and the non-bolded percentages represent the latter.

    Consider the variations here.

    Amsterdam saw a real home price change of 63.6%, but a household income change of only 4.4% (although the circle looks to be in the wrong spot if this number is correct).

    Moscow, on the other hand, saw flat home prices (0.1%) and a 22.7% increase in household income.

    Though San Francisco is the star in terms of income growth.

    Sao Paulo, unfortunately, saw a dramatic decline in both home prices and incomes. It’s in the bottom left corner.

    When I look at this chart, I don’t see a strong correlation between household incomes and home prices. And the proportions of the chart tell you that the y-axis is moving more than the x-axis.

    But if the top number exceeds the bottom number, then you could come to the conclusion that housing affordability has gotten worse over the last 5 years.

  • Average living space per person in Hong Kong

    This recent NY Times article — which makes the case that the current protests in Hong Kong are at least partially a result of inequality — has a pair of interesting diagrams that speak to the city’s tight housing market.

    The first compares average living space per person in Hong Kong to Paris and New York City. New York City appears palatial compared to the illegally subdivided apartments that are discussed in the article.

    The second looks at housing affordability as a multiple of median household income. Hong Kong is over 20x. I am curious what median incomes were used for each of the cities. A small denominator makes the multiples look worse.

    In this chart, New York also includes the entire metropolitan area, which would help to improve its affordability ranking. So one could argue that this isn’t really a fair comparison.

    At the same time, none of this changes the fact that Hong Kong has some of, if not, the most expensive housing in the world.

    Images: NY Times

  • US cities with the highest millennial homeownership rates

    Across the 50 largest metro areas in the US, about 31.9% of millennials — those aged 18 to 34 — owned a home as of 2017. And according to recent census data (via the Redfin), only 5 of these cities had a millennial homeownership rate higher than 35%. They are as follows:

    The top spot goes to Salt Lake City, which sits at just over 40%. It also has the highest share of businesses owned by millennials at 8.4%. Not surprisingly, the cities on this list all have relatively affordable home prices, with Detroit being the most affordable.

    I think you could interpret this list as a bit of a leading indicator for US cities on the rise. Affordability, and walkability, may be the draws today, but as millennials lay down roots, start businesses and earn more money, I am sure we’ll see these cities transform even further.

  • How impactful will the new First-Time Home Buyer Incentive be?

    This week’s federal budget announced two measures that are intended to improve housing affordability.

    The first is a modification to the Home Buyers’ Plan. This is a plan that gives first-time home buyers the ability to do a tax-free withdrawal from their RRSP (it does, however, have to be repaid within 15 years). The withdrawal limit was increased from $25,000 to $35,000.

    The second measure, which is the one that got everyone’s attention, is the new First-Time Home Buyer Incentive. Through this program, CMHC will offer first-time home buyers (who have the minimum down payment required for an insured mortgage) the option of a “CMHC shared equity mortgage.”

    What this effectively means is that CMHC will give first-time buyers an interest-free contribution for 10% of the purchase price of a new home (5% in the case of a resale). There’s no interest, but it does need to be paid back at the time of a sale. The higher percentage for new build homes is intended to stimulate housing supply.

    It is still not clear whether CMHC will be expecting to participate in any increase (or decrease) in the value of the properties. But presumably, yes, since it’s called a “shared equity mortgage.” All of this is expected to come into force by the fall.

    Here’s an example of how this program is intended to work.

    If a first-time buyer purchases a new home for $400,000 with a 5% down payment, the insured mortgage amount would normally be $380,000. This is the highest loan-to-value you can get with CMHC mortgage loan insurance. With this new measure, the mortgage size would reduce to $340,000 and so the purchaser’s monthly debt service would drop accordingly, thereby helping with overall affordability.

    The caveat to all of this is that this incentive will only be available to first-time home buyers with a household income under $120,000, and the insured mortgage and incentive amount cannot be greater than 4x the participants’ annual household income.

    What this means is that this program really only touches the sub $500,000 market. And in highly desirable cities like Toronto and Vancouver, that market isn’t all that big.

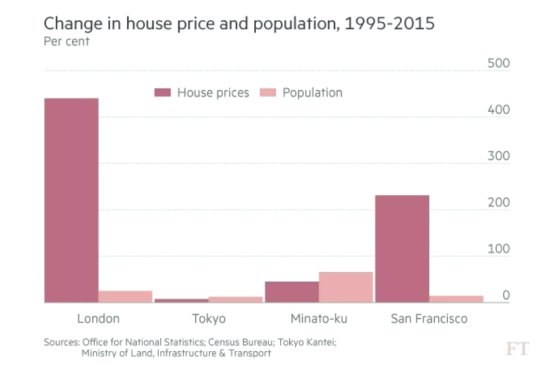
  • Japan’s solution to housing affordability

    image

    There’s a debate among urbanists as to the full impact of housing supply on overall affordability. But it should make intuitive sense that as new people move to a city and as new jobs are created, there will be a need for additional housing. Here is an excerpt from Vox citing a recent FT article talking about how Japan may have figured out the solution to rising home prices:

    The reason, argues Financial Times writer Robin Harding, is that Tokyo does a better job of allowing housing supply to keep up with housing demand. In 2014, Tokyo issued permits for 142,417 new housing units. In contrast, the entire state of California — which has three times the population of Tokyo — issued permits for only 83,657 new housing units. Little wonder that demand for housing has outstripped supply in the Bay Area.

    In the United States, local housing markets are plagued by grassroots “Not In My Back Yard” (NIMBY) activists who organize to stop efforts to build town homes and apartment buildings in their local neighborhoods. Because every construction project is located near somebody, the result tends to be that little housing gets built anywhere.

    I don’t have a copy of the FT article and I do firmly believe that supply matters a great deal, but I think there are also a number of other factors that need to be taken into consideration here. Japan has a depopulation problem. The country has lost about 1.4 million people since 2010

    They also have fairly insular views around immigration. They are over 3.5x larger than Canada in terms of population and yet they take in fewer immigrants each year. So I think it’s worth looking at this conclusion closely. (This is me trying to avoid confirmation bias.)

    Image: Vox