
January 25, 2025 · View original
One of the interesting things about street networks is that — once laid out — they rarely change in a substantial way. Not unless Haussmann comes along and decides to renovate. That can be a good thing if you get it right like in the case of Philadelphia or Barcelona. But it can also be a bad thing if you’re maybe wishing the founders went with design option B.
On that note, here’s an interesting set of polar histograms from Geoff Boeing, who is a professor of urban planning and spatial analysis at the University of Southern California, that sorts city street networks by most-ordered/gridded to most-disordered:
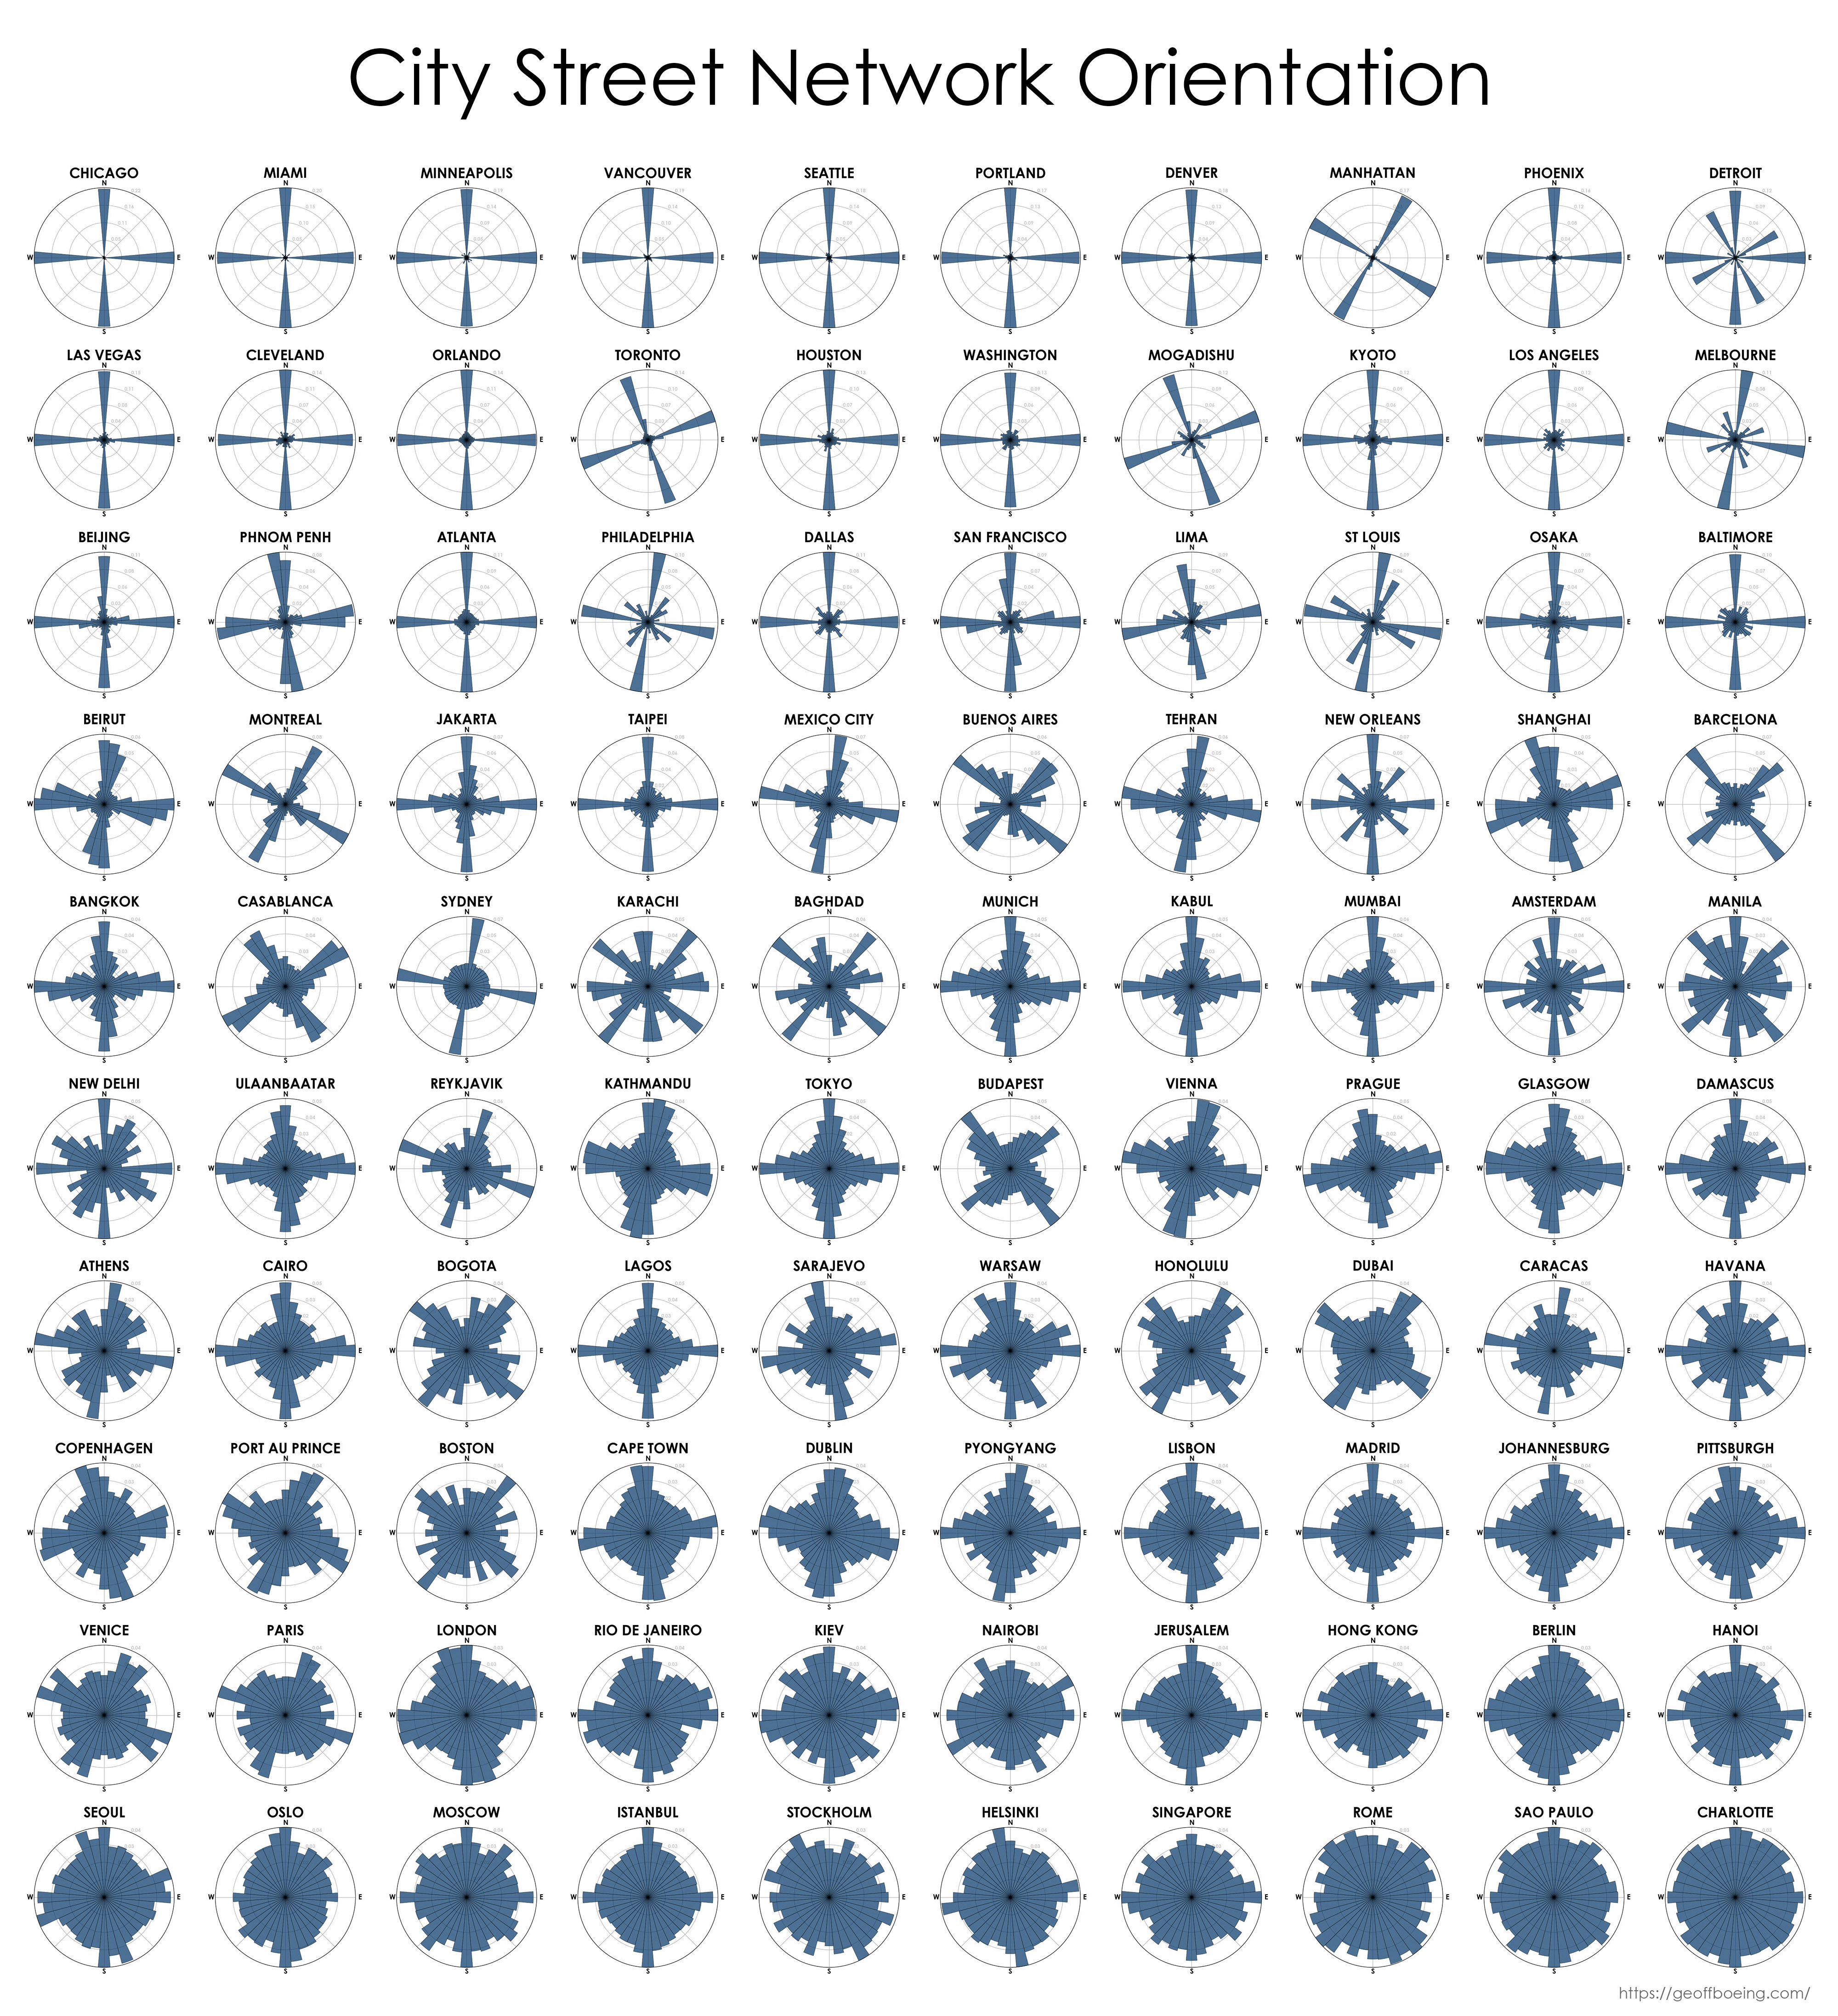
What these diagrams don’t tell you is how walkable or dense a city might be. But they do tell you how many of its streets follow a strict orthogonal grid — see Chicago and Beijing — and how many of its streets are all over the place, like in the case of Rome and Charlotte.
They also tell you when the grid is askew, like in the case of Toronto (because of the angle of our shoreline) and in the case of Manhattan (because of the angle of the whole island). And if you were to revisit these diagrams well into the future, I suspect you wouldn’t see much difference from what you see here.