Daily insights for city builders, delivered every morning at 6 AM ET. I’m Brandon Donnelly — a Toronto-based real estate developer and founder of Globizen. I’ve been writing here since 2013.

Tag: dubai

  • Prime residential pricing in 10 global cities

    The below graphs are taken from a recent (June 2019) report by Knight Frank on “prime” residential pricing across the world. They define “prime” as generally being the top 5% of each market by value. What these graphs show are the spread between the average price of a prime property and the top price achieved in that market.

    The most expensive market is Hong Kong. The average price of a prime property in 2018 was USD 4,251 per square foot (or USD 45,760 per square meter) and the top price achieved was in 2016 at USD 28,154 per square foot (or USD 303,051 per square meter).

    Using the 2018 average, a 350 square foot studio apartment would run nearly USD 1.5 million (or almost CAD 2 million), assuming there are “prime” studios available in the market. Remember, we are talking about the top end of the market.

    If you’d like to download a copy of the full report, you can do that over here.

  • The coldest and hottest global cities

    Below is a list of the 44 cities found in the 2018 Global Power City Index by the Mori Memorial Foundation’s Institute for Urban Strategies.

    The index ranks the major cities of the world according to their “magnetism”, which they generally define as a city’s ability to attract people, capital, and businesses from around the world.

    As with all rankings, the output depends entirely on the methodology that you use. The GPCI seems to have the right executive committee in place. It includes global city authorities like Saskia Sassen. But that’s not really the point of today’s post.

    Beside each city, I have added the average highs and lows (in celsius) for both the coldest and hottest months of the year. For cities in the northern hemisphere, these are typically January and July/August, respectively.

    I have also added the spread between the hottest and coldest months to get a sense of variability. I always find it interesting to see how cities like Singapore, Kuala Lumpur, Jakarta, and Mumbai basically stay the same temperature all year round.

    When you look at this list, remember that you can ski in Dubai.

    All weather data taken from the NOAA (National Oceanic and Atmospheric Administration).

  • InfraScapes by Paolo Pettigiani

    I just discovered the work of Italian photographer, Paolo Pettigiani. He specializes in something called infrared photography, which is photography that captures the wavelengths of light that generally aren’t visible to us humans.

    Paolo shoots with a full spectrum Nikon D750. What this means is that the camera’s sensor is sensitive to, well, the full spectrum of light: UV, visible, and infrared. Using this photography technique, he has coined something he calls “InfraScapes.”

    Here are a few of his photos from Dubai (source):

    The reason these photos look the way that they do is because anything with chlorophyll — such as grass and trees — really reflects infrared light. The result is a generally muted landscape with pops of pink. Perhaps this could be used as a technique to visually evaluate the greenness of our cities.

    All photos by Paolo Pettigiani

  • And the award for the tallest building of the year goes to…

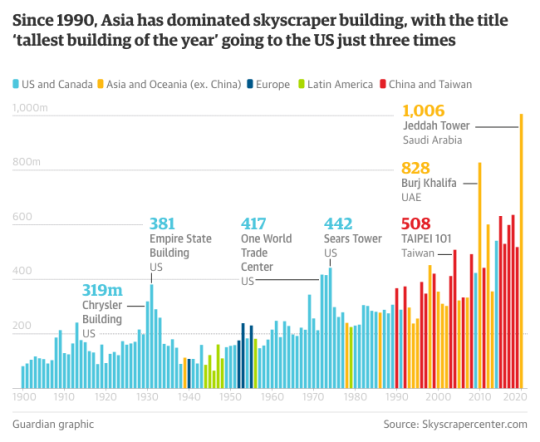
    The Guardian recently published an article on vanity height in skyscrapers. What this is referring to is the unoccupied portions of tall buildings which are built purely for vanity reasons – that is, to increase the face height of the building and claim some superlative title.

    Example: 

    The tallest building in the world is currently the Burj Khalifa in Dubai. It’s 828m tall. To put that into perspective, the CN Tower in Toronto is 553m. But according to the Council on Tall Buildings and Urban Habitat, 29% of the Burj Khalifa’s height is actually unoccupied or “vanity space.” In other buildings, such as the Burj al Arab (also in Dubai), the amount of unusable space is as high as 39%. 

    For the purists out there, this of course raises the question of what should should be counted when assessing building height. Should it only be spaces where humans typically inhabit? The CN Tower has a lot of unoccupied space, which is why it is frequently excluded from these sorts of ego rankings. 

    But semantics aside, this is obviously not a new phenomenon and it’s interesting to think about this race to the sky as a proxy for what’s going on in the world. Below is a chart showing which regions have been able to lay claim to the “tallest building of the year” since 1900. 

    Since 1990, it has been all about Asia and Oceania and China and Taiwan…

  • Prime property appreciation around the world

    Every year for the last decade, Knight Frank has published something called The Wealth Report. I’ve written about it before, but it’s basically a look at “prime property” and global wealth.

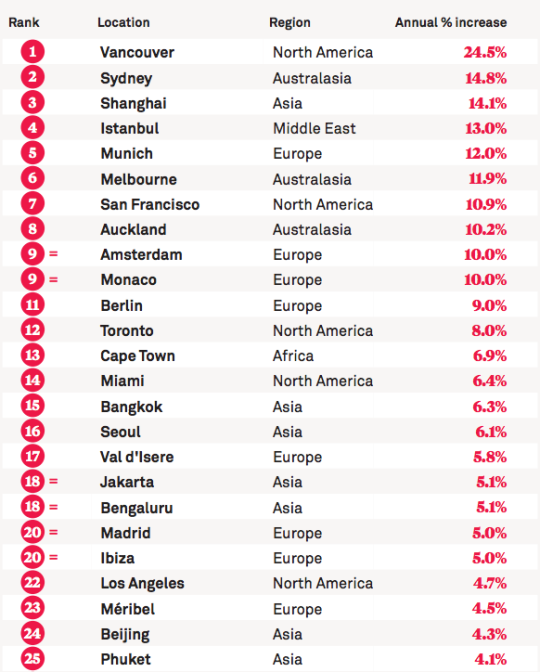
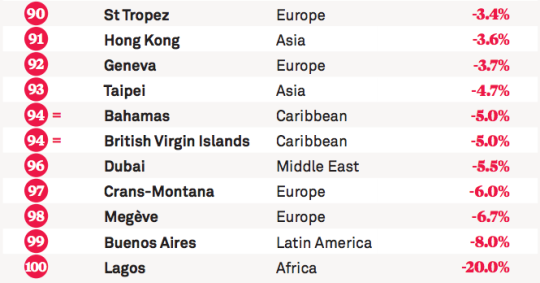
    As part of the report, they have something called the PIRI 100. It’s their “Prime International Residential Index”, which looks at luxury residential property prices around the world. They generally define “prime property” as being the top 5% of each market according to value.

    This year, the top 25 locations in their PIRI 100 are as follows (for the most part, the data is up to December 2015):

    image

    Here in Canada, we like to talk about the insanity of the Vancouver and Toronto real estate markets. This list helps to put that into perspective. Even by global standards, Vancouver is at the top of the pack by quite a significant margin. 

    It’s worth noting that since this is a “prime property” index, it’s pretty safe to assume that the buyer profiles for these sorts of properties would have a significant international bias. So in a way, this list is really about global capital flows.

    Here are the bottom 10 locations on this year’s list:

    image

    If you’d like to see the full list, click here.

  • A new era of (digital) globalization

    McKinsey recently published a report called Digital globalization: The new era of global flows.

    The overarching thesis is that we are transitioning to a data-driven global economy:

    “Flows of physical goods and finance were the hallmarks of the 20th-century global economy, but today those flows have flattened or declined. Twenty-first-century globalization is increasingly defined by flows of data and information. This phenomenon now underpins virtually all cross-border transactions within traditional flows while simultaneously transmitting a valuable stream of ideas and innovation around the world.”

    One of the benefits of this shift is that it has become easier for emerging economies and individuals from all around the world to participate.

    Of course, not all countries and cities are participating equally. In their report, McKinsey ranks the top cities according to five global flows. In each case a proxy was used:

    “Unfortunately, data on global flows are not available at the city level. However, we have obtained data that serve as proxies for each of our five global flows. Container port volumes approximate goods flows; airport passenger volumes serve as a proxy for goods, service, and people flows; the ranking of cities in the Global Financial Centers Index by the Z/Yen Group provides an indication of financial flows; the number of foreign-born residents in a city measures people flows; and Internet bandwidth approximates data flows.” 

    Using this methodology, they believe that the world only has 8 truly global cities right now: New York, Los Angeles, San Francisco, London, Singapore, Shanghai, Hong Kong, and Dubai. They are the colored cities listed below:
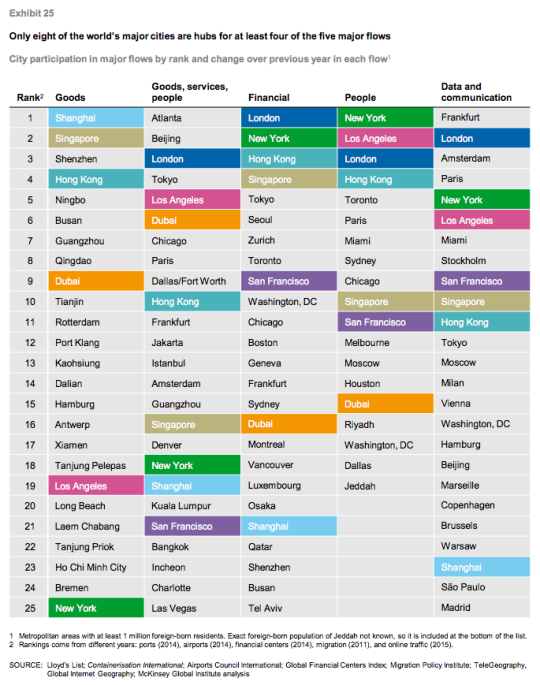
    I always take these city rankings with a grain of salt. This stuff is not easy to quantify and a lot depends on the methodology that you use. 

    For instance, Atlanta sits on the top of “goods, services, and people” because it has the busiest airport in the world according to passenger volume. (It’s the primary hub of Delta Air Lines.) But is that enough to assert that Atlanta is #1? Maybe. Maybe not.

    In any case, the report is packed full of information. If you’d like to take a look, click here.

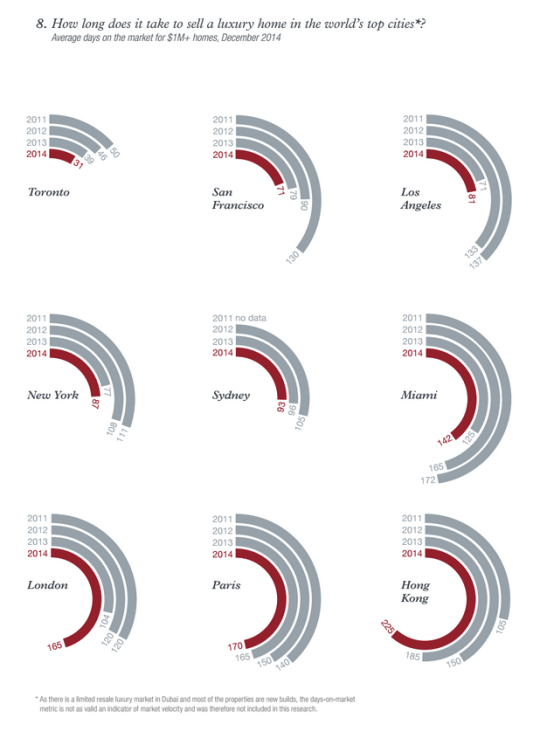
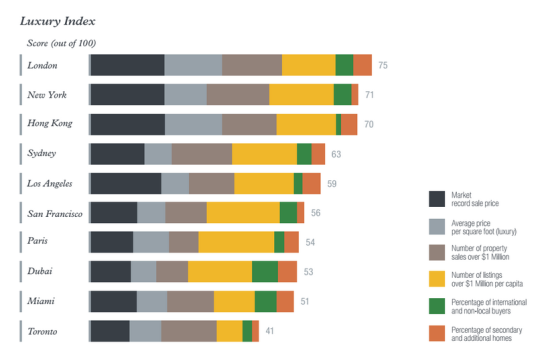
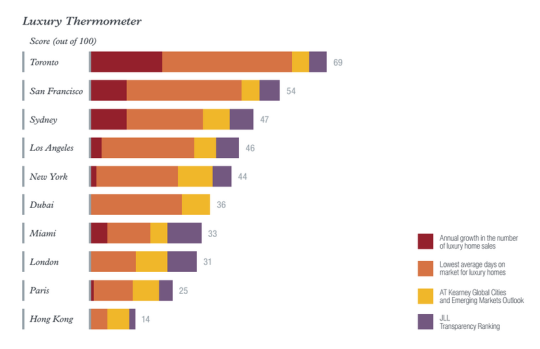
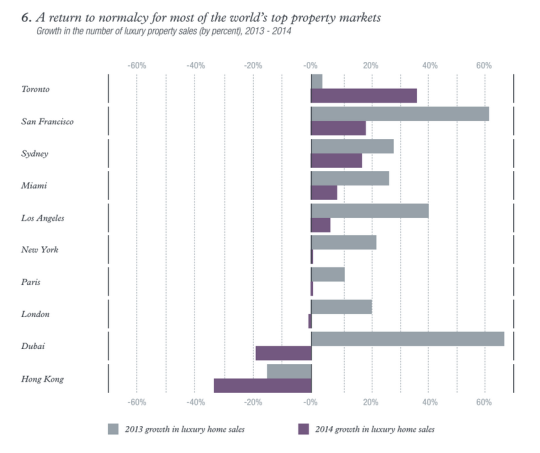
  • The world’s top 10 cities for prime property

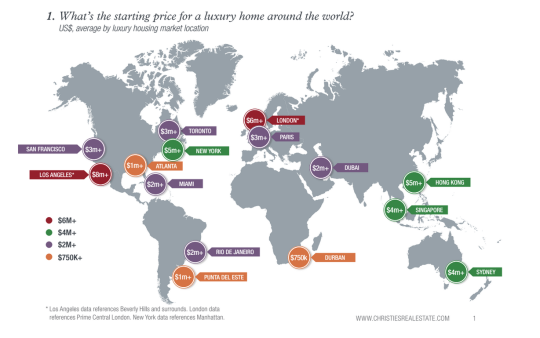
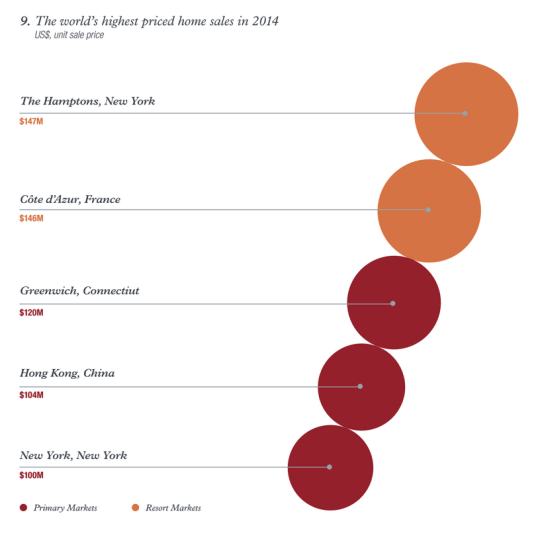
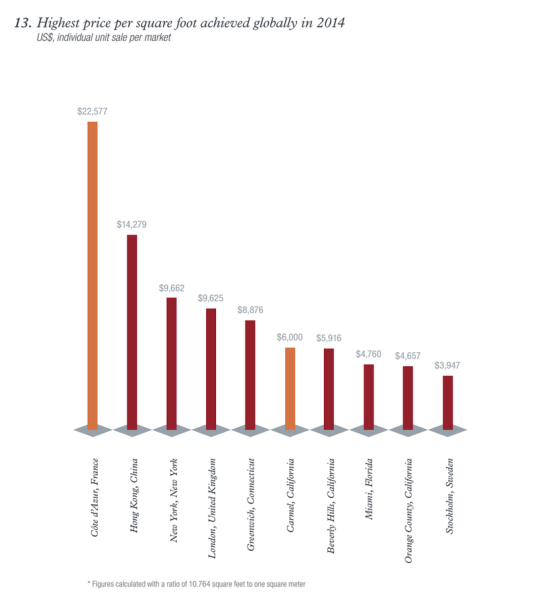
    This morning I read through a real estate report called Luxury Defined. It’s a look at the global luxury real estate market across “the world’s top 10 cities for prime property” and about 70 regional and resort destinations.

    It’s interesting to look at the trends and see how high-net-worth individuals (HNWIs) are choosing to allocate their funds in residential real estate. Here are some of the charts and diagrams that caught my eye as I was going through it (you may need to zoom your browser in):

    If you’d like to download the full report, click here. It’s free, but you’ll need to enter your name and email address.

  • Dubai time-lapse video

    I’ve only been to Dubai once. I had a lot of fun, but it’s not my favorite city in the world. That’s largely because I tend not to be drawn to cities where you feel like you need to drive in order to properly experience it.

    But boy, this time-lapse video sure makes the city look cool. Click here if you can’t see the video below.

    [youtube https://www.youtube.com/watch?v=zGtz_GOA79w?rel=0&w=560&h=315]